Fatal road accidents caused by sudden death of the driver in
Finland and Vaud, Switzerland
M. O. HALINEN* AND A. JAUSSif
*Accident and Emergency Department, Kuopio University Hospital, Kuopio, Finland; ^Policlinic Medicale
Universitaire, Lausanne, Switzerland
KEY WORDS: Fatal traffic accidents, sudden incapacity of the driver, death at the wheel, cardiac arrest, automobile accidents.
We investigated the incidence of fatal traffic accidents caused by sudden incapacity of the driver due to cardiac and other illnesses. The retrospective analysis was gleaned from Finnish traffic accident data files from 1984-1989, and police records of traffic accidents, from Canton de Vaud, Switzerland from 1986-1989. The annual rates of all traffic fatalities per million inhabitants were 125 in Finland and 212 in Vaud. Sudden driver incapacity due to acute illness caused 1-8 and 7-3 automobile driver deaths annually per million inhabitants in Finland and in Vaud, respectively. The corresponding rates for all-cause traffic deaths were 326 and 423, for driver deaths 105 and 167, and for those due to driver incapacity 4-7 and 15-6.
Sudden driver incapacity caused 1-5% of all traffic deaths in Finland, and 3-4% in Vaud. Probable cardiac arrest caused 21% of all drivers' deaths in Finland and 1-7% in Vaud, respectively. Deaths caused by professional drivers' sudden incapacity were responsible for 0-11% of all traffic deaths in Finland, and for 0% in Vaud. Old age and short mileage were associated with illness-caused accidents.
Accidents caused by sudden incapacity of the driver are rare causes of traffic deaths and hard to foresee. While this report relates to all drivers, we suggest there should be individual risk stratification for professional drivers with heart disease. However, non-professional drivers who are elderly and who have symptomatic cardiac disease should limit their driving to short distances and at low speed.
Introduction
Natural death at the wheel is rare, being causal in only 6/10 000 accidents [1>2>. Some data indicate that the hazard to other road users in these cases is minimal [3~51, but sudden incapacity of a driver at the wheel of a heavy goods vehicle or of a bus may cause serious injuries and death to passengers in other vehicles and to pedestrians. In order to increase road safety, driving licences in individuals with known disease are restricted. In the U.K. detailed and strict limitations are imposed on drivers of heavy goods vehicles with heart disease'61, but in other European countries the guidelines are looser and variable. When an ESC-EEC task force committee on cardiological standards for vocational drivers met in 1990 and 1991, it was found that epidemiological statis-tics relating to road transport accidents due to cardiac illness were scant. For professional drivers the data are particularly limited.
Finland has a nationwide, standardized investigation method and database for all fatal road accidents, and in canton de Vaud, all fatal traffic accident data recorded by police were available for the present investigation. We studied road accident statistics to obtain basic
Submitted for publication on 11 May 1993. and in revised form 1 October 1993.
Correspondence. Dr Matti O. Halinen, Accident and Emergency
Depart-ment. Kuopio University Hospital. FIN-70210 Kuopio Finland.
data about the licence revoking policy in Europe for professional drivers.
Material and methods
FINLAND
Systematic and multidisciplinary investigation of fatal traffic accidents started in Finland in 1967m. Since 1984 all traffic accidents have been investigated by official teams if death occurred within 3 days of a motor vehicle accident. The investigation teams consist of a police officer, a motor engineer, a traffic engineer, and a forensic scientist. All who die in traffic accidents have an autopsy taken by a forensic scientist using standard methods. A police questionnaire includes information on driver's health, medication and possible new symp-toms before the accident. Possible illness as a cause of accidents is judged and classified by medical advisors in the multidisciplinary teams. The database classification does not include the specific diagnosis of the illness which caused the accident.
The data are processed centrally by the Traffic Safety Committee of Insurance Companies. Since 1989, the data have been available in the same data base. Pedestrian deaths and natural deaths in vehicles not involved in a collision are not investigated in the present study.
Road accidents and sudden death 889
The geographical area of Finland is 337 032 km2 and its population during the study years 1984—1989 was about 5 million. The median number of automobiles was 1 874 334 and of motorcycles 49 442 during the study years. The total number of accidents reported to the police was 253 356 and the number of road accidents with personal injuries was 51 897.
In the present study, the data from years 1984-1989 were analysed to find whether the primary cause of the accident was a fit or sudden loss of consciousness by the driver due to sudden illness. The author (M.O.H.) investigated the original documents. Acute illness was classified as cause of the incapacity and of the accident in 48 incidents. Two case files were not available for the classification of the disease which caused the sudden incapacity. Neither case included a professional driver.
SWITZERLAND
In Switzerland all road accidents are registered and published annually by the federal office of statistics. The data from 1985 to 1989 served as a base for general information, particularly as regards the causes of acci-dents, the vehicles involved and the age distribution of the drivers.
The investigation of all road accidents in the canton de Vaud, with a population of 550 000 inhabitants, roughly 8 to 10% of the Swiss population, permits a more detailed study. The geographical area of Vaud is 3211km2. The median number of automobiles was 257 130 and of motorcycles 18 130 during the study years. The total number of accidents reported to the police was 35 931.
We analysed all the police records of accidents which occurred in a 4-year period from 1986 to 1989 and which were registered in the data bank as attributable to the key word 'malaise' (a popular term in French meaning suddenly feeling unwell, such as a result of sudden loss of consciousness or a fit).
Final diagnoses of the causes of accidents were based on (1) records, which always included a detailed descrip-tion of the mechanisms of the accident, of the drivers' condition supplied by themselves and/or the police and/or witnesses and frequently medical follow-up infor-mation; (2) the medical records collected by the Public Health office of the canton in all cases; (3) the autopsy findings in about half of the fatalities.
DEFINITIONS
A probable cardiac arrest at the wheel was considered if (1) loss of consciousness occurred at the wheel, and (2) if a severe coronary artery disease with or without old or new myocardial infarction was found at autopsy, or if there was a documented history of coronary artery disease or a recent onset of typical angina and (3) there was no history of epilepsy. A possible cardiac arrest at the wheel was considered if (1) loss of consciousness occurred at the wheel, and (2) there was neither a history nor an autopsy finding of coronary artery disease nor a
history of epilepsy and no evidence of the possibility of suicide.
Epileptic fit was classified as a cause of an accident when there was a history of epilepsy and the heart was normal at autopsy. Diagnosis of intracerebral haemor-rhage was made on the basis of autopsy findings or typical medical records from the hospitals.
STATISTICAL METHODS
Confidence limits for accident and fatality rates were calculated by the formula:
=p± 1,96 Jp(\-p)ln
where p = the annual rate of accidents/deaths per population/vehicles, and n = the number of population/ vehicles.
Results FINLAND
The number of accidents with fatalities in motor vehicles during the 6-year study period are given in Table 1. The rate of accidents investigated by the Safety Committee was 94-9% of all fatal accidents in Finland. Single vehicle accidents comprised 19-4% of all accidents and 30-5% of all drivers' deaths.
Altogether, sudden incapacity by the driver caused 248 fatal accidents (0098% of all traffic accidents re-ported to the police, and 7-87% of all fatal accidents investigated by the official teams) during the study period. In 149 (4-7% of all fatal accidents) cases the driver was judged to have fallen asleep at the wheel. In 99 cases (3 1% of all fatal accidents) the drivers' sudden collapse caused the accident. Of the 99 collapses, the cause of the collapse could not be classified in 31 cases, and was judged as excessive use of alcohol in 17 cases, and as drowsiness in three cases. Sudden illness was the cause in 48 accidents (0019% of all accidents reported to the police, and 1-5% of all fatal accidents investigated by official teams during the study period). Altogether, 53 persons died, and 46 of them were drivers. Thus, 3-9% of all drivers' deaths were classified as due to sudden illness-caused incapacity. During the study years, al-cohol was observed in the blood of the driver in 11% of all fatal accidents, and in 37% of single vehicle drivers' deaths.
The causes of death in 44 drivers investigated are shown in Table 1. Probable cardiac arrest was the most common cause, and resulted in 25 deaths (57% of the group), and possible cardiac arrest caused five (11%) of 44 drivers' deaths, due to sudden illness which resulted in unconsciousness at the wheel. Five of the 25 drivers with probable cardiac arrest had no prior history of coronary heart disease, and 19 had a history of angina pectoris, myocardial infarction, or both. A 22-year-old man died suddenly at the wheel, and was found to have a congenital aortic stenosis and patent coronary arteries
Cause of accident
All accidents investigated by police No of fatalities in all traffic deaths Deaths in vehicles
Automobile drivers' deaths
All deaths due to unconsciousness caused by sudden illness
Automobile drivers' deaths due to uncon sciousness caused by sudden illness All deaths caused by probable cardiac
arrest
All deaths caused by professional driver's probable cardiac arrest
Deaths of professional drivers due to probable cardiac arrest
Deaths due to possible cardiac arrest when driving
Deaths due to epileptic fit when driving Deaths due to fatal intracerebral
haemor-rhage when driving
Deaths due to possible suicide of driver Deaths due to unknown causes
Total no of events 253,356 3,662 265 1,181 53 44 25 4 2 5 4 4 3 3 Finland Events per year 42,226 610 44 197 8-8 7-3 4-2 0-67 0-33 0-83 0-67 0-67 0-5 0-5 1984-1989 Annually per million people 8.445 (8,364-8,525) 125 (115-135) 8-8 (6-2-11) 40 (34-46) 1-8 (0-6-2-94) 1-5 (0-4-0-5) 0-83 (003-1 6) 0-13 (0-0-45) 0067 (0-0-29) 0-17 (0-0-53) 013 (0-0-45) 013 (0-0-45) 0 1 (0-0-38) 0 1 (0-0-38) Annually per million vehicles 21,993 (21,786-22,200) 326 (301-352) 870 (610-1,130) 105 (90-120) 4 7 (1-6-7-8) 3-9 (1-1-6-7) 2-2 (009-4-4) 0-36 (0-1-2) 0-18 (0-0-79) 0-44 (0-1-4) 0-36 (0-1-2) 0-36 (0-1-2) 0-27 (0-10) 0-27 (0-1-0) Total no of events 35.931 466 114 170 16 15 8 — — 4 — 3 not included not included Canton Events per year 8,983 117 29 43 4 3-8 2 — — 1 — 0-75 Vaud, Switzerland, 1986-1989 Annually per million of
the population 16,332 (15.997-16.667) 212 (174-259) 53 (34-72) 78 (55-101) 7-3 (0-14-14) 6-8 (0-14) 3-6 (0-8-7) 1-8 (0-5-39) — 1-4 (0-4 4) Annually per million vehicles 32.537 (31.874-33.200) 423 (346-500) 1.530 (964-2,096) 167 (117-217) 16 (0-85-30) 15 (0-33-29) 7-3 (0-17) 3-9 (0-11-3) -2-9 (0-9-3)
Road accidents and sudden death 891
< 20 21-40 41-60 61-80 81-100 101-120 Speed of vehicle (km.h l)
Figure 1 Speed of the vehicle at the moment of accident in 44
fatalities due to drivers' sudden incapacity caused by illness. The speed was estimated by the accident investigation teams which consisted of a police officer, car and traffic engineers and a forensic officer. Finnish data from years 1984-89.
but an old and a recent myocardial scar. One year before the accident he had run a marathon. One driver had had a coronary artery bypass operation just 4 weeks before the accident.
Three-vessel disease was found in 19 and fewer lesions in four of the other 25 drivers with probable cardiac arrest. A new myocardial scar was found in 15 drivers and an old scar in 14 out of the 25 with probable cardiac arrest. The coronary vessels were patent and no myocar-dial scar was observed in drivers with possible cardiac arrest. In the accidents classified as due to non-cardiac cause, all the drivers had patent coronary arteries except for one whose death was possibly suicide.
No pathology of the heart was found in the four epileptic fit cases (034% of all drivers' deaths), in the four fatal intracerebral haemorrhage cases (0-34%), in the three possible suicides (025%), and in the three due to unknown cause (025%).
Illness caused only two accidents amongst the profes-sional drivers during the 6 years under investigation. One woman was driving a taxi when she suddenly lost consciousness and drove off a motorway. She and two passengers died. The driver had had a myocardial in-farction 6 years before the accident; she also had heart failure. The other professional was a van driver who drove off a road at 40 km.h"1. He had a history of hypertension. His coronary arteries were patent and there was nothing to suggest an old or recent myocardial infarction at autopsy.
Speed of vehicles at the moment of accident is shown in Fig. 1. Data were missing for one case and in only two of the 44 investigated cases was a clear slowing of speed indicated by signs of braking on the road surface. Altogether eight passengers died in the analysed acci-dents. Four of the passenger deaths were caused by probable cardiac arrest of the driver, and two by pos-sible cardiac arrest. One of the other party involved in the collision died and 11 were injured. In six of the 15 collisions, the other vehicle was a truck.
The mean age of all drivers with a fatal outcome was 54-3 years (16-9 SD). The mean age of those with
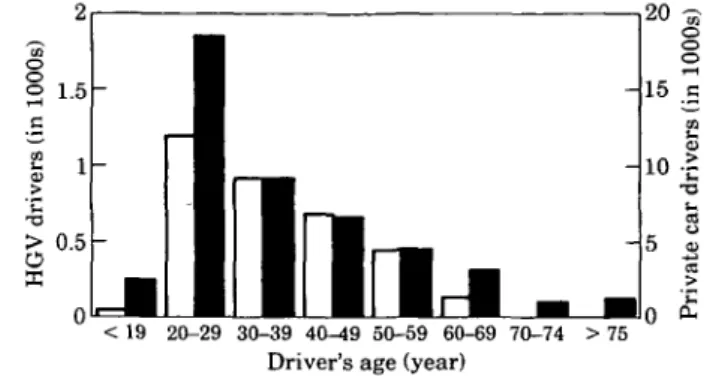
< 19 20-29 30-39 40-49 50-59 60-69 70-74 > 75 Driver's age (year)
Figure 2 Age distribution of private car and heavy goods vehicle
(HGV) drivers responsible for road accidents in Switzerland in 1989. Open bars give figures of HGV drivers and closed bars of private car drivers.
probable or possible cardiac arrest was 59-8 years (SD 14-4). Eleven of them were older than 65 years, and the oldest was 78 years old. The ages of the drivers responsible for all fatal accidents in Finland were avail-able for 142 professional and 1529 non-professional drivers. Only two (1-41%) of the professional drivers were older than 60 years but 465 (304%) of the non-professional drivers were older than 60 years (/><0-000 01; odds ratio 30-6, 95% confidence limits 7-44_76-9).
Data on kilometres driven during the last 12 months before the accident were available for 1821 drivers. Ten (7-6%) out of 132 professional drivers drove less than 20 000 km annually. Of non-professional drivers, 670 (55-7%) out of 1202 drove less than 20 000 km annually (/><0000 01; odds ratio 15-36, 95% confidence limits 7-74-31-4).
SWITZERLAND
In Switzerland about 75 000 accidents are investigated every year; the number of accidents is about 9300 per million people and per year. In 1989, 13% of all acci-dents were due to the driver's condition. Sudden in-capacity due to excessive fatigue of the driver caused 2-5% of all accidents. An unclassified fit or sudden uncon-sciousness (malaise in French) was the cause of 0-4% of all accidents and was responsible for 1 -4% of all fatalities. No fatal accidents due to sudden driver incapacity in-volving a heavy goods vehicle occurred during that year. With regard to the age of the responsible driver, a large number of young people was recorded (Fig. 2). After the age of 75 years, the risk again increased.
In the Vaud area, about 9000 accidents are registered every year (Table 1). That is 16 332 per million people and per annum. This is much more than the mean Swiss number of 9300. It is due, at least partly, to the high density of the traffic in the area. More detailed analysis of accident by cause relates to 35 931 accidents. This covers all accidents during 1986-1989. The total number of investigated deaths was 466.
Altogether, an unclassified fit or sudden unconscious-ness caused 157 accidents (0-437% of all accidents
Table 2 Mortality rates for cars and heavy goods vehicles per 100 million kilometres in Great Britain in 198919' and in Finland in years 1984-89'""
Vehicle
Cars HGVs All automobiles
Total annual mortality
million km Great Britain 1-3 3-3 1-52 per 100 Finland 11 0-75 0-96
Driver mortality per 100 million km Great Britain Finland
0 5 0 39 0 2 018 0-43 0-33
reported to the police), and 16 deaths (3-4% of all traffic deaths; Table 1). In 15 of the latter cases, it was the driver who died in the accident. Probable cardiac arrest caused eight (53%) and possible cardiac arrest four (26%) of these 15 accidents (Table 1). Four of the 15 drivers had a prior history of coronary heart disease, eight had not. In three cases a fatal intracerebral haem-orrhage was responsible for the accident. The mean age of these 15 fatal cases was 68 years for 12 men, and 62 years for three women; 67 years for the whole group. None of the drivers in the fatal accidents was driving professionally.
In general, according to the official statistics in canton de Vaud, 10% of all accidents and about 30% of all road fatalities were in some way related to excessive alcohol intake.
Discussion
RELIABILITY OF THE DATA
To test the reliability of the analysed statistics, we compared accident rates per automobile kilometres in the United Kingdom and in Finland (Table 2)[8'9]. The only difference seems to be the small number of deaths in Finish heavy good traffic compared to the U.K. statis-tics. The difference derives from passenger deaths, as driver death rates are similar. The data is thus consid-ered reliable. The population of canton de Vaud is small. Therefore the number of accidents is correspondingly scanty and the 95% confidence limits wide (Table 1).
ANNUAL RATES OF ALL CAUSE TRAFFIC ACCIDENTS AND DEATHS
The annual rates of all-cause traffic deaths per million people and million vehicles were 125 and 326 in Finland and 212 and 423 in Vaud, respectively (Table 1). The corresponding rates were 1-7 and 1-3-fold, respectively, in Vaud as compared to Finland. The 95% confidence limits of the accident rates indicate significant difference in all accidents investigated by the police and in all fatal accidents per population but not per vehicle (Table 1). The density of vehicles per square kilometre of country area is 14-4-fold higher in Vaud compared to Finland. A general 80 km.h ~ ' speed limit was ordered in Finland more than 20 years ago. Heavy punishments for not obeying the traffic rules may also partly explain the
smaller rate of accidents in Finland than in canton de Vaud. In Vaud, the heavy traffic in the small area causes an increased probability of collision.
ANNUAL RATES OF TRAFFIC ACCIDENTS AND DEATHS CAUSED BY SUDDEN INCAPACITY OF THE DRIVER
Sudden incapacity of the driver has been reported to cause between O-^/o'10'"1 and 0-25%m of traffic acci-dents. The present study shows figures equal to the earlier data when all accidents due to all-cause sudden incapacity are counted. In Finland, 0098% of accidents reported to the police occurred due to sudden incapacity of the driver; the figure was 0-4% of accidents in Vaud. The corresponding rates for fatal accidents only are considerably higher. Accident rates due to unconscious-ness caused by sudden illunconscious-ness were 1-5% of fatalities in Finland and 3-4% in Switzerland (Table 1). The differ-ence in the annual rates per population and per vehicle was not significant between the two countries, as judged from the overlapping confidence limits (Table 1).
Fatality rates due to illness caused by sudden driver incapacity were 1-8 per million inhabitants and 7-3 per million vehicles in Finland and 7-3 and 16 in Vaud, respectively. The corresponding rates in Vaud were 3-3 and 4-6 fold higher than in Finland. However, the confidence limits are wide and overlap. The most com-mon cause of the accidents investigated was coronary heart disease. Despite the greater incidence of coronary heart disease in Finland'121, the occurrence of cardiac arrests at the wheel was greater in Switzerland. The epidemiological mortality data are justified by age which, as such, is significantly associated with the risk of cardiac death. The prevalence of natural death in road traffic was reported to be 27, 56,182, and 260 per million inhabitants in age classes of 30-39, 40-49, 50-59, and 60-69, respectively'131. More of the Swiss probably con-tinue driving in advanced age, as the Swiss drivers with fatal outcome were older than the corresponding Finnish drivers. Furthermore, only half of the Swiss victims had undergone an autopsy. Thus, heavy traffic demanding much from the driver and increasing the risk of collision, aged drivers with increased risk of death and uncertainty of the data explain the observed differ-ence. The elderly and drivers with less than 20 000 annual kilometres seem to be particularly vulnerable to cause traffic accidents.
Road accidents and sudden death 893
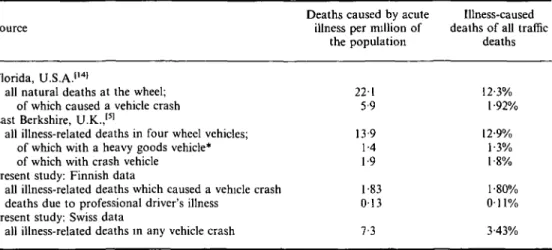
Table 3 Comparison of death rales caused by acute illness of the driver in Florida, U.S.A./'41 East Berkshire,
U K /SJ, Finland and canton de Vaud, Switzerland
Source
Deaths caused by acute illness per million of
the population
Illness-caused deaths of all traffic
deaths Florida, U.S.A.'141
all natural deaths at the wheel; of which caused a vehicle crash East Berkshire, U.K.,151
all illness-related deaths in four wheel vehicles; of which with a heavy goods vehicle* of which with crash vehicle
Present study: Finnish data
all illness-related deaths which caused a vehicle crash deaths due to professional driver's illness
Present study: Swiss data
all illness-related deaths in any vehicle crash
221 5-9 13-9 1-4 1-9 1 83 013 12-3% l-92°/( 12-9% 1-3% 1-8% 1-800/ O i l0/ 7-3 3-43%
*no information on possible crash.
Illness-caused deaths in Florida and in the present study appear in Table 3[14]. The rate of fatal accidents is almost 10 times greater than in Finland and 3-6 times higher than in Switzerland in the present study. How-ever, the car crashed in only 27% of cases. The rate of fatalities with car crash corresponds with our data, and it is between the Swiss and the Finnish figures.
Table 3 also gives accidents in relation to natural deaths on the roads of East Berkshire, U.K.[51. The rate of traffic deaths caused by illness is comparable to the rate observed in the present study. Most (88%) of the deaths were a result of cardiovascular disease. Coronary occlusion was found in 67% and in 11% of patients ruptured aortic aneurysm was the cause of death.
PRODROMAL SYMPTOMS
Earlier reports have indicated that drivers have had prodromal symptoms just before death at the wheel'15'16'. They may thus have had time to slow down before loss of consciousness, and to decrease the risk of damage. However, we found no indication of slowing of speed, as shown in Fig. 1. Instant loss of driving control was also indicated by absent signs of braking on the road surface, and damage and trauma to other traffic party. The number of trauma victims and deaths would have been much greater had the collision party not been a heavy goods vehicle in 40% of collisions.
GENERAL SUGGESTIONS FOR REVOKING OF DRIVING LICENSE
As accidents due to cardiac illnesses are rare, there is no reason to withdraw driving licences from all patients with heart disease. Therefore, we suggest individual risk stratification. Liberal recommendations are justified for asymptomatic drivers with heart disease who have normal exercise capacity. However, older people with known heart disease should limit their driving. Profes-sional drivers with anginal symptoms should have an
exercise test. After an acute myocardial infarction or coronary event, and after coronary revascularization, professional driving should be stopped for 3 months. Before beginning professional driving after these events, professional drivers should have an exercise test in-dependent of symptoms. The test should be repeated thereafter annually. Those with ischaemia at low rate x pressure product and/or abnormally low exercise capacity should not drive before further evaluation, including coronary arteriography.
The authors thank the chief Lasse Hantula and the personnel of the Finnish Traffic Safety Committee and Insurance Companies. Essential for the study was the support of the Finnish Cardiac Society as well as the collaboration of Philippe Vautier of the 'Service des automobiles' of canton de Vaud, Switzerland.
References
[1] Baker SP, Spitz WU. An evaluation of the hazard created by natural death at the wheel. N Engl J Med 1970; 283: 405-9. [2] Peterson BJ, Petty CS. Sudden natural death amongst
auto-mobile drivers. J Forensic Sci 1962; 7: 274-85.
[3] Hossack DW. Medical catastrophe at the wheel. Med J Aust 1980; 1: 327-8.
[4] Ostrom M, Eriksson A. Natural Death at the wheel. J Forensic Sciences (JFSCA) 1987; 32: 988-98.
[5] Christian MS. Incidence and implications of natural deaths of road users. B Med J 1988; 297: 1021-4.
[6] Oliver MF Somerville W. Cardiac conditions. In: Raffle A, ed. Medical aspects of fitness to drive, 4th edn. London: Medical Commission on Accident Prevention, 1985: 9-15.
[7] Hantula L. Development of a case study method of road accidents in Finland. J Traffic Med 1992; 20: 27-35. [8] Government statistical service: Road accidents Great Britain
1989. The casualty report.
[9] Finnish Roads Administration Statistics, Vehicle kilometres in 1960-1990, and Central Statistical Office of Finland, Road Accidents in Finland 1984-9.
[10] Herner B, Smedley B, Ysander L. Sudden illness as a cause of motor vehicle accidents. Br J Industr Med 1966; 23: 37-41. [11] Grattan E, Jeffcoate G.O. Medical factors in road traffic
accidents. Br Med J 1968; i: 75-9.
[12] Uemura K, Pisa Z. Trends in cardiovascular disease mortality in industrialized countries since 1950. Wld Hlth Statist Quart 1988; 41: 155-78.
[13] Penttila A, Karhunen PJ and Pikkarainen J. Unexpected [15] Kerwin AJ, Sudden death while driving. Can Med Assoc J natural death in road traffic (Der unerwartete natiirlich Tod 1094; 131' 312^4.
lm Strassenverkehr) Beitr Genchtl Med 1989, 47: 579-87. [16] Robinson K, Mulcahy R. Return to employment of profes-[14] Copeland AR. Sudden death 'at the wheel'—revisited. Med sional drivers following myocardial infarction. Irish Med J