REPORTS
Detecting Activation of
Ribosomal Protein S6 Kinase
by Complementary DNA and
Tissue Microarray Analysis
Maarit Ba¨rlund, Farahnaz Forozan,
Juha Kononen, Lukas Bubendorf,
Yidong Chen, Michael L. Bittner,
Joachim Torhorst, Philippe Haas,
Christoph Bucher, Guido Sauter,
Olli-P. Kallioniemi, Anne
Kallioniemi
Background: Studies by comparative
genomic hybridization (CGH) have
shown that chromosomal region 17q23
is amplified in up to 20% of primary
breast cancers. We used microarray
analyses to measure the expression
lev-els of genes in this region and to explore
their prognostic importance. Methods:
A microarray that contained 4209
complementary DNA (cDNA) clones
was used to identify genes that are
overexpressed in the MCF-7 breast
cancer cell line as compared with
nor-mal mammary tissue. Fluorescence in
situ hybridization was used to analyze
the copy number of one overexpressed
gene, ribosomal protein S6 kinase
(S6K), and to localize it to the 17q23
region. Northern and western blot
analyses were used to measure S6K
gene and protein expression, and an
en-zymatic assay was used to measure S6K
activity. Tumor tissue microarray
analysis was used to study
amplifica-tion of S6K and the HER-2 oncogene,
another 17q-linked gene, and the
rela-tionship between amplification and
prognosis was analyzed. The Kaplan–
Meier method was used for data
analy-sis, and the log-rank test was used for
statistical analysis. All P values are
two-sided. Results: S6K was amplified
and highly overexpressed in MCF-7
cells relative to normal mammary
epi-thelium, and protein expression and
en-zyme activity were increased. S6K was
amplified in 59 (8.8%) of 668 primary
breast tumors, and a statistically
sig-nificant association between
amplifica-tion and poor prognosis (P = .0021) was
observed. Amplification of both S6K
and HER-2 implied particularly poor
survival (P = .0001). Conclusions: The
combination of CGH information with
cDNA and tissue microarray analyses
can be used to identify amplified and
overexpressed genes and to evaluate
the clinical implications of such genes
and genomic rearrangements. S6K is
likely to be one of the genes at 17q23
that is amplified during oncogenesis
and may adversely affect the prognosis
of patients with this amplification.
[J Natl Cancer Inst 2000;92:1252–9]
Large-scale gene expression surveys,
such as complementary DNA (cDNA)
microarrays (1), serial analysis of gene
expression (2), or high-throughput cDNA
sequencing, have made it possible to
screen for the expression levels of
thou-sands of genes in a tumor. In a typical
cDNA microarray experiment, up to
10 000 genes are simultaneously analyzed
in a parallel fashion, revealing hundreds
of genes that are differentially expressed
relative to those of a control tissue.
Ana-lyzing and interpreting this genomic-scale
information to pinpoint alterations in
spe-cific genes that could be utilized for
de-veloping clinical applications, such as
finding targets with potential diagnostic,
prognostic, or therapeutic applications,
have become increasingly important
chal-lenges. To rank the large number of
tar-gets for further study, it is important to
separate primary genetic alterations from
secondary, downstream changes in gene
expression.
Gene amplification is an important
mechanism for increasing expression of
critical genes involved in the initiation
and progression of cancer. Indeed, in
breast cancer, a number of important
on-cogenes have already been found to be
activated by DNA amplification. These
oncogenes include HER-2 (at
chromo-some 17q12), C-MYC (at 8q24), PRAD1/
CYCLIN D (at 11q13), FGFR-1 (at
8p12), and FGFR-2 (at 10q24) (3).
Fur-thermore, studies by comparative
geno-mic hybridization (CGH) (4–7) and
chro-mosome microdissection (8) have
revealed that numerous other
chromo-somal regions frequently undergo
ampli-fication in breast cancer. Focused studies
of the amplification region at 20q12–
20q13 have implicated a number of
over-expressed genes with putative oncogenic
potential, such as AIB1, BTAK, CAS-1,
and ZNF217 (9–12), indicating that
mul-tiple genes may be induced in a given
amplification region.
Our laboratory is using cDNA
micro-array analyses of breast cancer cell lines
that harbor high-level DNA
amplifica-tions to explore the consequences of these
multiple genomic DNA amplifications on
the pattern of gene expression. This
strat-egy could highlight genes that are targets
for the clonal selection process that leads
to DNA amplification. Of particular
inter-est are the consequences of genomic
re-arrangements at 17q23, a locus that has
been shown by CGH to be amplified in up
to 20% of primary breast cancers (4–7).
We showed that at least two separate
re-gions at 17q23 undergo high-level
ampli-fication in breast cancer (13).
Here we report the results of a cDNA
microarray analysis of expression levels
of 4209 clones in the MCF-7 breast
can-cer cell line. Tissue microarray (14)
analysis of 668 primary breast cancers
was used to determine the in vivo
impor-tance of the amplified and overexpressed
genes that we discovered in the cell line
and to explore the relationship between
gene amplification and patient survival.
M
ETHODSCell Lines
Breast cancer cell lines BT-474, HBL-100, MCF-7, MDA-436, and ZR-75-1wt were obtained from the American Type Culture Collection (Manassas, VA), KPL-1 from the German Collection of Micro-organisms and Cell Cultures (Braunschweig, Ger-many), and Sum-52 from S. P. Ethier (University of Michigan, Ann Arbor).
Affiliations of authors: M. Ba¨rlund, Cancer
Ge-netics Branch, National Human Genome Research Institute, National Institutes of Health, Bethesda, MD, and Laboratory of Cancer Genetics, Institute of Medical Technology, University of Tampere and Tampere University Hospital, Finland; F. Forozan, J. Kononen, L. Bubendorf, Y. Chen, M. L. Bittner, O.-P. Kallioniemi, A. Kallioniemi, Cancer Genetics Branch, National Human Genome Research Insti-tute, National Institutes of Health; J. Torhorst, P. Haas, C. Bucher, G. Sauter, Institute of Pathology, University of Basel, Switzerland.
Correspondence to: Anne Kallioniemi, M.D.,
Na-tional Institutes of Health, 49 Convent Dr., Rm. 4B24, Bethesda, MD 20892-4470 (e-mail: akallion@ nhgri.nih.gov).
See “Notes” following “References.”
Construction of Primary Breast
Tumor Microarrays
Two groups of primary breast cancer tissue speci-mens were obtained from the Institute of Pathology, University of Basel, Switzerland, for the construc-tion of tissue microarrays. The first group consisted of 372 ethanol-fixed primary breast cancer speci-mens [described in (14)]. The second group con-sisted of 612 formalin-fixed, paraffin-embedded pri-mary breast cancer specimens from the years 1985– 1995 obtained from patients with clinicopathologic information that included an average of 5.4 years of follow-up. All specimens were anonymous, archival tissue specimens. The use of these specimens for retrospective analyses was approved by the Ethics Committee of the University of Basel, and their use for tissue microarray analysis was approved by the National Institutes of Health Institutional Review Board.
The tumor samples were reviewed by one pa-thologist (J. Torhorst) and included 73.3% ductal, 13.6% lobular, 3.0% medullary, 2.6% mucinous, 1.5% cribriform, 1.4% tubular, and 1.1% papillary carcinomas; 1.9% ductal carcinoma in situ; and 1.7% of other rare histologic subtypes. The grade distribution (15) was 24% grade 1, 40% grade 2, and 36% grade 3. The postoperative tumor–node– metastasis (pT) stage (16) was 32% pT1, 51% pT2, 7% pT3, and 10% pT4. The average age of the pa-tients was 60 years (range⳱ 26–97 years); 50% of these patients had lymph node-negative disease and 50% had lymph node-positive disease.
The tissue microarrays were constructed as de-scribed previously (14). Briefly, a representative tu-mor area was selected from hematoxylin–eosin-stained sections of each tumor. The individual donor tissue blocks and the corresponding histologic slides were overlaid for tissue microarray sampling. A tis-sue microarray instrument (Beecher Instruments, Silver Spring, MD) was used to create holes in a recipient paraffin block, to obtain cylindrical core tissue biopsy samples with a diameter of 0.6 mm from the donor paraffin blocks, and to transfer these biopsy samples to the recipient block at defined ar-ray positions. Multiple 5-m sections were cut from the tissue microarray block by use of a microtome with an adhesive-coated-tape sectioning system (In-strumedics, Inc., Hackensack, NJ).
CGH Analysis of MCF-7
CGH was done as described previously (17). Briefly, 400 ng of MCF-7 genomic DNA was fluo-rescently labeled with SpectrumGreen–deoxyuridine triphosphate (dUTP) (Vysis, Inc., Downers Grove, IL) by the use of nick translation. Normal placental DNA was fluorescently labeled in the same manner with SpectrumOrange–dUTP (Vysis, Inc.). The la-beled DNAs were hybridized to normal metaphase chromosomes, and the chromosomes were counter-stained with 4⬘,6-diamidino-2-phenylindole (DAPI) (Boehringer Mannheim Biochemicals, Indianapolis, IN). The hybridizations were evaluated by use of a Zeiss microscope (Carl Zeiss, Inc., Thornwood, NY) and the Quips XL program (Vysis, Inc.). The fluo-rescence intensities of MCF-7 DNA and placental DNA were measured along chromosome 17, and their ratios (DNA sequence copy number in MCF-7 cells/copy number in normal tissue) were computed. The average copy number ratio from 10
chromo-somes and the 95% confidence interval were calcu-lated.
Construction of cDNA Microarray
A total of 4209 cDNA clones from the set of 15 289 IMAGE (i.e., Integrated Molecular Analysis of Genomes and Their Expression) consortium cDNA clones described earlier (18–20) were printed onto glass slides as described previously (1). Radia-tion hybrid-mapping informaRadia-tion was available for about 50% of them (21). The set included 88 house-keeping genes that were used as controls in the nor-malization of the data and 135 clones from chromo-some 17, including eight clones from 17q23. Based on the information in the radiation hybrid map (21), this represents approximately 10% of all cDNAs from this region.
Fluorescent cDNA Microarray
Analysis of MCF-7 Cells
Total RNA was extracted from MCF-7 cells by use of the RNeasy kit (Qiagen, Inc., Valencia, CA). The labeling and hybridization were done as de-scribed previously (18,22). Briefly, 100–200g of total MCF-7 RNA was used as template to prepare cDNA probes labeled with dUTP coupled to Cya-nine5 (Cy5) fluorescent dye (Amersham Pharmacia Biotech, Inc., Piscataway, NJ) by use of oligo(dT)-primed polymerization by SuperScript II reverse transcriptase (Life Technologies, Inc. [GIBCO BRL], Gaithersburg, MD). Probes complementary to normal mammary gland RNA (Clontech Labora-tories, Inc., Palo Alto, CA) were prepared in the same manner, except that the dUTP was coupled to Cyanine3 (Cy3) fluorescent dye (Amersham Phar-macia Biotech, Inc.). The labeled cDNAs were com-bined with 8g of polydeoxyadenylic acid (Amer-sham Pharmacia Biotech, Inc.), 4g of Escherichia
coli transfer RNA (Sigma Chemical Co., St. Louis,
MO), and 10 g Cot-1 DNA (Life Technologies, Inc.) in 0.15% sodium dodecyl sulfate (SDS) and 3× standard saline citrate (SSC) (i.e., 450 mM NaCl and 45 mM sodium citrate). The probe mixture was in-cubated at 98 °C for 2 minutes and at 4 °C for 10 seconds and was applied onto the microarray slide. Hybridization was carried out at 65 °C for 16 hours. The slides were washed in 0.5× SSC (i.e., 75 mM NaCl and 7.5 mM sodium citrate) and 0.01% SDS at 55 °C for 2 minutes each.
Analysis of cDNA Microarray Data
Fluorescence intensities at the targets were mea-sured by use of a custom-designed laser confocal microscope equipped with a scanning stage, appro-priate excitation and emission filters, and a photo-multiplier tube detector (18). Intensity data were in-tegrated over 225-m2 pixels and recorded at 16
bits. The fluorescent images from the MCF-7 hy-bridization and from the hyhy-bridization with normal mammary tissue were scanned separately. The MCF-7 image was assigned a red color and the ref-erence image was assigned a green color to form a pseudo-color image. In this image, spots that appear in red correspond to genes overexpressed in MCF-7 cells, and those that are green correspond to genes whose expression is lower in MCF-7 than in the control sample (normal mammary tissue).
The results of the cDNA microarray experiments were analyzed by use of the ArraySuite program
(developed at the National Human Genome Re-search Institute, Bethesda, MD, by Y. Chen) based on the IPLab Spectrum platform (23). The program identified and segmented spots in the images corre-sponding to the MCF-7 (red) and normal mammary (green) cDNA hybridizations. After background subtraction, average intensities at each spot in the MCF-7 hybridization were divided by the average intensity of the same spot in the normal mammary hybridization. The ratios were normalized on the basis of the distribution of ratios for the 88 house-keeping genes (22). This ensured that the ratios ob-tained were not affected by differential labeling or hybridization efficiency of the two cDNAs, by the quantity of the labeled cDNA in the hybridization reaction, or by the photomultiplier voltage settings during scanning. The ArraySuite program also al-lows visualization of the image for each spot. For this study, the spot images were displayed at the chromosomal locations of the relevant clones to pro-vide a visual comparison of DNA amplification sites with chromosomal locations of overexpressed genes. The chromosomal locations of the clones came from radiation hybrid-mapping data available in the human gene map (21). Radiation hybrid map-ping is a method of physical mapmap-ping that uses the frequencies of x-ray-induced DNA breakage to de-duce distances between markers, which are ex-pressed in centiRays (cR), the genetic map distance that corresponds to an interval in the radiation hy-brid map in which there is a 1% probability of x-ray-induced DNA breakage.
Mapping and Copy Number Analysis
of Ribosomal Protein S6 Kinase by
Fluorescence In Situ Hybridization
A P1 artificial chromosome probe (clone 186o9) specific for ribosomal protein S6 kinase (S6K) was obtained by screening of a commercially available library (Genome Systems, Inc., St. Louis, MO) by the use of the polymerase chain reaction. The S6K probe was fluorescently labeled with SpectrumOr-ange–dUTP by use of random priming and was hy-bridized to normal metaphase chromosomes to map the S6K gene as described previously (13). The SpectrumOrange-labeled S6K probe was also used together with a SpectrumGreen fluorescently labeled probe for the centromere of chromosome 17 for copy number analysis by interphase fluorescence in
situ hybridization (FISH) as described previously (13). The hybridizations were evaluated by use of a
Zeiss fluorescence microscope. Approximately 20 nonoverlapping nuclei with intact morphology (evaluated by use of the DAPI counterstain) were scored to determine the mean number of hybridiza-tion signals for each probe. Amplificahybridiza-tion was mea-sured by a comparison of the number of signals pro-duced by use of the probe for S6K with the number produced by use of the probe for the chromosome 17 centromere.
Tissue Microarray Analysis by FISH
For the tissue microarrays, the FISH protocol was changed according to the type of tissue fixation used. The ethanol-fixed tissue microarray was depa-raffinized, denatured at 73 °C for 5 minutes in 2× SSC (i.e., 300 mM NaCl and 30 mM sodium citrate) containing 70% formamide, and dehydrated in an ethanol series (70% , 80%, and 100%). The
forma-lin-fixed tissue microarray was deparaffinized, im-mersed in 0.2 N HCl, incubated in 1 M sodium thio-cyanate solution at 80 °C for 30 minutes, and immersed in a protease solution (0.5 mg/mL in 0.9% NaCl; Vysis, Inc.) for 10 minutes at 37 °C. These slides were then postfixed in 10% buffered formalin (Sigma Chemical Co.), air-dried, denatured at 73 °C for 5 minutes in 2× SSC containing 70% formamide, dehydrated in an ethanol series, incubated in 4g/ mL proteinase K (Boehringer Mannheim Biochemi-cals) at 37 °C for 7 minutes, and dehydrated again as above. Both ethanol-fixed and formalin-fixed slides were hybridized with the SpectrumOrange-labeled S6K-specific probe and the SpectrumGreen-labeled chromosome 17 centromere probe overnight at 37 °C. An adjacent section from the tissue microar-ray was hybridized with a SpectrumOrange-labeled HER-2 probe (Vysis, Inc.). Specimens containing tight clusters of signals or more than a threefold increase in the number of S6K signals, as compared with chromosome 17 centromere signals, in at least 10% of the tumor cells were considered to be am-plified.
Our tissue microarrays comprised 984 tumor samples. Analysis of S6K and HER-2 copy numbers was uninformative in 316 and 374 cases, respec-tively, because of missing or unrepresentative tumor samples in the array section or failure of the analysis.
Northern Blot Analysis
Total RNA was extracted from breast cancer cell lines by use of the RNeasy kit. RNA (10g) was subjected to electrophoresis through a 1 M formal-dehyde–1% agarose gel and transferred onto a Nytran membrane (Schleicher & Schuell, Inc., Keene, NH) by standard methods (24). The insert from a sequence-verified cDNA clone (GenBank ac-cession number H04661) representing the 3⬘-end of the S6K gene was32P-labeled by random priming
(Prime-It; Stratagene Cloning Systems, La Jolla, CA). The blot was prehybridized with 10g/mL boiled, sheared DNA (Research Genetics, Hunts-ville, AL) for 1 hour at 68 °C in Express Hybridiza-tion soluHybridiza-tion (Clontech Laboratories, Inc.). Hybrid-ization was done in the prehybridHybrid-ization solution at 68 °C overnight. The blot was washed several times with 1% SDS in 2× SSC at 65 °C and then in 0.5% SDS in 0.1× SSC (i.e., 15 mM NaCl and 1.5 mM sodium citrate) at 55 °C. Hybridized probe was de-tected by autoradiography. After removal of bound S6K probe, the membrane was rehybridized with a probe for glyceraldehyde-3-phosphate dehydroge-nase messenger RNA (mRNA) to confirm equal loading among samples. The expression levels were quantitated by use of the PhosphorImager (Molecu-lar Dynamics, Sunnyvale, CA).
Western Blot Analysis
Breast cancer cell line monolayers were trypsin-ized to yield a cell suspension and centrifuged at 200g for 8 minutes at room temperature. The pre-cipitated cells were lysed in RIPA buffer (i.e., 1% phosphate-buffered saline [PBS], 1% Nonidet P-40, 0.5% sodium deoxycholate, and 0.1% SDS) by re-peated passage through a 21-gauge needle and cen-trifuged at 10 000g for 10 minutes at 4 °C. Approxi-mately 40g of total protein was boiled in loading buffer (Laemmli Sample Buffer; Bio-Rad Laborato-ries, Hercules, CA) for 5 minutes, subjected to elec-trophoresis through a 4%–12% polyacrylamide
gra-dient Tris-glycine gel (Novex, San Diego, CA), along with Full-Range Rainbow Molecular Weight Markers (Amersham Life Science, Little Chalfont, Buckinghamshire, U.K.), and electroblotted onto a nitrocellulose membrane (Novex). Detection of pro-tein was by the BM Chemiluminescence Western Blotting Kit (Mouse/Rabbit) (Boehringer Mannheim Biochemicals). Briefly, the membrane was incu-bated for 1 hour at room temperature in 1% blocking solution (Boehringer Mannheim Biochemicals) and for 1 hour at 4 °C in a solution of 4g/mL primary antibody (anti-p70S6kantibody; Santa Cruz
Biotech-nology, Inc., Santa Cruz, CA) in 0.5% blocking so-lution. The membrane was washed two times for 10 minutes each in TBS–Tween® 20 (Boehringer Mannheim Biochemicals) and then twice with 0.5% blocking solution, incubated for 30 minutes at 4 °C with peroxidase-labeled secondary antibody (mouse anti-rabbit immunoglobulin G; Boehringer Mann-heim Biochemicals), and then washed four times for 15 minutes each with large volumes of TBS– Tween® 20. Signal detection was done according to the manufacturer’s instructions. The membrane was restained with anti-tubulin antibody to confirm equal loading of samples.
Measurement of S6K Activity
Breast cancer cell line monolayers in 100-mm dishes were washed once in PBS. The cells were lysed directly on the dishes by incubation for 20 minutes in 1 mL of cold modified radioimmunopre-cipitation assay buffer (i.e., 50 mM Tris–HCl [pH.7.4], 1% Nonidet P-40, 0.25% sodium deoxy-cholate, 150 mM NaCl, 1 mM ethylene glycol-bis( -aminoethyl ether)-N,N,N⬘,N⬘-tetraacetic acid, 1 mM phenylmethylsulfonyl fluoride, 1 mM Na3VO4, and
1 mM NaF) containing a protease inhibitor cocktail (Complete Protease Inhibitor Cocktail) prepared ac-cording to the manufacturer’s instructions (Boeh-ringer Mannheim Biochemicals). The lysates were passed repeatedly through a 21-gauge needle and centrifuged at 10 000g for 10 minutes at 4 °C, and the supernatant was collected. Approximately 200 g of protein was incubated overnight at 4 °C with 1g of anti-p70S6kantibody. The immunocomplex
was absorbed to 50 L protein A–agarose (Life Technologies, Inc.) by incubation for 3 hours at 4 °C and washed four times with cold PBS. S6K enzyme activity was assayed by use of the S6 Kinase Assay Kit according to the recommendations of the manu-facturer (Upstate Biotechnology, Lake Placid, NY). Briefly, the agarose beads were suspended in 20L of assay dilution buffer, 10L of substrate peptide (500M peptide AKRRRLSSLRA), 10 L of in-hibitor mixture, and 10L of radioactive adenosine triphosphate (ATP) mixture (i.e., 75 mM MgCl2,
500M ATP, and 10 Ci of [␥-32P]ATP) and
in-cubated for 10 minutes at 30 °C. Aliquots of 25L were spotted onto P81 phosphocellulose paper squares (Upstate Biotechnology) and washed three times with 0.75% phosphoric acid and once with acetone to remove unreacted [␥-32P]ATP. The
amount of radioactive product, which remains ab-sorbed to the paper squares, was measured in an LS6500 scintillation spectrometer (Beckman Coulter, Inc., Fullerton, CA).
Growth Inhibition by Rapamycin
We plated 104 cells into each well of 96-well
microtiter plates. The next day, serial dilutions of
rapamycin (Calbiochem Corp., La Jolla, CA) were added. After incubation at 37 °C for 70 hours, the medium was replaced with fresh drug-free medium, and the cells were allowed to recover overnight. Growth inhibition was measured by use of the col-orimetric MTT (i.e., 3-[4,5-dimethylthiazol-2-yl]-2,5-diphenyl tetrasodium bromide) test (Chemicon International, Inc., Temecula, CA). All experiments were performed in triplicate, and the results were expressed as percent inhibition relative to control cultures without rapamycin.
Immunohistochemistry
The expression of S6K in primary breast tumors was analyzed by the use of immunohistochemistry to the tissue microarray that contained 612 paraffin-embedded primary breast cancer specimens. Analy-sis of 167 was uninformative because of missing or unrepresentative tumor samples in the array section or failure of the analysis. A standard indirect immu-noperoxidase protocol with 3,3⬘-diaminobenzidine as a chromogen was used for immunohistochemistry (ABC-Elite; Vector Laboratories, Inc., Burlingame, CA). Polyclonal anti-p70S6kantibody was used for
detection of S6K (1 : 5000 dilution in PBS contain-ing 1% bovine serum albumin and 0.1% Triton X-100). A high-temperature (20 minutes in a pres-sure cooker) treatment procedure with Antigen Un-masking Solution (Vector Laboratories, Inc.) was used to enhance the staining. The primary antibody was omitted for negative controls. S6K staining of cytoplasm was subjectively scored into four groups: negative (no staining), weak, moderate, or strong staining. For statistical analyses, the data were com-bined into two groups: low expression (negative or weak staining) and high expression (moderate or strong staining).
Statistical Analyses
The relationship of S6K amplification to clinico-pathologic parameters and the association between S6K amplification and S6K expression were ana-lyzed by use of Fisher’s exact test. The survival curves were estimated by Kaplan–Meier analysis. The prognostic significance of amplification of S6K and HER-2 was analyzed by use of the log-rank test. All P values are two-sided.
R
ESULTScDNA Microarray Analyses
Our search for amplified DNA
se-quences in breast cancer was based on
results from CGH, which maps amplified
DNA sequences on metaphase
chromo-somes. In CGH, fluorescently labeled test
and control DNAs are hybridized to
nor-mal metaphase chromosomes, and the
fluorescence intensities and their ratios
are quantitated.
One of the most prominent
amplifica-tion sites in the MCF-7 cells is localized
at 17q23 (Fig. 1, A and B). We used a
cDNA microarray that contained 4209
clones to evaluate expression levels in
MCF-7 cells relative to those in normal
mammary epithelial cells. To better
visu-alize the relationship between increased
copy number and increased expression
levels of genes along chromosome 17, we
displayed the data from our cDNA
micro-array analyses according to the clones’
chromosomal positions.
Fig. 1 illustrates the comparison of a
CGH copy number ratio profile for
chro-mosome 17 (panel A) with the
distribu-tion of the expression ratios for genes
along chromosome 17, arranged from
17pter to 17qter (panel D). The largest
peak in the cDNA microarray profile (Fig.
1, D) corresponds to an expressed
se-quence tag (EST) (image clone
identifica-tion No. 133432). This clone showed a
higher MCF-7-to-normal expression ratio
(8.4) than any other evaluable cDNA
clone in the cDNA microarray experiment
(Fig 1, C, and inset). This EST belongs to
a UniGene cluster Hs.124943 (25) located
at 17q23 by radiation hybrid mapping (at
369 cR) (21). Subsequent sequencing and
extension of the cDNA clones in this
Uni-Gene cluster (Forozan F, Kallioniemi
O-P: unpublished observations) indicated
that this UniGene represented the 3⬘
un-translated region of the ribosomal protein
S6K. The localization of S6K to 17q23
was confirmed by FISH to normal
meta-phase chromosomes (Fig. 1, E). Since
S6K is an important signaling molecule
involved in the transition from G
1to S
phase of the cell cycle, we explored
fur-ther the role of S6K as a possible
ampli-fication target gene.
S6K Copy Number, Expression, and
Enzymatic Activity in Breast Cancer
Cell Lines
The S6K gene copy number was
ana-lyzed in seven breast cancer cell lines by
interphase FISH. Cell line MCF-7 showed
at least a 10-fold amplification (Fig. 1, F),
as did cell lines KPL-1 and ZR-75-1wt
(data not shown). In other experiments for
which the data are not shown, cell line
Sum-52 showed a twofold amplification,
cell line BT-474 showed at least a
five-fold amplification, and cell lines
HBL-100 and MDA-436 showed no increase in
S6K copy number.
Expression of S6K mRNA and protein
was studied by northern and western blot
analyses. Northern blot analysis revealed
major transcripts with molecular sizes of
2.5 and 6.0 kilobases (Fig. 2, A),
consis-tent with the results of Reinhard et al.
(26). In the four cell lines that showed at
least a fivefold increase in S6K copy
number, expression of both of these
tran-scripts was increased eightfold to 20-fold
(relative to cell lines with no
amplifica-tion). Western blot analysis of five cell
lines revealed bands with apparent
mo-lecular masses of 70 and 85 kilodaltons,
which correspond to the two known
iso-forms of S6K protein (27). Increased
ex-pression of both isoforms was seen in
Fig. 1. Comparison of complementary DNA (cDNA) microarray data on the MCF-7 breast cancer cell line
with comparative genomic hybridization (CGH) results. Panel A: CGH copy number ratio profile for chromosome 17. Normal metaphase chromosomes were hybridized with fluorescently labeled MCF-7 DNA and normal placental DNA. The fluorescence intensities were measured along chromosome 17, and their ratios (DNA sequence copy number in MCF-7 cells/copy number in normal tissue) were calculated. The average copy number ratio from 10 chromosomes, aligned with the chromosome ideogram, is shown in blue, with 95% confidence intervals in orange. The horizontal black line represents a ratio of 1.00; green, a ratio of 1.15; and red, a ratio of 0.85. The green bar at the bottom of the figure indicates the region of chromosome 17 with increased copy number in MCF-7 cells. Panel B: A computer-generated image of chromosome 17 from a CGH experiment of MCF-7 cells, aligned with the chromosome 17 ideogram and graph in panel A. Fluorescent images corresponding to the MCF-7 DNA and placental DNA were acquired separately by the use of a Zeiss fluorescence microscope, displayed in pseudo-colors, and overlaid. The
green color indicates amplification of MCF-7 DNA at the corresponding location in the chromosome. The red color indicates hybridization from the placental DNA. Panel C: A computer-generated cDNA
micro-array image of 4209 clones. The micromicro-array was hybridized separately with Cyanine5–deoxyuridine tri-phosphate (dUTP)-labeled MCF-7 cDNA and Cyanine3–dUTP-labeled normal mammary cDNA as de-scribed in the “Methods” section. The fluorescent images from the two hybridizations were recorded separately with a confocal microscope. The MCF-7 cDNA image was assigned a red color and the normal mammary cDNA image a green color to form a pseudo-color image. Spots that appear red denote clones that were more highly expressed in MCF-7 cells than in normal breast tissue, and spots that appear green denote clones that were more highly expressed in normal breast tissue than in MCF-7 cells. Inset: an enlarged image of the spot that had the highest red-to-green ratio of all clones on the array. Panel D: Distribution of expression ratios for genes along chromosome 17. The red to green ratios for 135 genes mapping to chromosome 17 were calculated from a cDNA microarray (panel C) and are shown in alignment with the chromosome 17 ideogram from 17pter to 17qter according to their radiation hybrid map positions in centiRays (cR). The peak at 369 cR corresponds to the enlarged inset image in panel C (highest level of expression of all clones on the array). Panel E: Fluorescence in situ hybridization (FISH) of the Spectrum-Orange-labeled DNA probe for ribosomal protein S6 kinase (S6K) to normal chromosome 17. The image was produced by the use of a Zeiss fluorescence microscope equipped with a 63× objective. The red color indicates the specific hybridization signals at 17q23, and the blue color indicates the chromosomal DNA counterstain. The image is aligned with those in panels A and B. Panel F: FISH of the SpectrumOrange-labeled DNA probe for S6K to MCF-7 interphase nucleus. The image was produced as in panel E. The red
color indicates the specific hybridization signals of the S6K probe, and the blue color indicates the nuclear
three cell lines with S6K amplification
(Fig. 2, B).
The S6K protein is activated by
phos-phorylation on multiple sites (28,29). We,
therefore, studied whether the increased
expression of S6K protein would also
lead to increased enzymatic activity.
When compared with the average
enzy-matic activity in lysates of HBL-100 and
MDA-436 (cell lines with neither
ampli-fication nor overexpression), the activity
observed in lysates from four cell lines
with S6K amplification and
overexpres-sion ranged from threefold (cell line
BT-474) to 15-fold (cell line KPL-1) (Fig.
2, C).
Growth inhibition by rapamycin,
which blocks the phosphorylation of S6K
(28), was studied in six cell lines. Over
the range of rapamycin concentrations
used (0.01–100 nM), all cell lines showed
concentration-dependent growth
inhibi-tion, regardless of their amplification
sta-tus (data not shown).
S6K Amplification and Protein
Expression in Primary Breast Cancers
by Tissue Microarrays and
Clinicopathologic Associations
We applied FISH analysis on tumor
tissue microarrays to evaluate the
ampli-fication of the S6K gene in vivo in 668
informative primary breast tumors (Fig. 3,
A). Fifty-nine tumors (8.8%) showed
am-plification of S6K (Fig. 3, B). The S6K
protein expression was analyzed in a
sub-set of 445 tumors by use of
immunohis-tochemistry. Fig. 3, C and D, illustrates
tumor samples with no S6K expression or
high S6K expression, respectively.
Mod-erate or strong cytoplasmic staining was
seen in 69 primary tumors (15.6%). There
was a statistically significant association
between S6K amplification and high S6K
expression (P
⳱ .0004), with 41.2% (14/
34) of the amplified tumors exhibiting
high S6K expression.
No statistically significant association
was seen between S6K amplification and
the age of the patient, tumor size, lymph
node status, histologic grade, or the
pres-ence of estrogen or progesterone
recep-tors (data not shown). However, patients
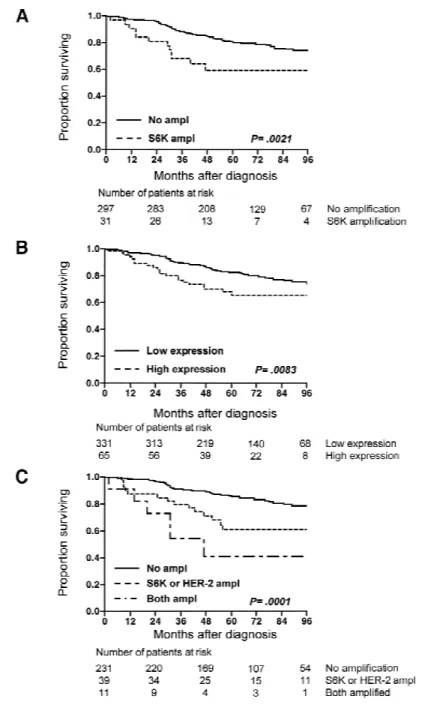
with S6K amplification had a statistically
significantly (P
⳱ .0021) worse survival
than patients without S6K amplification
(Fig. 4, A). A similar, statistically
signifi-cant (P
⳱ .0083) prognostic relationship
was also found with high S6K expression
(Fig. 4, B).
Since amplification of the HER-2
on-cogene (located on the same chromosome
at 17q12) is also associated with poor
prognosis in breast cancer (30), we
ana-lyzed whether S6K showed prognostic
significance irrespective of HER-2. An
adjacent section from the tissue
microar-ray was hybridized with a probe for
HER-2, which showed amplification in 106
(17.4%) of 610 informative cases.
Ampli-fication of both S6K and HER-2 was seen
in 27 (4.4%) of the 610 cases, whereas
S6K was amplified alone in 30 cases
(4.9%). Patients with tumors showing
both S6K and HER-2 amplifications had a
statistically significantly (P
⳱ .0001)
worse prognosis than those with no
am-plification or amam-plification of only one of
the genes (Fig. 4, C).
D
ISCUSSIONGenomic DNA amplifications are
common in breast cancer and affect a
number of distinct chromosomal sites. At
each amplification site, multiple genes
may confer a clonal growth advantage to
the cancer cells. Such genes could be
promising targets for developing
diagnos-tic, prognosdiagnos-tic, and therapeutic
ap-proaches for breast cancer. This concept
has been best demonstrated for the HER-2
gene [see (30) for a recent review], which
originally was found to be amplified in
neuroblastomas and subsequently was
shown to be associated with poor
progno-sis in breast cancer. More than 10 years
after these initial discoveries, treatment of
HER-2-positive breast cancers with the
monoclonal antibody Herceptin is now
available (30).
To rapidly identify putative target
genes for other genomic amplifications
detected in cancer by CGH, we performed
a parallel analysis of gene expression
changes by use of cDNA microarrays in
the MCF-7 breast cancer cell line and
nor-mal mammary gland tissue. The
sensitiv-ity of our cDNA microarray approach has
been described in detail previously
Fig. 2. Ribosomal protein S6 kinase (S6K) messenger
RNA (mRNA) and protein expression and kinase ac-tivity in breast cancer cell lines. Panel A: Total RNA from breast cancer cell lines HBL-100, MDA-436, Sum-52, BT-474, KPL-1, ZR-75-1wt, and MCF-7 was analyzed for expression of ribosomal protein S6K mRNA by northern blot analysis as described in the “Methods” section. The sizes (in kilobases, kb) of the major transcripts (2.5 kb and 6.0 kb) were estimated by comparison to a size standard. The membrane was re-hybridized with a probe complementary to glyceralde-hyde-3-phosphate dehydrogenase (GAPDH) mRNA as a control to confirm equal loading of RNA in all seven lanes. Panel B: Expression of S6K protein by cell lines MDA-436, HBL-100, ZR-75-1wt, KPL-1, and MCF-7 was measured by western blot analysis by use of anti-p70S6kantibody as described in the “Methods” section.
The sizes (in kilodaltons, kDa) of the major products (70 kDa and 85 kDa) were estimated by comparison to a size standard. The membrane was restained with anti-tubulin antibody as a control for equal loading of pro-tein in all five lanes. Panel C: S6K activity in breast cancer cell lines HBL-100, MDA-436, BT-474, KPL-1, ZR-75-1wt, and MCF-7. Cell lysates were incubated with anti-p70S6k antibody, and the immunocomplex
was adsorbed to protein A–agarose and assayed for phosphotransferase activity (pMol phosphate trans-ferred per minute) as described in the “Methods” sec-tion. Error bars are 95% confidence intervals.
(18,22). In earlier experiments, we were
able to detect overexpression of several
genes shown to be expressed in MCF-7,
including CDK4, CAS, MYBL, and
PCNA (Forozan F, Mahlama¨ki EH,
Monni O, Chen Y, Veldman R, Jiang Y,
et al.: unpublished data). In separate
con-trol experiments, we have also been able
to reliably detect expression of rare
tran-scripts, such as that of the estrogen
recep-tor (data not shown).
The most highly overexpressed gene in
the MCF-7 cells was an EST
correspond-ing to the ribosomal protein S6K, a gene
mapping to 17q23, a chromosomal region
that harbors the most prominent
amplifi-cation site in the MCF-7 cell line. Based
on its biologic role, S6K represents an
ideal candidate for a gene whose
activa-tion by amplificaactiva-tion could contribute to
oncogenesis. The S6K protein is rapidly
activated in response to various mitogenic
stimuli, such as growth factors (e.g.,
epi-dermal growth factor and platelet-derived
growth factor), cytokines, and oncogene
products (28,31,32). S6K regulates protein
synthesis, translation of specific mRNA
species, and progression from the G
1to
the S phase of the cell cycle (28,32,33).
We observed high-level amplification
of the S6K gene in all four of the cell lines
with 17q23 amplifications that we
exam-ined. We also observed that the levels of
mRNA and protein expression were often
higher than those anticipated from the
level of DNA amplification and that S6K
activity was increased in all cell lines that
showed S6K gene amplification. These
observations support the hypothesis that
the S6K gene is an amplification target
gene in breast cancer cell lines.
Although 17q23 amplifications are
de-tected by CGH in both breast cancer cell
lines and uncultured primary breast
tu-mors (4–7), it is important to validate any
data from cell line model systems in
clini-cal specimens. The tissue microarray
technology (14) provides an ideal method
for rapid in vivo analysis of candidate
cancer genes in a large series of patient
specimens. S6K gene amplification and
protein expression were seen in 8.8% and
15.6%, respectively, of breast cancer
specimens. Statistically significant
asso-ciations were found between gene
ampli-fication or protein expression and poor
prognosis of patients. These results
sug-gest that S6K amplification is
character-istic of aggressive breast cancers. In more
than half of the tumors, S6K was
ampli-fied irrespective of HER-2, a known
in-dicator of poor prognosis in breast cancer
(30). Co-amplification of both of these
genes implied a much worse prognosis
than did amplification of either one alone.
A recent study (34) also supports the
role of S6K as a possible target gene for
amplification of 17q23 in breast cancer.
Couch et al. (34) found amplification of
S6K in two of 14 patient specimens
evaluated. Our results, which are based on
samples from a large number of patients,
indicate that additional clinical studies are
warranted to explore the role of S6K
am-plification both as an independent
prog-nostic indicator and as a modifier of
dis-ease progression (such as response to
Herceptin therapy) in patients with
tu-mors in which HER-2 is amplified.
Inhibition of the increased S6K
activ-ity in cancer cells with 17q23
amplifica-tion could provide an attractive target for
therapeutic intervention. Our results
indi-cate that growth inhibition by rapamycin,
a known inhibitor of S6K activity, was
not appreciably different between cell
lines with increased S6K activity and
those with no S6K involvement. This
ob-servation may indicate that rapamycin is
not a sufficiently specific inhibitor, since
it also influences a wide variety of other
cellular functions such as induction of
ap-optosis and inhibition of several cyclins
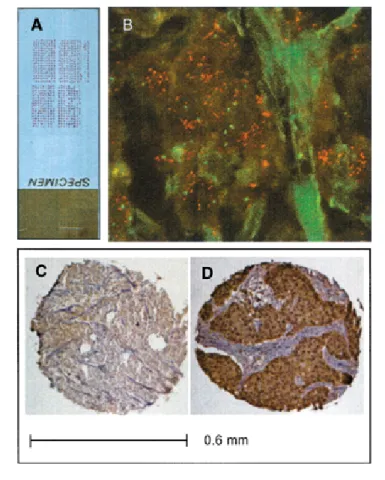
Fig. 3. Analysis of ribosomal protein S6 kinase (S6K) amplification and
ex-pression in primary breast tumors. Panel A: A hematoxylin–eosin-stained sec-tion from a tissue microarray containing 612 primary breast cancer specimens.
Panel B: Fluorescence in situ hybridization analysis. The tissue microarray was
hybridized with a SpectrumOrange-labeled ribosomal protein S6 kinase (S6K)-specific probe and a SpectrumGreen-labeled probe for the chromosome 17 centromere, as described in the “Methods” section. The image of a represen-tative tissue sample was produced by the use of a Zeiss fluorescence microscope equipped with a 63× objective. The red spots indicate the S6K-specific hy-bridization signals, and the green spots indicate the chromosome 17 centro-mere-specific hybridization signals. Panels C and D: Immunohistochemical detection of S6K protein. The tissue microarray was incubated with polyclonal anti-p70S6kantibody, as described in the “Methods” section to give a brown
precipitate that corresponds to the presence of S6K protein. Panel C: one representative tissue sample that shows no expression of S6K. Panel D: one representative tissue sample that shows high-level expression of S6K. The scale
(28,35–37). Therefore, studies with more
specific inhibitors of S6K activity are
warranted. It is also possible—and even
likely—that S6K is not the only gene
af-fected by the 17q23 amplifications and
that simultaneous activation of several
genes at 17q23 could contribute to cancer
progression. Our cDNA microarray
analysis was done on 4209 clones that did
not represent a complete set of genes from
a particular chromosomal region. The use
of focused cDNA microarrays that
in-clude more genes from the very gene-rich
17q23 region will allow a more
compre-hensive analysis of the molecular
conse-quences of the 17q23 amplifications and
perhaps highlight additional
overex-pressed genes.
Our results illustrate how the
combina-tion of CGH informacombina-tion with cDNA
and tissue microarray analyses can be
used to identify amplified and
over-expressed genes and to evaluate the
clinical implications of such genes and
genomic rearrangements. cDNA
micro-arrays are now widely used to identify
differentially expressed genes in human
cancer (38). CGH information on
geno-mic copy number provides a new
param-eter to take into account when
interpret-ing gene expression information from
thousands of cDNA clones and may
help to identify the most important
tar-gets first. Focused high-throughput
analy-sis of hundreds of clinical samples by
use of tissue microarray technology
complements these genome-screening
tools and provides information on genes
that are likely to be important for
can-cer development and progression in
pa-tients.
Our analyses imply that the S6K gene
is likely to be an important—but perhaps
not the only—target gene involved in the
17q23 amplifications in breast cancer.
S6K amplification is characteristic of
ag-gressive types of breast cancer, and
detec-tion of S6K amplificadetec-tion in conjuncdetec-tion
with HER-2 amplification may provide
more prognostic information than either
one alone. Further research is required
both on the role of S6K and on the
pos-sible presence of other overexpressed
genes in this amplicon.
Fig. 4. Kaplan–Meier analysis of breast cancer-specific survival. Panel A: Survival according to amplification (ampl) of ribosomal
protein S6 kinase (S6K). At 2 years after diagnosis, breast cancer-specific survival was 80.6% (95% confidence interval [CI]⳱ 65.4%– 95.8%) for patients with S6K amplification and 95.6% (95% CI⳱ 93.2%–98.0%) for patients without S6K amplification. At 4 years, breast cancer-specific survival was 59.2% (95% CI⳱ 32.5%–85.9%) for patients with S6K amplification and 84.6% (95% CI⳱ 79.7%– 89.5%) for patients without S6K amplification. At 6 years, breast cancer-specific survival was 59.2% (95% CI⳱ 22.8%–95.6%) for patients with S6K amplification and 78.4% (95% CI ⳱ 71.3%– 85.5%) for patients without S6K amplification. Panel B: Survival according to S6K protein expression. At 2 years after diagnosis, breast cancer-specific survival was 86.0% (95% CI⳱ 76.9%–95.1%) for patients with high S6K expression and 95.1% (95% CI⳱ 92.7%– 97.5%) for patients with low S6K expression. At 4 years, breast can-cer-specific survival was 69.9% (95% CI⳱ 55.5%–84.3%) for pa-tients with high S6K expression and 86.1% (95% CI ⳱ 81.5%– 90.7%) for patients with low S6K expression. At 6 years, breast cancer-specific survival was 65.4% (95% CI⳱ 45.5%–85.3%) for patients with high S6K expression and 79.7% (95% CI⳱ 73.0%– 86.4%) for patients with low S6K expression. Panel C: Survival according to amplification of S6K and HER-2. At 2 years after diag-nosis, breast cancer-specific survival was 72.7% (95% CI⳱ 43.6%– 100%) for patients with amplification of both S6K and HER-2, 87.2% (95% CI⳱ 76.0%–98.4%) for patients with either S6K or HER-2 amplification, and 96.5% (95% CI⳱ 94.1%–98.9%) for patients with no amplification. At 4 years, breast cancer-specific survival was 40.9% (95% CI⳱ 0%–89.1%) for patients with amplification of both S6K and HER-2, 71.2% (95% CI⳱ 53.4%–89.0%) for patients with either S6K or HER-2 amplification, and 88.7% (95% CI⳱ 83.9%– 93.5%) for patients with no amplification. At 6 years, breast cancer-specific survival was 40.9% (95% CI⳱ 0%–96.5%) for patients with amplification of both S6K and HER-2, 61.1% (95% CI⳱ 36.4%– 85.8%) for patients with either S6K or HER-2 amplification, and 83.0% (95% CI⳱ 75.9%–90.1%) for patients with no amplification.
Below each graph is the total number of patients at risk at various
R
EFERENCES(1) DeRisi J, Penland L, Brown PO, Bittner ML,
Meltzer PS, Ray M, et al. Use of a cDNA mi-croarray to analyse gene expression patterns in human cancer. Nat Genet 1996;14:457–60.
(2) Velculescu VE, Zhang L, Vogelstein B,
Kin-zler KW. Serial analysis of gene expression. Science 1995;270:484–7.
(3) Devilee P, Cornelisse CJ. Somatic genetic
changes in human breast cancer. Biochim Bio-phys Acta 1994;1198:113–30.
(4) Kallioniemi A, Kallioniemi OP, Piper J,
Tan-ner M, Stokke T, Chen L, et al. Detection and mapping of amplified DNA sequences in breast cancer by comparative genomic hybridization. Proc Natl Acad Sci U S A 1994;91:2156–60.
(5) Ried T, Just KE, Holtgreve-Grez H, du Manoir
S, Speicher MR, Schrock E, et al. Comparative genomic hybridization of formalin-fixed, par-affin-embedded breast tumors reveals different patterns of chromosomal gains and losses in fibroadenomas and diploid and aneuploid car-cinomas. Cancer Res 1995;55:5415–23.
(6) Courjal F, Theillet C. Comparative genomic
hybridization analysis of breast tumors with predetermined profiles of DNA amplification. Cancer Res 1997;57:4368–77.
(7) Tirkkonen M, Tanner M, Karhu R, Kallioniemi
A, Isola J, Kallioniemi OP. Molecular cytoge-netics of primary breast cancer by CGH. Genes Chromosomes Cancer 1998;21:177–84.
(8) Guan XY, Meltzer PS, Dalton WS, Trent JM.
Identification of cryptic sites of DNA sequence amplification in human breast cancer by chro-mosome microdissection. Nat Genet 1994;8: 155–61.
(9) Anzick SL, Kononen J, Walker RL, Azorsa
DO, Tanner MM, Guan XY, et al. AIB1, a steroid receptor coactivator amplified in breast and ovarian cancer. Science 1997;277:965–8.
(10) Sen S, Zhou H, White RA. A putative serine/
threonine kinase encoding gene BTAK on chromosome 20q13 is amplified and overex-pressed in human breast cancer cell lines. On-cogene 1997;14:2195–200.
(11) Brinkmann U, Gallo M, Polymeropoulos MH,
Pastan I. The human CAS (cellular apoptosis susceptibility) gene mapping on chromosome 20q13 is amplified in BT474 breast cancer cells and part of aberrant chromosomes in breast and colon cancer cell lines. Genome Res 1996;6:187–94.
(12) Collins C, Rommens JM, Kowbel D, Godfrey
T, Tanner M, Hwang SI, et al. Positional clon-ing of ZNF217 and NABC1: genes amplified at 20q13.2 and overexpressed in breast carci-noma. Proc Natl Acad Sci U S A 1998;95: 8703–8.
(13) Barlund M, Tirkkonen M, Forozan F, Tanner
MM, Kallioniemi O, Kallioniemi A. Increased
copy number at 17q22–q24 by CGH in breast cancer is due to high-level amplification of two separate regions. Genes Chromosomes Cancer 1997;20:372–6.
(14) Kononen J, Bubendorf L, Kallioniemi A,
Bar-lund M, Schraml P, Leighton S, et al. Tissue microarrays for high-throughput molecular profiling of tumor specimens. Nat Med 1998; 4:844–7.
(15) Hartmann WH, Ozzello L, Sobin LH,
Stals-berg H, editors. Histological typing of breast tumors. 2nded. Geneva (Switzerland): World
Health Organization; 1981.
(16) Sobin LH, Wittekind C, editors. TNM
classi-fication of malignant tumours. 5th ed. New
York (NY): John Wiley & Sons; 1997.
(17) Kallioniemi OP, Kallioniemi A, Piper J, Isola
J, Waldman FM, Gray JW, et al. Optimizing comparative genomic hybridization for analy-sis of DNA sequence copy number changes in solid tumors. Genes Chromosomes Cancer 1994;10:231–43.
(18) Duggan DJ, Bittner M, Chen Y, Meltzer P,
Trent JM. Expression profiling using cDNA microarrays. Nat Genet 1999;21(1 Suppl): 10–4.
(19) Ermolaeva O, Rastogi M, Pruitt KD, Schuler
GD, Bittner ML, Chen Y, et al. Data manage-ment and analysis for gene expression arrays. Nat Genet 1998;20:19–23.
(20) Microarray Project. Bethesda (MD): National
Institutes of Health, National Human Genome Research Institute. Available from URL: http:// www.nhgri.nih.gov/DIR/LCG/15K/HTML/.
(21) GeneMap ‘98. Bethesda (MD): National
Insti-tutes of Health, National Center for Biotech-nology Information. Citation date 2/11/99. Available from URL: http://www.ncbi.nlm. nih.gov/genemap/.
(22) Khan J, Simon R, Bittner M, Chen Y, Leighton
SB, Pohida T, et al. Gene expression profiling of alveolar rhabdomyosarcoma with cDNA mi-croarrays. Cancer Res 1998;58:5009–13.
(23) Chen Y, Dougherty ER, Bittner ML.
Ratio-based decisions and the quantitative analysis of cDNA microarray images. J Biomed Optics 1997;2:364–74.
(24) Sambrook J, Fritsch EF, Maniatis T. Molecular
cloning. A laboratory manual. Cold Spring Harbor (NY): Cold Spring Harbor Laboratory Press; 1989.
(25) UniGene Human Sequences Collection.
Bethesda (MD): National Institutes of Health, National Center for Biotechnology Informa-tion. Citation date 10/4/98. Available from URL: http://www.ncbi.nlm.nih.gov/UniGene/.
(26) Reinhard C, Thomas G, Kozma SC. A single
gene encodes two isoforms of the p70 S6 ki-nase: activation upon mitogenic stimulation. Proc Natl Acad Sci U S A 1992;89:4052–6.
(27) Grove JR, Banerjee P, Balasubramanyam A,
Coffer PJ, Price DJ, Avruch J, et al. Cloning and expression of two human p70 S6 kinase polypeptides differing only at their amino ter-mini. Mol Cell Biol 1991;11:5541–50.
(28) Chou MM, Blenis J. The 70 kDa S6 kinase:
regulation of a kinase with multiple roles in mitogenic signalling. Curr Opin Cell Biol 1995;7:806–14.
(29) Pullen N, Dennis PB, Andjelkovic M, Dufner
A, Kozma SC, Hemmings BA, et al. Phosphor-ylation and activation of p70s6kby PDK1.
Sci-ence 1998;279:707–10.
(30) Ross JS, Fletcher JA. The HER-2/neu
onco-gene: prognostic factor, predictive factor and target for therapy. Semin Cancer Biol 1999;9: 125–38.
(31) Grammer TC, Cheatham L, Chou MM, Blenis
J. The p70S6K signalling pathway: a novel sig-nalling system involved in growth regulation. Cancer Surv 1996;27:271–92.
(32) Thomas G, Hall MN. TOR signalling and
con-trol of cell growth. Curr Opin Cell Biol 1997; 9:782–7.
(33) Lane HA, Fernandez A, Lamb NJ, Thomas G.
p70s6k function is essential for G1 progres-sion. Nature 1993;363:170–2.
(34) Couch FJ, Wang XY, Wu GJ, Qian J, Jenkins
RB, James CD. Localization of PS6K to chro-mosomal region 17q23 and determination of its amplification in breast cancer. Cancer Res 1999;59:1408–11.
(35) Shi Y, Frankel A, Radvanyi LG, Penn LZ,
Miller RG, Mills GB. Rapamycin enhances ap-optosis and increases sensitivity to cisplatin in
vitro. Cancer Res 1995;55:1982–8.
(36) Hashemolhosseini S, Nagamine Y, Morley SJ,
Desrivieres S, Mercep L, Ferrari S. Rapamycin inhibition of the G1 to S phase transition is mediated by effects on cyclin D1 mRNA and protein stability. J Biol Chem 1998;273: 14424–9.
(37) Hosoi H, Dilling MB, Shikata T, Liu LN, Shu
L, Ashmun RA, et al. Rapamycin causes poorly reversible inhibition of mTOR and in-duces p53-independent apoptosis in human rhabdomyosarcoma cells. Cancer Res 1999;59: 886–94.
(38) Brown PO, Botstein D. Exploring the new
world of the genome with DNA microarrays. Nat Genet 1999;21(1 Suppl):33–7.
N
OTESSupported in part by the Finnish Cultural Foun-dation, the Emil Aaltonen FounFoun-dation, the Tampere University Hospital Research Foundation, and the Swiss National Science Foundation (81BS-052807). We thank Yuan Jiang for excellent technical as-sistance.
Manuscript received July 26, 1999; revised May 19, 2000; accepted May 30, 2000.