Deindustrialization and Changes in
Manufacturing Trade: Factor Content
Calculations for 1978-1995
David Kucera and William Milberg
International Institute for Labour Studies of the International Labour Organization, Geneva; Department of Economics, New School University,
New York
Abstract: Input-output analysis is used to estimate the labor content embodied in changes in manufacturing output resulting from changing patterns of manu- facturing trade. For ten OECD countries from the late 1970s to the mid-1990s, changes in world trade of manufactures are estimated to have had a negative net effect on manufacturing employment of 3.5 million jobs, 2.0 million in the US alone, compared to a 6.2 million decline in actual manufacturing employ- ment. The employment losses resulted mainly from North-South trade. At the industry level, there were large losses in labor-intensive industries and in in- dustries that were strategically targeted by developing country industrial poli- cies. There were employment losses in nearly all manufacturing industries, not a mixture of winners and losers. Such a pattern may result not from surging imports from the South but rather declining exports to the South in the after- math of the 1980s debt crisis. JEL no. FIG F16, 024
Keywords: International trade; deindustrialization; factor content analysis
1 Introduction
T h e long-standing academic debate over the role o f developing c o u n t r y trade in the deindustrialization o f the developed world was rekindled in the 1990s as developing c o u n t r y exports to OECD markets reached historic highs. O n one side o f the debate were those w h o claimed the rela- tive u n i m p o r t a n c e o f N o r t h - S o u t h trade for industrial c o u n t r y m a n u - facturing e m p l o y m e n t ( K r u g m a n 1996; K r u g m a n and Lawrence 1996; Remark: We are grateful to Anwar Shaikh, Duncan Foley and especially to an anony- mous referee for comments on an earlier draft. Please address correspondence to William Milberg, Department of Economics, New School University, 65 Fifth Avenue, New York, NY 10003, USA; e-mail: [email protected]
Rowthorn and Ramaswamy 1999). On the other side were those who claimed that North-South trade contributed substantially to developed country deindustrialization (Sachs and Shatz 1994; Wood 1994, 1995; Saeger 1997). In this paper we use input-output analysis to estimate the labor content embodied in changes in manufacturing output (fi- nal demand plus intermediate goods) resulting from changing patterns of manufacturing trade - that is, we assess the role of manufacturing trade in deindustrialization. Evaluated are ten OECD countries, the G7 plus Australia, Denmark and the Netherlands, from the late 1970s to the mid-1990s. We find that for these ten countries, changes in world trade of manufactures are estimated to have had a negative net effect on manufacturing employment of 3.5 million jobs, 2.0 million of these in the US alone, compared to a 6.2 million decline in actual manufacturing employment for these ten countries over the period (OECD 1999).
Breaking up the sources of these employment losses between North- North and North-South trade reveals that they are driven almost exclu- sively by the latter: changes in North-South trade by itself are estimated to have resulted in 3.5 million fewer manufacturing jobs over the period. Changes in North-North trade are estimated to have resulted in a net loss of only 20,000 manufacturing jobs for these ten countries, with six of the ten countries estimated to gain employment from North-North trade and with Canada, Denmark, and the Netherlands the biggest gain- ers relative to late 1970s manufacturing employment. For North-South trade, in contrast, all ten countries are estimated to have lost manufac- turing employment from changing trade patterns.
As we enter the final years of the implementation of the 1994 Uruguay Round Agreement, with many of its tariff reductions back-ended for the 2002-2004 period (for example in textiles and apparel) imports from developing countries are likely to rise further. While these changing trade patterns are a positive development for many developing countries, resulting manufacturing job losses in developed countries could be an important policy issue, especially if this period of trade liberalization coincides with a global slowdown in economic growth. At the same time, it is worth emphasizing that we evaluate the effects of manufacturing trade on manufacturing employment, not the effects of trade on the economy as a whole. The policy issue therefore is not so much job loss as such but rather job reallocation from manufacturing to other sectors of the economy. The case of the US is telling in this regard, for while changes in world trade are estimated to have resulted in 2.0 million fewer
Kucera/Milberg: Deindustrialization and Changes in Manufacturing Trade 603 manufacturing jobs, with North-South trade accounting for 1.3 million of these, the US economy as a whole gained nearly 25 million jobs over this same period (OECD 1999).
One of the benefits of using input-output analysis to evaluate the effects of trade is that it yields industry-level results which are partic- ularly useful in providing insights into the causes of manufacturing employment losses resulting from North-South trade. We identify three factors contributing to these losses. First, consistent with standard trade theory and prior factor content studies, there are disproportionate em- ployment losses in labor-intensive industries, particularly in textiles, apparel, leather and leather goods, which account for 1.1 million of the 3.5 million in employment losses estimated to result from North-South trade expansion for our group of ten countries.
Second, large losses are estimated in industries that are not compar- atively labor-intensive but that have been targeted by industrial policies in a number of industrializing countries of the South. These indus- tries produce electronic equipment (including consumer electronics and computers) and motor vehicles.
Third, we find estimated employment losses in 20 of 22 manufactur- ing industries as a result of changing patterns of North-South trade. This differs from the findings of an earlier round of factor content studies, described by Wood (1991: 22) as follows: "All the studies have identified the same sets of winning and losing sectors. The losers include food processing, wood products, textiles and clothing, and leather goods and footwear. These losses have been largely offset, however, by increased employment in the machinery and chemicals industries" This picture - of distinct lists of "winners" and "losers" - is at odds with the findings of this study that industries differ mainly in the extent to which they suffered manufacturing job losses relative to the benchmark scenario. This suggests the importance of factors that cut across industries. We observe, for example, that while the ten developed OECD countries in the sample had a fairly steady increase in imports from non-OECD countries over the period, they also exhibited a sharp decline in exports to the South in the first half of the 1980s, when a number of developing countries experienced slow or negative growth as a result of their debt crises.
This paper contains five sections. Section 2 gives an overview of trade expansion with the North and South for our group of coun- tries, comparing patterns of import penetration as well as volumes of
trade with the South relative to volumes of world trade. Section 3 de- scribes the method of factor content results and then country-level results in the context of actual changes in manufacturing and total employment. Section 4 provides industry-level results, and Section 5 concludes.
2 Comparing OECD and Non-OECD Trade Expansion
This study makes use of OECD Bilateral Trade Database (1998a) in which
the trade between our ten countries and the OECD and non-OECD regions are based on pre-1990s OECD membership. That is, the newer members of the OECD (the Czech Republic, Hungary, Poland, Mexico and South Korea) are included in the non-OECD region. Thus the trade between the ten countries in our study and the OECD and non-OECD regions provide an approximation of North-North and North-South trade, respectively, and hereafter we refer to the trade with the OECD and non-OECD regions accordingly.
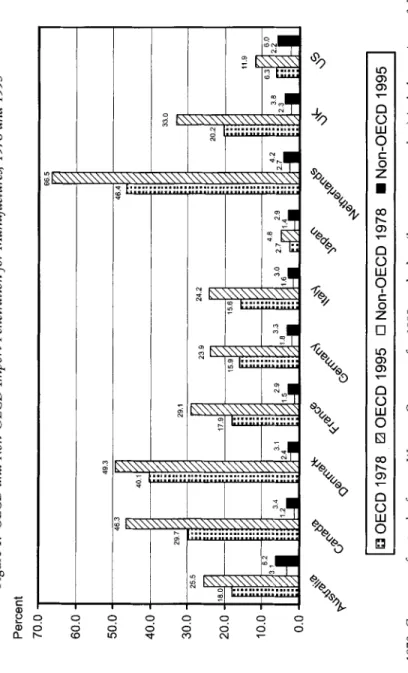
Import penetration is a commonly used measure of the presence of foreign goods in domestic markets, and is defined as the ratio of manufacturing imports to domestic consumption (domestic production plus net imports) of manufactures. Figure 1 shows OECD and non- OECD import penetration for the ten countries in 1978 and 1995. The ten countries have three things in common regarding these measures. M1 had higher OECD than non-OECD import penetration in both 1978 and 1995; in terms of growth indicated by percent changes, import penetration increased more for non-OECD than OECD trade in all ten countries; in terms of percentage point differences, however, in absolute terms import penetration increased more for OECD than non-OECD trade in all ten countries. The levels of non-OECD import penetration are relatively low and their variance small, ranging from 2.9 percent for France and Japan to 6.2 percent for Australia in 1995. OECD import penetration ranges much more widely, from 4.8 percent for Japan to 66.5 percent for the Netherlands in 1995.
Import penetration is not a measure of trade performance, as it is essentially one-sided. It is worth mentioning in this regard that the three countries with the highest OECD import penetration, Canada, Denmark and the Netherlands, also had the largest increases over the period in the ratio of OECD manufacturing exports to imports (and
Percent 70.0 60.0 50.0 40.0 30.0 20,0 10.0 0.0 Figure 1: OECD and Non-OECD Import Penetration for Manufactures, 1978 and 1995 33.0 29.7 t 20.2 8.9 11.9
+o. o
I=OECD
1978
eOECD
1995
DNon-OECD
1978
=Non-OECD
1995
I
49.3 46.3 4L1-II
//
66.5 46,4 .'.'7. ;"1 ;"1 17.9 15.6 15.9i1'?1
.~
Note: For 1978, Germany refers to the former Western Germany; for 1995, trade data (but not output data) includes regions of the former East Germany. Source: OECD (1998b, 1998a). e. # t~ 5" e~ 5" 5" G~indeed are estimated to gain the most in terms of relative manufactur- ing employment from changes in OECD trade of manufactures).1 From the viewpoint of OECD countries, however, non-OECD import pene- tration has a different significance than OECD import penetration as regards employment effects from trade expansion. This is because trade between OECD and non-OECD countries is characterized by greater differences in the labor intensity of production than intra-OECD trade and in particular that exports from non-OECD to OECD countries are generally more labor-intensive than exports from OECD to non- OECD countries. As such, even if increased imports from non-OECD countries are balanced by increased exports to non-OECD countries, the differences in the labor intensity of trade will result in manufac- turing employment losses. Wood emphasizes this point in explain- ing his and Sachs and Shatz's (1994) estimates of losses in manufac- turing employment resulting from North-South trade expansion. He writes:
The fundamental reason for this outcome is that the goods im- ported by developed countries are more labor intensive than those they export: it would occur even if trade were balanced and thus does not depend on the existence of a trade deficit, which is often portrayed as the culprit in the US. (Wood 1995: 66)
An additional sense of the relative importance of OECD versus non- OECD trade is provided by Figure 2, which shows non-OECD manufac- turing trade (exports plus imports) as a percent of world manufacturing trade in 1970-1995 for the ten countries in our study taken together. The measure never exceeds 30 percent over the period and does not show a strong overall increase. There has been a stronger increase in more recent years, however, with the measure increasing from 23 to 29 percent from 1990 to 1995. This suggests that it is useful to fol- low up on earlier factor content studies, particularly Sachs and Shatz (1994) and Wood (1994), both of which evaluate the period up to 1990.
1 From the late 1970s to the mid-1990s, the ratio of OECD manufacturing exports to imports increased from 0.90 to 1.04 for Canada, 0.80 to 1.13 for Denmark and 1.03 to 1.15 for the Netherlands (OECD 1998a). The only other country in the sample with a comparable increase was Germany, for which the measure increased from 1.28 to 1.39. These ratios are based on three-year endpoint averages for the identical span of years evaluated with factor content analysis, as noted below.
35
30
25
20
15
Kucera/Milherg: Deindustrialization and Changes in Manufacturing Trade 6 0 7 Figure 2: Non-OECD Manufacturing Trade as a Percent of World
Manufacturing Trade, 10 Country Total, 1970-1995
Source: OECD (1998a).
3 Factor Content Calculations and Country-Level Results
Our estimates of the effects of changes in manufacturing trade on manu- facturing employment are based on similar factor content calculations as used by Sachs and Shatz (1994). 2 The input-output model is defined
as
L =/~ [(I - A)-IT], (1)
where
L = the vector of changes in manufacturing employment associated with the changing structure of manufacturing trade,
/~ = the diagonal matrix of labor coefficients (employment per unit of output),
2 Our estimates differ in that we define final demand as domestic production for final demand plus imports rather than, as Sachs and Shatz (1994: 27) do, domestic produc- tion for final demand plus net imports. Generally speaking, these different definitions of final demand yield very similar results. However, there are cases (for instance, rub- ber and plastic products and fabricated metal products in Italy) where final demand as defined by Sachs and Shatz yields negative values, in that exports exceed the sum of domestic production for final demand and imports, leading to wildly inaccurate esti- mates of the effects of trade on employment. Very similar results are also obtained by using either domestic production or final demand in the construction of the trade ex- pansion vector. See Wood (1994: 72) for a discussion of the relative merits of using domestic production or final demand (value added) in the calculation of the trade ex- pansion vector. Wood concludes that "there is no single best way to do the calcula- tions."
I = the identity matrix,
A -=- the technical coefficients matrix, and T = the trade expansion vector. T is defined as:
T = (X 9 s - M 95) - - ( X 7 s - MYS)(D95/DTS), (2) where
X, M = vectors of export and import values, respectively, and
D = vector of final demand, that is, domestic production for final demand plus imports. D is thus defined as
D = [(I - A)Q] + M, (3)
where Q = domestic production.
Put in words, T is defined for each industry as the difference between actual net exports at the end of the period and a counterfactual level of net exports that would have resulted at the end of the period had the ratio of net exports to final demand remained constant over the period - that is, had trade propensities relative to final demand remained constant. When T is used as the measure of final demand in the input-output model, therefore, L provides an estimate of how trade has changed manufacturing employment from what it would have been had the structure of trade remained unchanged, with the input-output model accounting for the effects of T on L through demand for both final and intermediate outputs. T is constructed separately for world trade (OECD plus non-OECD) and non-OECD trade. This yields L for both world and non-OECD trade, with L for OECD trade defined as the difference between the two.
This study makes use of the OECD's STAN Structural Analysis data-
bases, which have the advantage of having trade, input-output, produc- tion, employment and price data largely standardized across 22 manu- facturing industries. The ten countries in our study are those for which input-output data are available in these datasets. Input-output data are for 1990 for seven of the ten countries, differing for Australia (1989), Italy (1985) and the Netherlands (1986). All values are converted to real terms for the year of the input-output data and labor coefficients are also for the same year. Regarding the superscripts in (2), endpoints are cal- culated as three-year averages, to smooth out point-to-point volatility. Thus "78" refers to the average for 1978-1980 and "95" refers to the aver- age for 1993-1995. For some countries, data do not run to 1993-1995,
Kucera/Milberg: Deindustrialization and Changes in Manufacturing Trade 609 Table 1:
Country-Level Manufacturing Employment Effects from Trade of
Manufactures
Number of Relative to Number of Relative to
employees 1978-80 employees 1978-80
in worker years mfg, emp. (%) in worker years rnfg. emp. (%) Australia (1978-92) World Trade - 8 5 730 OECD Trade - 4 4 105 Non-OECD Trade -41 625 Canada (1978-95) World Trade 129 658 OECD Trade 329 819 Non-OECD Trade - 2 0 0 160 Denmark (1978-94) World Trade 92 321 OECD Trade 114 570 Non-OECD Trade - 2 2 249 France (1978-95) World Trade - 109 230 OECD Trade 112 818 Non-OECD Trade - 2 2 2 048 Germany (1978-90) World Trade 76 193 OECD Trade 370 268 Non-OECD Trade -446 461 Italy (1978-94) WorLd Trade - 5 9 155 OECD Trade 83 403 Non-OECD Trade -142 558 7.10 18.06 10.96 Japan (1978-95) 6 . 9 5 World Trade -941 391 -6.78 -3.58 OECD Trade - 3 4 5 861 -2.49 -3,37 Non-OECD Trade - 5 9 5 530 -4,29 Netherlands (1978-95) World Trade 187 327 18.18 OECD Trade 280 588 27.23 Non-OECD Trade - 9 3 261 -9.05 United Kingdom (1978-94) 18.60 World Trade -659 902 -9.04 2 3 . 0 8 OECD Trade -152434 -2.09 -4.48 Non-OECD Trade - 507 467 -6.95 United States (1978-95) -1.99 World Trade - 2 0 2 1 256 -9.85 2.06 OECD Trade - 7 6 8 626 -3.75 4.05 Non~OECD Trade - 1 2 5 2 630 -6.10 10 country total --0.85 World Trade - 3 543 549 -5.32 4 . 1 1 OECD Trade - 1 9 5 6 0 -0.03 -4.96 Non-OECD Trade 3 523 989 -5.29 --l.01 1.42 --2.42 Source: O E C D ( 1 9 9 8 b , 1998a, 1995).
as is indicated in the span of years following country headings in Table 1. Throughout this study, Germany refers exclusively to the former West Germany or the regions of the former West Germany, except as noted in Figure 1.
Country-level results are shown in Table 1 both in absolute terms, i.e., by the number of manufacturing employees in worker years, and in relative terms, i.e., by the number of manufacturing employees as a per- centage of 1978-1980 manufacturing employment. Ten-country totals are shown at the bottom right of the table, indicating that employment in manufacturing would have been 3.5 million worker years higher if the trade structure had stayed the same over the period. This result is driven by 3.5 million in estimated losses from non-OECD trade and with OECD trade estimated to result in a net loss of 20,000 jobs compared to
the counterfactual. The 3.5 million in lower employment is equivalent to 5.3 percent of manufacturing employment for the ten countries in 1978-1980. Looking at individual countries, three of ten countries are estimated to gain from world trade and six of ten from OECD trade. Each of our ten countries is estimated to lose manufacturing employ- ment from non-OECD trade of manufactures.
The US has far and away the largest estimated absolute manufactur- ing employment losses compared to the other nine countries for world, OECD and non-OECD trade, with figures of 2.0 million, 0.8 million, and 1.3 million, respectively. These large absolute losses are consistent with patterns of net imports for world trade of manufactures, shown in Figure 3, comparing the US with the aggregate of the other nine countries in the study. The US ran a trade deficit in manufactures for every year after 1981 and showed a trend increase in net imports over
the 1978-1995 period. The other nine countries ran trade
surpluses
inmanufactures over the entire 1970-1995 period, peaking in 1995. The pattern of net imports for the US and the other nine countries is particu- larly divergent from 1990 to 1995, when the measure increased strongly for the US and decreased even more strongly for the other nine countries taken together.
The figure of 1.3 million for the US in the case of non-OECD trade is equivalent to 6.1 percent of 1978-1980 manufacturing employment, just slightly higher than the estimate by Sachs and Shatz for the US of 5.7 percent of 1978 manufacturing employment resulting from devel- oping country trade expansion between 1978 and 1990 (Sachs and Shatz 1994: 29). Our results for world trade of manufactures nevertheless do differ substantially from Sachs and Shatz's as a result of considerably different estimates for OECD trade. Sachs and Shatz estimate that ex- pansion of world trade of manufactures led to a loss of 1.2 million manufacturing jobs (compared to our figure of 2.0 million) with nearly all of this resulting from trade with developing countries. Much of the difference between our and Sachs and Shatz's estimates appears to result from our inclusion of the 1990-1995 period, when the US manufactur- ing trade deficit increased by 76.4 billion (constant 1990) US dollars, with 44.7 billion of this accounted for by OECD trade? Although the rapid increase in the US manufacturing trade deficit in the 1990s con-
3 In addition, Sachs and Shatz (1994: 10) use somewhat different definitions of North and South than we do. For instance, they include Spain and Portugal in the group of
Kucera/Milberg: Deindustrialization and Changes in Manufacturing Trade 611
Figure 3: Net Imports of Manufactures for the US and the Aggregate of 9 Other
OECD Countries, 1970-1995 Billions of 1990 US $ 300 200 100 -100 -200 -300 m -400 , ,
Source: OECD (1998a).
tributed to the estimated manufacturing job loss, it is arguable that this deficit was driven by the comparatively rapid growth of the US economy during these years and reflects, in this sense, economic success rather than failure.
Next after the US, Japan is the country with the largest estimated absolute manufacturing employment losses for world, OECD and non- OECD trade, with figures of 0.9 million, 0.3 million, and 0.6 million, respectively. These figures might seem surprising given Japan's well- known export success, but of all countries in the sample Japan in fact
had the largest decline in its ratio of exports to imports for both world
and OECD trade in manufactures. 4
developing countries and the former Czechoslovakia and East Germany in the group of developed countries.
4 Japan's export-import ratios for world trade declined from 2.43 to 1.97 and for OECD trade from 2.00 to 1.84 from 1978 to 1995, based on three-year endpoint aver- ages (OECD 1998a).
The US and Japan also had the largest absolute number of manu- facturing employees of the ten countries, and for the purposes of cross- country comparison it is more useful to consider estimated employment changes in relative terms, that is in terms of overall manufacturing em- ployment. Figure 4 shows the number of manufacturing employees as a percent of 1978-1980 manufacturing employment (the figures are also contained in Table 1). Comparing non-OECD with OECD trade effects, we see smaller variations in the former. For non-OECD trade, the meas- ure ranges from - 2 . 4 percent for Italy to -11.0 percent for Canada, with most countries hovering around - 5 percent. For OECD trade, in contrast, the measure ranges much more widely, from -3.8 percent for the US to 27.2 percent for the Netherlands. The Netherlands, Denmark and Canada, in that order, were the largest relative gainers from OECD trade of manufactures. Accordingly, these three nations also had the
Figure 4: Manufacturing Employment Effects from Trade of Manufactures (as a % of 1978-80 manufacturing employment)
I ~ / Australia ,////////////////////////////////////A Canada ' I "/////////////////////////////////////)//, "/////,~ Denmark r ~ r773 m r- zE2223 m [- 771 I I 1 - ¸
/////////////////////////////////////////I///////////////l]
[] World l~ OECD • Non-OECDU
France Germany Italy Japan Netherlands UK US 10 Country TotalKucera/Milberg: Deindustrialization and Changes in Manufacturing Trade 613 largest increases in OECD manufacturing export-import ratios over the period (see Footnote 1). These are also the only three countries esti- mated to have gained manufacturing employment from world trade of manufactures compared to the benchmark case. In addition, Germany also had sizeable relative gains and the largest absolute gains (370,000) of our ten countries from OECD manufacturing trade expansion. The large absolute losses for the US and Japan do not appear exceptional when compared with the number of manufacturing employees as of the late 1970s.
It is useful to situate results not only relative to late 1970s manufac- turing employment, but also relative to actual changes in manufacturing and total employment over the period as well as to changes in the manu- facturing share of total employment. This latter is the standard indicator of "deindustrialization." Table 2 provides this data for the beginning and end of the period as well as differences and percentage changes across the period, all based on three-year endpoint averages. All coun- tries except Japan experienced losses in manufacturing employment over the period, with net losses for the ten countries of 6.2 million. 5 This compares with the estimated 3.5 million in manufacturing employment losses from non-OECD manufacturing trade expansion for the ten coun- tries, meaning that such trade is equivalent to over half (56.7 percent) of actual manufacturing employment losses. Note that these figures are not adjusted in any way, such as that proposed by Wood (1995) who ar- gues that factor content calculations underestimate the negative effects of North-South trade of manufactures on manufacturing employment in the North. 6
5 Rowthorn and Ramaswamy (1999: 31) suggest that the experience of Japan in this regard may result from the exceptional decline in the relative price of manufactured goods, which stimulated domestic demand for these goods.
6 Wood has argued that employment estimates from factor content calculations such as used in Sachs and Shatz (1994) and in our study of the effects of North-South trade on manufacturing employment in the North should be roughly quadrupled (Wood: 1995). Wood argues that the estimates should be doubled based on the greater la- bor intensity within industries of "non-competing" imports from the South and then doubled again based on his estimates of the effects of trade competition on labor- displacing technical change in the traded goods sector. However, Wood's adjustments result in what seem to be improbably high estimates of the effects of North-South trade expansion on manufacturing employment losses in the North. We find, for in- stance, an estimated loss of 3.5 million manufacturing jobs in our ten countries as a result of non-OECD manufacturing trade expansion. Leaving aside the second ad- justment, the doubled figure of 7.0 million as per Wood's first adjustment compares to
All ten countries experienced deindustrialization over the period, with particularly large percentage change declines (over 25 percent) in the manufacturing share of total employment in Australia, Canada, France, the Netherlands, the UK and the US. However, all countries also experienced increases in total employment over the period, with especially strong increases in Australia, Canada and the US, all among those countries experiencing the most rapid deindustrialization. Total employment increased for the ten countries by 41.6 million over the period. Setting the 6.2 million in manufacturing employment losses against the 41.6 million in total employment gains, it is clear that dein- dustrialization is driven more by increases in total employment rather than by declines in manufacturing employment. This is especially so in the cases of Australia, Canada and the US, where exceptionally rapid deindustrialization results not from exceptionally high rates of manu- facturing employment loss, but rather from exceptionally high rates of total employment gain.
Precisely how much of deindustrialization is accounted for by non- OECD manufacturing trade expansion? For the ten countries, manufac- turing employment as a percentage of total employment declined from 24.6 to 19.3 percent over the period, or by 5.3 percentage points. If we assume that manufacturing employment at the end of the period would have been higher by 3.5 million in the absence of changes in the structure of non-OECD trade, then manufacturing employment as a percentage of total employment would have declined by 4.1 percentage points. This means that non-OECD trade expansion is estimated to account for 21.5 percent of deindustrialization. This is similar to estimates from earlier studies of North-South trade expansion on deindustrialization in the North, based on panel data econometric models and evaluating different periods and using somewhat different definitions of North and South. For instance, Rowthorn and Ramaswamy arrive at an estimate of 20 percent, based on a sample of 18 OECD countries evaluated over the 1970-1994 period (1999). Saeger (1997) estimates that 25-30 per- cent of the decline in the manufacturing share of total employment in
an actual decline in manufacturing employment of 6.2 million for these ten countries over the same period. Given that other factors are also found in other studies to con- tribute substantially to deindustrialization (such as shifts in the structure of demand away from manufactured goods and labor-displacing technical change not induced by trade (Saeger 1997; Rowthorn and Ramaswamy 1999)), the adjusted figure of 7.0 mil- lion appears quite high, let alone the redoubled figure of 14.0 million.
Kucera/Milberg: Deindustrialization and Changes in Manufacturing Trade 615
Table 2: Changes in Employment and Deindustrialization (based on 3-year endpoint averages)
Beginning End of Absolute Percent
of period period difference change
A. Manufacturing employment Australia (t978-1992) 1 233 333 1 143 333 - 9 0 000 - 7 . 3 0 Canada (1978-1995) 1 825 933 1 671 227 - 1 5 4 707 -8.47 Denmark (1978-1994) 496 337 483 098 - 13 239 -2.67 France (1978-1995) 5 476 900 4 055 500 - 1 421 400 -25.95 Germany (1978-1990) 9 003 667 8 731 000 - 2 7 2 667 -3.03 Italy (1978-1994) 5 882 033 4 684 767 - 1 197 267 -20.35 Japan (1978-1995) 13 888 000 15 400 333 1 512 333 10.89 Netherlands (1978-1995) 1 030333 894333 - 1 3 6 0 0 0 -13.20 United Kingdom (1978-1994) 7301000 4981 503 - 2 319497 -31.77 United States (1978-1995) 20 521 000 18 396 667 - 2 124 333 -10.35 Total 66 658 537 60 441 761 - 6 216 776 -9.33 B. Total employment Australia (1978-1992) 6 201 040 7 771 123 1 570 083 25.32 Canada (1978-1995) 10 719 650 13 271 164 2 551 514 23.80 Denmark (1978-1994) 2 476 923 2 539 833 62 910 2.54 France (1978-1995) 21 972 500 22 300 442 327 942 1.49 Germany (1978-1990) 26 559 333 27 799 333 1 240 000 4.67 Italy (1978-1994) 20 460 196 20 524 917 64 721 0.32 Japan (1978-1995) 54 745 847 64 536 164 9 790 317 17.88 Netherlands (1978-1995) 5 120 628 5 969 333 848 705 16.57 United Kingdom (1978-1994) 25 261 976 25 712 027 450 051 1.78 United States (1978-1995) 98 058 250 t22 745 139 24 686 889 25.18 Total 271 576 344 313 169476 41593 132 15.32 C. Manufacturing employment as a percent of total employment
Australia (1978-1992) 19.89 14.71 -5.18 -26.03 Canada (1978-1995) 17.03 12.59 -4.44 -26.07 Denmark (1978-1994) 20.04 19.02 -1.02 -5.08 France (1978-1995) 24.93 18.19 -6.74 -27.04 Germany (1978-1990) 33.90 31.41 -2.49 -7.35 Italy (1978-1994) 28.75 22.82 -5.92 -20.61 Japan (1978-1995) 25.37 23.86 -1.51 -5.93 Netherlands (1978-1995) 20.12 14.98 - 5 . 1 4 -25.54 United Kingdom (1978-1994) 28.90 19.37 -9.53 -32.96 United States (1978-1995) 20.93 14.99 - 5 . 9 4 -28.38 Total 24.55 19.30 -5.25 -21.37 Source: OECD (1998b, 1999).
the North is accounted for by North-South trade expansion, based on a sample of up to 23 OECD countries evaluated over the 1970-1990 period.
4 Industry-Level Results
Tables 3 and 4 show industry-level results for OECD and non-OECD manufacturing trade, respectively. The industries in these tables are ranked from most to least labor-intensive, based on average ordinal rankings for the four countries for which labor coefficients are available for all 22 industries (France, Italy, Japan and the UK). The textiles, apparel, leather and leather goods sector is the most labor-intensive, and the petroleum and coal products sector the least labor-intensive.
For the ten countries taken together, 15 of 22 manufacturing indus- tries are estimated to have lost employment as a result of changes in OECD trade relative to the counterfactual. There are four industries es- timated to have gained or lost more than about 80,000 in manufacturing employment from OECD trade of manufactures. The only one of these four with estimated losses is radio, TV and communication equipment (-92,000), with losses particularly large in Japan. The estimated gains in wood products and furniture (79,000) are driven largely by Canada and Italy, and the estimated gains in fabricated metal products (94,000) were predominantly in Italy. Note that these two industries are com- paratively labor-intensive. The estimated gains in paper, paper products and printing (95,000) are driven largely by France, Germany, and the UK.
For the four countries with the largest estimated gains (absolute and relative) from OECD manufacturing trade for the manufacturing sector as a whole - Canada, Denmark, Germany, and the Netherlands - we also see employment gains across a wide range of industries. The US shows employment losses across a wide range of industries. These patterns are, we have noted, consistent with changes in trade balances for these countries for the manufacturing sector as a whole.
For non-OECD manufacturing trade for the ten countries in total, there are seven manufacturing industries estimated to have lost more than about 200,000 in employment across the ten-country sample as a result o f n o n - O E C D trade expansion. Far and away the most import- ant of these is textiles, apparel, leather and leather goods, with estimated
Table 3: Industry-Level Employment Effects from OECD Trade of Manufactures (numbers of employees in worker years, with industries ranked from most to least labor-intensive) OECD STAN ISIC Rev. 2 Australia Canada Denmark France Germany Italy Japan Netherlands UK US 10 country total 1 32 Textiles, apparel, leather & leather goods 15109 14480 13112 -1640 3,0980 50159 -85500 , 50890 ,-34300 -67800 -14510 o 31 893 1030 --9 606 8 048 250 --24 880 11906 14788 --85290 --13450 9984 --17330 6530 --49442 12050 11257 5720 41590 --25580 --56760 --1418 49884 24454 47060 29867 --48920 --174620 -32334 na 2 857 --29780 na --2 180 na --32 353 9755 2457 --11893 6810 --7299 --16610 --4959 4 385 Professional goods & precision instruments --3 389 -355 2744 6 172 5 355 + 356 Rubber & plastic products -1 333 24 522 5 407 6 730 6 383-3832 Electrical equipment, other 194 -8580 6723 11968 7 382 - 3825 Non-electrical machinery -1 856 19407 15430 6960 8 3842 + 3844 Other transport na na na -3 250 q- 3849 9 36 Non-metallic mineral products 827 3 595 3 145 4254 10 39 Jewelry, musical instruments, toys & 12 3841 Shipbuilding & repairing 4040 559 2417 211 767 1606 -8477 ... "J2-65 ... 8494 ~ ~7164 ... 4~778~ na -7 751 570 -2 289 - 1 559 -8 678 -24 169 15 3845 Aircraft 16 3825 Office & computing machinery 17 3843 Motor vehicles I8 37I Iron & steel 19 31 Food, beverages & tobacco 20 351 + 352 Industrial chemicals -- 3522 21 372 Non-ferrous metals 22 353 + 354 Petroleum & coal products --10 843 30 920 na 14 940 5 057 2 265 10 317 na 17 154 na -923 -9200 -2250 54610 -1 445 142 250 4559 -40260 40231 -31950 -49040 -690 15819 17 425l 23230 8875 -5828 --18 310 1 232 6 357 23 369 12 819 6 596 --19 040 --4 787 2 892 8 737 11 138 35 767 --24 140 230 --9 753 6 714 --528 4 136 8 600 4 057 --16 580 --1054 796 1074 --1234 424 --7171 --478
v
e~ o 7968 -19379 -36940 -8451 4942 19 558 -42 704 34453 o~ 15 206 15 755 -105 700 -15 348 ~- 15 141 -39 280 -70 370 -30164 11 820 --8 140 --69460 --20 107 22 819 1 327 26 930 64 099 3 059 --8 980 --48 700 --24 783 ~'~ na -10651 --28020 --42025 -- 1 160 1096 -2 540 -10 247 o'~ 280 588 -152 434 -768 626 -19 560 ~q Manufacturing total -44105 329819 114570 112818 370268 83403 -345861 Note: "na" indicates data not available; shaded rows indicate industries with roughly 80 000 or more in estimated employment gains or losses. Source: OECD (I998b, 1998a, ]995). Naemployment losses of 1.1 million. 7 Employment losses in this indus- try are estimated to be particularly high in Japan and the US. Italy is the only country estimated to gain employment from non-OECD trade expansion in textiles, apparel, leather and leather goods, not surpris- ing given the country's well-known competitive success in the industry. Employment losses are also estimated to be high in other compara- tively labor-intensive industries, particularly in fabricated metal prod- ucts (-295,000), rubber and plastic products (-220,000) and electrical equipment, other (-329,000). Each of our ten countries is estimated to have lost employment in these three industries as a result of non- OECD manufacturing trade expansion, with particularly large losses across these industries in France, Germany, Japan, the UK and the US. These findings are consistent with standard trade theory based on the comparative advantage of developing countries in the production of labor-intensive goods.
Employment losses are also estimated to be large in industries that are not comparatively labor-intensive, including radio, TV and com- munication equipment (-198,000), office and computing machinery (-215,000), and motor vehicles (-212,000). With the exception of mo- tor vehicles for the Netherlands, each of our ten countries is estimated to lose employment in each of these three industries from non-OECD trade. Losses across the three industries are estimated to be particularly large in Canada, France, Germany (though data on radio, TV and com- munication equipment are missing), Japan, the UK and the US. These findings are consistent with the well documented export successes in these industries of a number of developing countries, especially East Asian countries. These export successes depended not only on the forces of comparative advantage but also on targeted industrial policies aimed at improving international competitiveness. 8
There are estimated employment losses in 20 of 22 manufacturing industries, with the aircraft and petroleum and coal products industries the only exceptions. Moreover, estimated employment gains in these two industries are relatively small, summing to only 60,000. In contrast to the scenario found in earlier factor content studies of some winning
7 An earlier study finds that the "gender bias" of the manufacturing employment ef- fects of North-South trade, with women estimated to experience disproportionate em- ployment losses, results from the effects of trade in this (labor-intensive and female- intensive) industry (Kucera and Milberg 2000).
0 39 1 34 2 3841 Table 4: Industry-Level Employment Effects from Non-OECD Trade of Manufactures (numbers of employees in worker years, with industries ranked from most to least labor-intensive) OECD STAN ISIC Rev, 2 Australia Canada Denmark France Germany Italy Japan Netherlands UK US 10 country total ! 33 Wood products & furniture -393 -2 943 -1 013 -480 -7 640 805 -40610 -2 379 -4671 -26 630 -85954 e~ ' 382 - 3825 Non-electrical machinery 1 961 -5 144 23780 -4 197 -54 180 -29 180 -161479 ; 3842 + 3844 Other transport -1 128 -3 320 na -9 110 na -16 742 +3849 .-n 36 Non-metallic mineral products -1 183 -9 153 -5997 1 712 -9 171 -20630 --60695 0 Jewelry, musical instruments, toys & -5411 -4721 -3775 -3592 4121 -83660 -126707 ~. sporting goods, misc 1 Paper, paper products & printing 3160 -8061 -16590 -1257 -21270 -18620 -83158 t~ 2 Shipbuilding & repairing - 1763 2 362 3 750 224 4 525 2 071 - 109 4 3522 Drugs e~ meulcmes -133 -708 "~822 ... 971 5 3845 Aircraft -367 -1900 na 22330 918 -2818 233 478 --10390 39370 47853 0"Q 8 371 Iron & steel -2526 -8875 --347 --10680 --58870 --8825 35 6918 --13630 --38740 -149376 ~ --8 827 4 500 18 970 58300 na na na --3 184 na --3 176 --351 --3 534 --5 786 --7 028 -497 --5 730 --8 172 3 366 --392 --8 128 9 046 --1032 --991 --438 681 9 31 Food, beverages & tobacco 0 351 + 352 1 372 2 353+354 9 --11520 --2562 150 3751 --3461 3464 --31850 0 Industrial chemicals -133 -6832 -851 -5659 -36240 -26590 3651 - 3522 1 Non-ferrous metals 1475 --4928 -185 4523 14010 -2702 -20190 2 Petroleum & coal products 9644 -277 82 -152 318 -226 49 Manufacturing total -41625 -200160 -22249 -222048 -446461 -142558 -595530 ,lute: "na" indicates data not available; shaded rows indicate industries with roughly 200000 or more in estimated employment losses. --119 7467 10640 --24040 --8076 21630 --58400 --160761 na --8 629 --14 850 --68 542 608 --315 2 121 11 754 0"~ -93261 --507467 1252630 --3523989 g- 3X ource: OECD (1998a, 1998b, 1995). ',D
and some losing industries (Wood 1991), we observe employment losses across the full range of manufacturing industries. This suggests the im- portance of broader, perhaps macroeconomic factors. Illustrative in this regard are the patterns of non-OECD manufacturing exports and im- ports for the ten countries taken together, shown in Figure 5. Note that exports exceeded imports over the entire 1970-1995 period. Thus the estimated manufacturing employment losses occurred at the same time that these countries ran a surplus in manufactures trade. The surplus does narrow over the period, however, and this results from the export rather than import side. That is, for imports from non-OECD countries, we see a fairly steady overall increase. Exports from our ten countries to non-OECD countries most often moved in parallel to imports. When- ever non-OECD imports were rising rapidly - for example during the early 1970s and the 1990s - exports were growing at a similar rate. The exceptional period is the first half of the 1980s, when imports were flat but exports dropped very substantially in the wake of the early 1980s debt crisis, during which a number of developing countries experienced deep recessions. Evidence indicates that the pattern of cross-industry employment losses results not from surging imports from non-OECD
Figure 5: Non-OECD Manufacturing Exports and Imports of 10 Country Total,
1970-1995 Billions of 1990 US $ 700 600 500 400 300 200 100 0 ! I I I I ! I
Kucera/Milberg: Deindustrialization and Changes in Manufacturing Trade 621 countries but rather from a large drop in exports to non-OECD coun- tries. This suggests that slow economic growth in developing countries contributed to deindustrialization in richer countries. 9
5 Conclusion
We use input-output analysis to estimate changes in manufacturing em- ployment resulting from the changing structure of manufacturing trade, evaluating ten OECD countries over the period from the late 1970s to the mid-1990s. Employment losses from world trade of manufactures are driven by North-South trade and are equivalent to over one-half of the actual 6.2 million decline in manufacturing employment for our ten countries over the period. In this sense, manufacturing trade expansion is estimated to have contributed very substantially to deindustrialization. Moreover, all of our ten countries are estimated to have lost manufac- turing employment as a result of expanding trade with the South. In contrast, North-North manufacturing trade expansion is estimated to have had only negligible effects on manufacturing employment for our ten countries taken together, with losses in some countries offset by gains in others. If we define deindustrialization as the decline in the manufacturing share of total employment, we find that North-South manufacturing trade expansion is estimated to account for just over one-fifth of the 5.3 percentage point decline in this measure for our ten countries taken together. This is similar to estimates from other studies
(Saeger 1997; Rowthorn and Ramaswamy 1999).
The industry-level results reveal three factors contributing to manu- facturing employment losses in our ten countries as a result of North- South trade of manufactures. First, there are large losses in labor- intensive industries, particularly textiles, apparel, leather and leather goods. Second, there are large losses in industries producing electronic equipment and motor vehicles, industries that were strategically targeted by developing-country industrial policies. Third, rather than a scenario of winning and losing industries, we find employment losses in 20 of 22 manufacturing industries. This result is contrary to the popular view that trade has resulted in winning and losing sectors in Northern manu- factures. This pattern of across-the-board employment losses from trade 9 A similar argument is found in UNCTAD (1995).
with the South is not the result of surging imports from low-wage devel- oping countries, but from the decline in exports to these markets in the aftermath of their debt crises in the 1980s. This suggests the importance of situating the debates on North-South trade and deindustrialization in a broader macroeconomic context.
The macroeconomic context is relevant in several other ways. Defin- ing deindustrialization as the decline in manufacturing employment relative to total employment, for instance, we see this is driven consider- ably more by the 41.6 increase in total employment than the 6.2 million decrease in manufacturing employment for our ten countries over the period. It was also noted that for three of the countries experiencing the most rapid deindustrialization - Australia, Canada and the US - this resulted from comparatively rapid increases in total employment rather than comparatively rapid decreases in manufacturing employment.
There is another sense in which the macroeconomic context is rele- vant to these debates. Public concern with the deindustrializing effects of trade, so prominent in the 1980s and early 1990s, largely died out in the late 1990s. This was certainly not due to a slowdown in imports from developing countries to developed country markets during this period. On the contrary, developing countries attained an acceleration of import penetration. But this occurred during the long period of eco- nomic expansion in the 1990s and especially the impressive growth of employment in the US. During periods of more rapid aggregate demand (and wage) growth in developed countries, low-wage import competi- tion is hardly noticed. It is when aggregate demand growth is slow that low-wage competition from abroad becomes central to policy debates in industrialized countries. 1° Today, with economic growth having slowed in the US and other industrialized countries, the issue of trade and deindustrialization may return to the center of policy discussions.
Appendix: Data Notes
This study makes use OECD's STAN Structural Analysis databases, the Input- Output Database (1995) for input-output data, the Bilateral Trade Database (1998a) for trade data, and the STAN Database for Industrial Analysis (1998b) for output, total employment, and price deflator data (the last derived from
Kucera/Milberg: Deindustrialization and Changes in Manufacturing Trade 623 data on value added in real and nominal terms). These datasets have the ad- vantage of being largely standardized by industry classification, following what the OECD calls an "Adjusted ISIC Revision 2 Classification;' for which there are 22 distinct manufacturing industries.
The OECD Input-Output Database provides data only for the ten coun- tries considered in this paper. Input-output data for the most recent year avail- able are used. For Australia, Denmark, Germany, and the Netherlands, input- output data do not perfectly conform to the "Adjusted ISIC Revision 2 Clas- sification)' Thus data from the STAN Database for Industrial Analysis and Bi- lateral Trade Database are modified to match the input-output data for these countries whenever feasible. For Australia, ISIC 3832 also includes ISIC 3825; for Denmark, ISIC 382 - 3825 also includes ISIC 3825 and ISIC 3843 also in- cludes 3842 + 44 + 49 and 3845 (where " - " indicates "minus" not "through"); for Germany, ISIC 351 + 352 also includes ISIC 3522 and ISIC 383 - 3832 also includes ISIC 3832 (ISIC 3842 + 44 + 49 is omitted, as input-output data for it is spread among industries in such a way that a correction is not feasible); for the Netherlands, ISIC 371 also includes ISIC 372 and ISIC 383 - 3832 also includes ISIC 3832.
Regarding the definition of the OECD and non OECD regions in the Bilat- eral Trade Database, the data documentation states: "The relatively new OECD member countries (Czech Republic, Hungary, South Korea, Mexico, and Poland) are currently included in the Non-OECD" region.
Whenever possible, the analysis uses data from 1978 to 1995. As a result of missing employment and production data, however, the analysis runs only to 1992 for Australia and 1994 for Denmark, Italy, and the UK. For Germany (that is, the former West Germany), trade data include regions of the former East Germany after 1990, and thus the analysis runs only to 1990. In add- ition, employment data in Australia for ISIC 3845 run begin in only 1981; employment data in Japan for ISIC 3842 + 44 + 49 and ISIC 3825 begin in only 1984. Thus other data for these industries in these two countries is also truncated to match the shorter period. Employment and production data for ISIC 3842 + 44 + 49 are missing for all years for Australia, Canada, Denmark, the Netherlands, and the US; employment and production data for ISIC 3845 are missing for all years for Denmark. These industries in these countries are thus excluded from the analysis.
References
Krugman, R (1996). Domestic Distortions and the Deindustrialization Hy- pothesis. NBER Working Paper 5473. National Bureau of Economic Re- search, Cambridge, Mass.
Krugman, R, and R. Lawrence (1996). Trade, Jobs and Wages. In R Krugman (ed.), Pop Internationalism. Cambridge, Mass.: MIT Press.
Kucera, D., and W. Milberg (2000). Gender Segregation and Gender Bias in Manufacturing Trade Expansion: Revisiting the 'Wood Asymmetry'. World Development 28 (7): 1191-1210.
Lee, J. (1995). Comparative Advantage in Manufacturing as a Determinant of Industrialization: The Korean Case. World Development 23 (7): 1194-1214. OECD (1995). Input-Output Database. Paris.
OECD (1998a). Bilateral Trade Database. Paris.
OECD (1998b). STAN Database for Industrial Analysis. Paris. OECD (1999). Economic Outlook. July. Paris.
Rowthorn, R., and R. Ramaswamy (1999). Growth, Trade and Deindustrializa- tion. IMF Staff Papers 46 (1): 18-32.
Sachs, J., and H. Shatz (1994). Trade and Jobs in US Manufacturing. Brookings Papers in Economic Activity (1): 1-84.
Saeger, S. (1997). Globalization and Deindustrialization: Myth and Reality in the OECD. Weltwirtschaftliches Archly~Review of World Economics 133 (4): 579-607.
UNCTAD (1995). Trade and Development Report. Geneva: United Nations. Wood, A. (1991). How Much Does Trade with the South Affect Workers in the
North? The World Bank Research Observer 6 (1): 19-36.
Wood, A. (1994). North-South Trade, Employment and Inequality: Changing Fortunes in a Skill-Driven World. Oxford: Clarendon Press.
Wood, A. (1995). How Trade Hurt Unskilled Workers. Journal of Economic Perspectives 9 (3): 57-80.