Supplementary Information
Biodistribution of single and aggregated gold
nanoparticles exposed to the human epithelial
tissue barrier at the air-liquid interface
AUTHOR NAMES
Estelle Durantie
1, Dimitri Vanhecke
1, Laura Rodriguez-Lorenzo
1, Flavien Delhaes
1, Sandor
Balog
1, Dedy Septiadi
1, Joel Bourquin
1, Alke Petri-Fink
1,2, Barbara Rothen-Rutishauser
1*
1. Processing and Analysis of the TEM images
1.1. Single AuNPs
Single AuNPs images processing steps was performed as depicted in Fig. S1. Analyze particles measurements gave the number of particles, the diameter (major) and the area.
1.2. Aggregated AuNPs
1.2.1. Number of aggregated AuNPs
To count the number of aggregated AuNPs, images processing steps was performed as depicted in Fig. S2
.
1.2.2. Area of aggregated AuNPs
To determine the surface area of aggregated AuNPs, images processing steps was performed as depicted in Fig. S3 starting from the dilation selection showed in Fig. S2.
Start Image
Treshold
Watershed
Analyze Particles
Fig. S1 Process analysis of single AuNPs images
Start Image Threshold Dilation 3 Dilation Selection
Fig. S2 Process analysis of aggregated AuNPs images to count the number of aggregated AuNPs
Overlay dilation selection with original Threshold
Shrink selection
over original Threshold Fill Selection Dilation Selection
1.2.3. Number of single AuNPs particle per aggregate
Transmission electron microscopy provides sufficient resolution to count single AuNPs, but delivers only 2D projections and no 3D data. This leads to possible bias when assessing particle numbers from micrographs, since particles within the aggregates may overlap.
If no particles are overlapping then the surface area of the projected shadow of an aggregate (A) is a function of the number of particles in the aggregate (N) and their radius (𝑟̅). Since the single particle analysis gave fairly monodispersed nanoparticles (average radius, 8.4 nm), the radius can be declared as a constant.
𝑁 =𝜋 ∙ 𝑟̅𝐴2 Equation (1)
If particles are overlapping in the projection, then the estimated number of particles will be lower than the actual number of particles in the aggregate.
In order to estimate this bias (𝜉), a sample of 48 randomly chosen aggregates was reconstructed in three dimensions by electron tomography and counted their exact particle numbers. Since the 3rd dimension was reconstructed, overlapping particles could be detected. In parallel we estimated the number of particles based on the projection area of each aggregate. These calculations were run on the sample obtained after aerosolization of the aggregated AuNPs at the highest concentration of 0.50 mg/mL, as it is the sample showing the most overlapping and so the higher risk of biased results.
1.3. Number of single and aggregated AuNPs
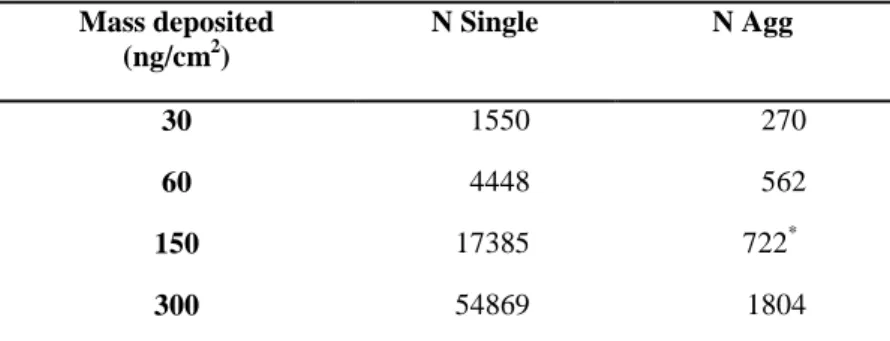
Table S1 Number of particles (N) measured for characterization of the deposition Mass deposited (ng/cm2) N Single N Agg 30 1550 270 60 4448 562 150 17385 722* 300 54869 1804 *
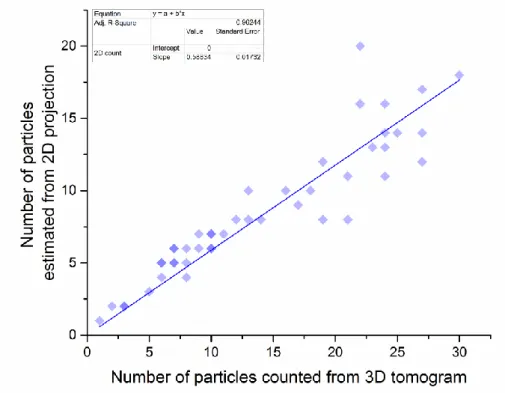
Fig. S4 Number of particles per aggregate, estimation of the bias using a 2D projection.
The results show that the actual number of particles and the estimated number of particles from 2D projections correlate in a linear way. Regression analysis (least squares) yield a slope of about 0.59, i.e. the number of particles estimated from the projected area is an underestimation of about 41%. A hetereoscedastic effect makes the prediction at larger aggregates increasingly imprecise.
𝑁̂ =1𝜉∙𝜋 ∙ 𝑟̅𝐴2 Equation (2)
When correcting the number of particles estimated from 2D micrographs with this factor, no significant difference could be found between the actually counted and estimated number of particles.
2. Characterization of single and aggregated AuNPs suspension
2.1. TEM
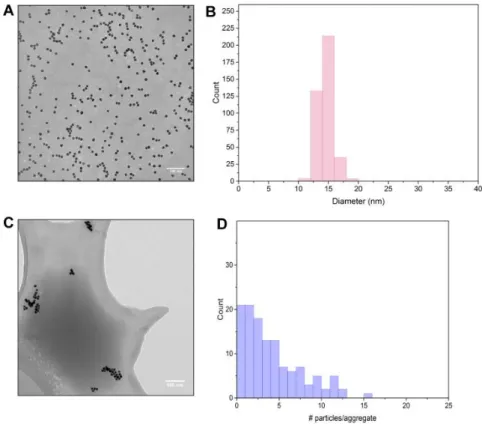
Fig. S5 TEM characterization of single and aggregated AuNPs in suspension: A. TEM image of single AuNPs. B. Size distribution of single AuNPs expressed as diameter (nm) (Major), N=390. C. cryo-TEM image of
aggregated AuNPs. D. Size distribution of aggregated AuNPs expressed in number of particles per aggregate, N=110.
2.2. Zeta Potential
Table S2 Zeta Potential of single and aggregated AuNPs
Single AuNPs Aggregated AuNPs
Zeta Potential (mV) + 3.6 + 29.0
Note: Even if zeta potential is different in the two systems, the number of amines in the polymer coating of the single and aggregated AuNPs was equal. The difference in zeta potential could be explained by a difference in the polymer conformation due to the difference of pH during AuNPs polymer coating.
3. Aerosolized aggregated AuNPs
The number of particles per aggregates was determined by application of the equation (2) to the surface area of the aggregate as detailed above.
Fig. S6 Number of particles per aggregates in the aggregated AuNPs suspension (cryo-TEM) or after
nebulization at the different concentration. Horizontal line represents the mean value, whisker represents the range within 1.5 interquartile range.
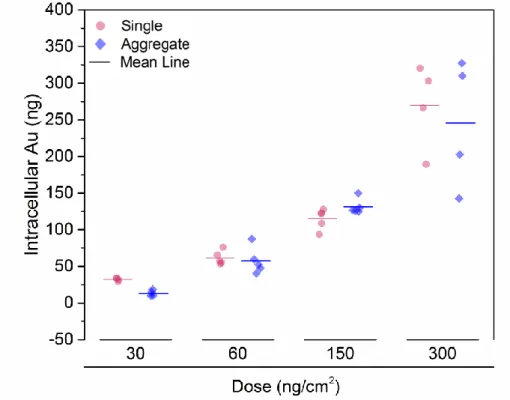
4. Intracellular amount of gold
The intracellular amount of gold 24 h post-exposure to single and aggregated AuNPs at different doses was determined by ICP-OES.
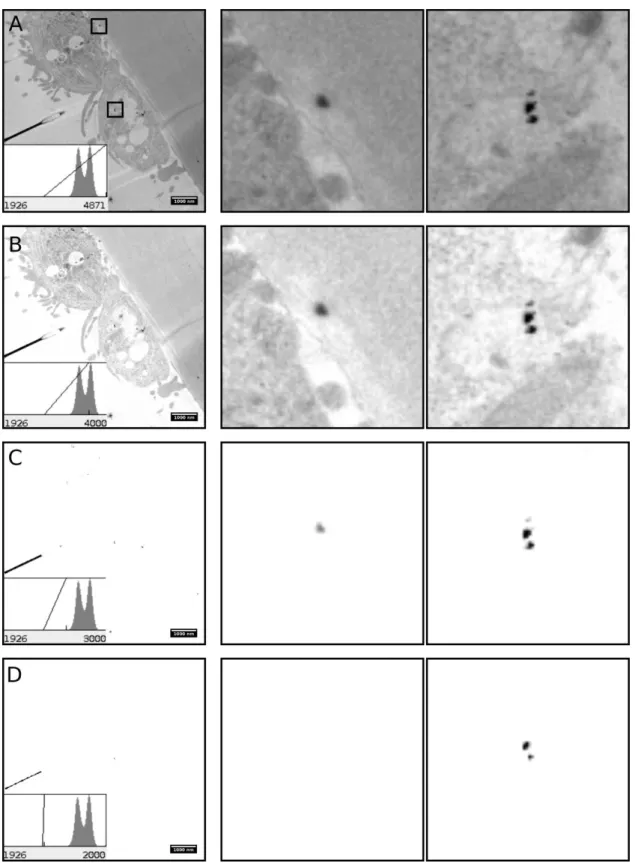
5. Cellular localization of AuNPs
To avoid any misinterpretation in the TEM images of cell cultures exposed to single and aggregated AuNPs in Fig. 6, only areas zoomed in contain AuNPs. Other dark spots in the images are not AuNPs and might originate from lead citrate staining. A histogram analysis of Fig. 6d is presented.