Measurement of Plasma
Endothelin-1 in Experimental
Hypertension and in Healthy Subjects
Saad Abdel-Sayed, Juerg Nussberger, Jean-Franc¸ois Aubert,
Peter Gohlke, Hans Rudolf Brunner, and Noureddine Brakch
Background: Endothelin-1 is an endothelium-derived
potent vasoconstrictor peptide of 21 amino acids. To es-tablish reference values in different models of hyperten-sion and in human subjects an assay for plasma immunoreactive endothelin-1 (ET-1) was optimized.
Methods: ET-1 is extracted by acetone from 1 mL of
plasma and subjected to a sensitive enzyme-linked immu-nosorbent assay.
Results: The detection limit for plasma ET-1 is 0.05
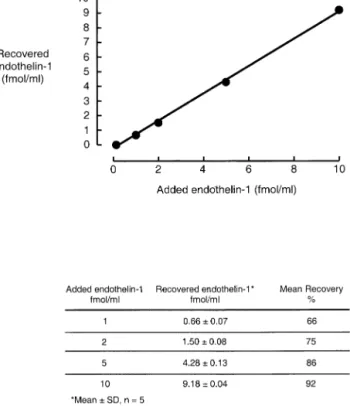
fmol/mL. Mean recoveries of the 1, 2, 5, and 10 fmol of ET-1 added to 1 mL of plasma were 66%, 75%, 85%, and 92%, respectively. Within- and between-assay coefficients of variation wereⱕ12% and ⱕ10%, respectively. Assay accuracy was demonstrated by consistent recoveries of added ET-1 over the entire physiologic range of plasma concentrations and by the linearity of ET-1 concentrations measured in serially diluted plasma extracts (r⫽ 0.99). No ET-1 was detected when albumin buffer was extracted
instead of plasma. Using this method, we found increased ET-1 levels in plasma of three experimental rat models of hypertension: stroke prone spontaneously hypertensive rats (SP-SHR), deoxycorticosterone acetate-salt hyperten-sive rats, and one kidney-one clip hypertenhyperten-sive rats. In contrast, plasma ET-1 levels of SHR were half those of normotensive Wistar rats. In two kidney-one clip hyper-tensive rats, plasma ET-1 concentrations were not different from those found in sham-operated control rats. Plasma ET-1 concentrations of 37 healthy men were 0.85⫾ 0.26 fmol/ml (mean⫾ SD).
Conclusions: The present assay reliably measures
ET-1 levels in rat and human plasma. It allows to discrim-inate between different forms of hypertension with high or low circulating levels of ET-1. Am J Hypertens 2003;16: 515–521 © 2003 American Journal of Hypertension, Ltd.
Key Words: Endothelin, renovascular hypertension,
DOCA-salt, enzyme-linked immunoassay.
T
he endothelins are a family of 21-amino-acid pep-tides with vasoactive, inotropic, and mitogenic properties. At present, three isopeptides, endothe-lin-1, endothelin-2, and endothelin-3, each with distinct genes and distributions in tissues, have been identified.1 Endothelin-1 appears to be the predominant isoform pro-duced by the vascular endothelium; it acts mainly in a paracrine fashion on vascular smooth muscle cells where it causes long-lasting vasoconstriction.2Recent research has accumulated evidence for the clin-ical implications of endothelin. Plasma immunoreactive endothelin-1 (ET-1) concentrations have been shown to be of prognostic value in heart failure3and acute myocardial infarction.4 Moreover, ET-1 has been suggested to be a marker for early reocclusion after percutaneous
translumi-nal coronary angioplasty,5 for coronary arteriosclerosis and coronary endothelial dysfunction,6for liver damage,7 and declining renal function.8High plasma levels of ET-1 have been reported in different states of ischemia,9 hemo-dialysis, and essential hypertension.10 Elevated ET-1 has also been demonstrated during cardiac, liver, renal, and bone marrow transplantation.11,12 A significant role of ET-1 in the pathogenesis of cancer has recently been suggested.13
Normal plasma concentrations of ET-1 are in the low picomolar range.14 –17Sensitive methods are needed for ac-curate measurement of this plasma peptide and for determi-nation of differences in circulating levels of ET-1 in different physiologic and pathophysiologic states. The exclusion of cross-reacting material and related precursor or metabolite Received January 10, 2003. First decision February 27, 2003. Accepted
March 20, 2003.
From the Division of Hypertension and Vascular Medicine (SA-S, JN, J-FA, HRB, NB), University Hospital Lausanne Lausanne, Switzerland, and Institute of Pharmacology (PG), University Hospital of Schleswig-Hol-stein, Kiel, Germany.
This work was supported by the Cardiovascular Research Foundation Lausanne, Switzerland.
Address correspondence and reprint requests to Dr. Juerg Nussberger, Hypertension Division, CHUV, CH-1011 Lausanne, Switzerland; e-mail: juerg.nussberger@chuv.hospvd.ch
0895-7061/03/$30.00 © 2003 by the American Journal of Hypertension, Ltd.
doi:10.1016/S0895-7061(03)00903-8 Published by Elsevier Inc.
endothelin peptides present in plasma is required for specific estimation of ET-1. Reported plasma concentrations of ET-1 in healthy human subjects vary considerably with mean val-ues ranging between 0.1 and 5.0 fmol/mL.3 Even a low detection limit of 0.2 fmol/mL may be insufficient without exclusion of cross-reactions.14 Li et al16 could not find in-creased circulating ET-1 levels in deoxycorticosterone ace-tate-salt hypertensive (DOCA-salt) rats using antibodies cross-reacting with endothelin-3 and big endothelin. Well-performing assays may be challenged because of high normal values if they use SepPak extraction without providing ex-traction blanks, and antisera which cross-react 52% with endothelin-3 and also with big endothelin.17
Careful sample handling to avoid in vitro artifacts and reliable extraction procedures to limit variation of recoveries are key elements required to obtain any meaningful quanti-tation. In the present study, we evaluated and modified a sensitive sandwich-enzyme immunoassay for plasma ET-1 based on commercially available materials. Preliminary ex-periments according to the manufacturer’s protocol had pro-vided unsatisfactory recoveries decreasing from 88% to 30% when 2 and 10 fmol/mL of standard endothelin were added to plasma. Sample handling, extraction procedures, and buffer compositions had to be optimized to obtain reproducible results in the physiologic range. Using the modified new method we measured plasma ET-1 concentrations in normal control rats and in five different models of hypertensive rats (spontaneously hypertensive rats [SHR], stroke prone spon-taneously hypertensive rats [SP-SHR], DOCA-salt, two kid-ney-one clip [2K1C], one kidkid-ney-one clip [1K1C]), as well as in healthy human subjects.
Methods
Blood SamplingFive milliliters of blood were collected from the cubital vein of supine healthy male volunteers. Two milliliters of
blood were collected from the femoral artery of conscious rats through an indwelling catheter. Blood was immedi-ately transferred into prechilled glass tubes (ice bath) containing 0.054 mL of 15% tripotassium EDTA to achieve a final plasma concentration of 7 mmol/L. Blood was centrifuged at 4°C for 10 min at 1660 g. Plasma aliquots of 1.2 mL were stored in polypropylene tubes at ⫺20°C.
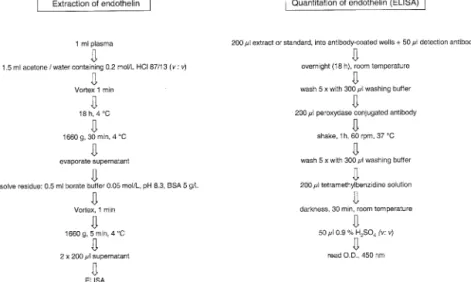
Extraction of ET-1 From Plasma
Endothelin is extracted from plasma as summarized in Fig. 1 (left panel). To 1 mL of plasma rapidly thawed under cold water stream we add 1.5 mL of acetone/0.2 mol/L HCl (87/13, v/v). After vigorous mixing for 1 min at room temperature, the mixture is kept at 4°C for 18 h and subsequently centrifuged at 1660 g for 30 min at 4°C. The supernatant is dried under vacuum (Speed Vac, Savant, Basel, Switzerland) and the dry extract is redissolved in 0.5 mL of borate buffer (0.05 mol/L, pH 8.3) containing bovine serum albumin (Sigma, Buchs, Switzerland) at 5 g/L. Samples are vigorously vortexed for 1 min at room temperature and subsequently centrifuged at 1660 g for 5 min at 4°C. Two aliquots of 200L of supernatant (du-plicates) are subjected to quantitative enzyme-linked im-munosorbent assay (ELISA).
ELISA
The quantitation of ET-1 is performed according to the protocol of the provider of the materials (Biomedica, Vi-enna, Austria) using duplicate samples of 200 L of plasma extract or standard ET-1 (Bachem, Bubendorf, Switzerland) in assay buffer (Fig. 1, right panel). The assay buffer is a 0.05-mol/L borate buffer at pH 8.3, containing 0.26 mol/L sodium chloride, 5 g/L bovine serum albumin, 0.2 g/L sodium azide, and 5% (v/v) Triton X-100. The 200L extract or standard samples are
pipet-FIG. 1. Left panel) Procedure of liquid phase extraction of endothelins from plasma before measurement of endothelin-1 by enzyme-linked
ted into the wells of a microtiter plate precoated with polyclonal capture antibody recognizing the carboxyl end of endothelin but excluding big endothelin (⬍0.001% cross-reaction). Fifty microliters of monoclonal detection antibody recognizing specifically (amino-terminal) endo-thelin-1 (and endothelin-2, but excluding endothelin-3) are dissolved in borate buffer and added to all wells. The microtiter plate is covered with plastic film and incubated overnight (18 h) at room temperature. The contents of the wells are discarded and the wells washed five times with 300L washing buffer (0.1 mol/L phosphate, 0.1% [v/v] Twin-20). Two hundred microliters of peroxydase conju-gated third antibody (rabbit antimouse Fc) are added and the microtiter plate is incubated under orbital shaking for 1 h at 37°C. Unbound conjugated antibody is then re-moved and the wells are washed five times. Two hundred microliters of tetramethylbenzidine substrate solution are added and the microtiter plate is incubated in the dark at room temperature for 30 min. Stop solution consisting of 50L of 0.9% (v/v) sulfuric acid is added and the absor-bance measured immediately at 450 nm with an ELISA reader (Molecular Devices, Basel, Switzerland).
Assay Characteristics
Recovery Recoveries were determined by spiking nor-mal human plasma with different amounts of exogenous endothelin-1. Before acetone extraction, 0, 1, 2, 5, or 10 fmol (n⫽ 5 each) of exogenous endothelin-1 (Bachem) in borate buffer was added to 1-mL aliquots of plasma of one volunteer. The endogenous concentration of ET-1 (mean ⫾ SD) was 0.84 ⫾ 0.10 fmol/mL. The difference between total ET-1 and endogenous ET-1 was expressed as a percentage of the added (exogenous) endothelin-1. All results reported here are not corrected for recovery losses.
Precision and Accuracy Imprecision was defined by the coefficient of variation (CV). Within-assay precision was determined by seven repeated measurements within the same assay. The between-assay CV were determined by measuring the endothelin-1 concentration of two hu-man plasmas in consecutive assays (n ⫽ 7 and 8). The
specificity of the assay was tested by establishing standard
curves with synthetic pure endothelin peptides (Bachem) in buffer (endothelin-1, endothelin-2, endothelin-3, big endothelin-1); cross-reaction was defined as the ratio be-tween concentrations of endothelin-1 and the analog en-dothelin providing identical optical densities. Possible interference caused by the extraction procedure was inves-tigated by analyzing extracts of the borate buffer for ET-1 (buffer blank; n⫽ 2). The absence of nonspecific interfer-ence in the ELISA was determined by serial dilution of plasma extracts with borate buffer.
Normal Human Values Plasma ET-1 was measured in 37 healthy men in the supine position. The subjects were 20 to 35 years old.
Experimental Animals
Male Wistar rats and SHR of 8 weeks of age weighing 220 to 246 g were purchased from Iffa Credo (L’Arbresle, France) and SP-SHR were from the Institute of Pharma-cology in Kiel (Germany). Rats were housed in transparent plastic cages in a quiet room at 22°C and maintained on standard rat chow containing 0.22% sodium and 0.20% potassium and tap water ad libitum. The Institutional An-imal Care Committee approved the study protocols.
Twenty-four hours before blood sampling, rats were anesthetized by inhalation of 2% halothane in oxygen. Polyethylene (PE) catheters, consisting of PE-10 intravas-cular segments welded to PE-50 tubing were inserted into right femoral arteries for arterial blood pressure measure-ments and blood sampling. The PE-50 tubing were threaded under the skin and exteriorized at the back of the neck. The rats were housed individually in plastic cages and kept in a quiet place at 22°C.
On the study day, conscious rats were placed in a plastic tube for partial immobilization. Mean arterial pres-sure and heart rate were monitored after 20 min of rest, using the Notocord computerized system (Paris, France). Then 2 mL of arterial blood was collected and plasma was stored as described.
2K1C Hypertension Male 6-week-old Wistar rats weighing 160 to 170 g (n⫽ 15) were anesthetized using 2% halothane in oxygen. An incision was made in the left abdomen, the left renal artery was isolated, and a Plexiglas clip (0.20 mm gap) was placed around the left renal artery (2K1C, n⫽ 7). In control rats, the clip was subsequently removed (sham-operated, n ⫽ 8). After a 3-week obser-vation period, mean arterial blood pressure was measured and blood samples were collected.
1K1C Hypertension Male 6-week-old Wistar rats weighing 170 to180 g were used. To induce 1K1C hyper-tension (n⫽ 9), a right nephrectomy was performed. The left renal artery was clipped as described previously. Con-trol rats were prepared by performing a unilateral nephrec-tomy (sham-operated, n⫽ 10). After a 3-week observation period, mean arterial blood pressure was measured and blood samples were collected.
DOCA-Salt Hypertension Male 6-week-old Wistar rats weighing 170 to 180 g (n⫽ 9) were uninephrecto-mized under 2% halothane in oxygen anesthesia. A sili-cone tube (Cole-Parmer Instrument Co., Vernon Hills, IL) was prepared according to Wang et al,18(28 mm length, 4 mm external diameter, 2.3 mm internal diameter; with 10 to 14 micropores of nearly 300m diameter on the wall). Each tube was filled with 80 mg of DOCA powder (Sigma Chemical Co., St. Louis, MO) and a silicone tubing of 2 mm in length was inserted into each end of the DOCA tube to keep the powder confined to the tube. This stopper tubing had an external diameter of 2.3 mm and an internal
diameter of 0.8 mm. One DOCA tube was implanted subcutaneously to each rat. They received 1% saline to drink. Rats became hypertensive and were studied 6 weeks after implanting the tubes. Uninephrectomized rats receiv-ing tap water served as controls (n⫽ 9).
Statistical Analysis
Results are presented as means⫾ SD unless stated other-wise. Regression analysis was calculated by the method of least squares. Correlation coefficients for linear regression are presented. The unpaired Student t test was used to compare hypertensive rats with the controls. The signifi-cance level was P⬍ .05.
Results
Characteristics of Endothelin Assay
Fig. 2 shows the recoveries for acetone extraction of ET-1 from 1 mL of human plasma (mean ⫾ SD, n ⫽ 5). Unspiked plasma contained 0.84⫾ 0.10 fmol/mL ET-1 (n ⫽ 7). The mean recoveries were 66%, 76%, 86%, and 92% for added ET-1 at 1, 2, 5, and 10 fmol/mL, respec-tively. With increasing ET-1 content of the plasma, the precision of the measured ET-1 concentration increased.
Table 1 presents the within-assay coefficients of varia-tion for multiple ET-1 measurements of five different plasmas with ET-1 concentrations ranging from⬍1 to 10
FIG. 2. Recovery of increasing amounts of endothelin-1 added to
plasma. One milliliter of human plasma containing 0.84 fmol of endogenous immunoreactive endothelin-1 was spiked with 0, 1, 2, 5, and 10 fmol of synthetic endothelin-1. Measured peptide concen-trations are plotted after subtraction of endogenous endothelin-1. Standard deviations were smaller than the size of the symbols.
Table 1. Within-assay coefficient of variation for increasing plasma ET-1 concentrations
ET-1 (fmol/mL)* n CV% 0.84⫾ 0.10 7 11.9 1.49⫾ 0.07 5 4.7 2.33⫾ 0.08 5 3.4 5.17⫾ 0.13 5 2.5 9.94⫾ 0.05 5 0.5
ET-1⫽ immunoreactive endothelin-1; CV ⫽ coefficient of variation. * Mean⫾ SD.
Table 2. Between-assay coefficient of variation for two human plasmas
ET-1 (fmol/mL)* n CV %
1.02⫾ 0.08 8 7.8
1.22⫾ 0.12 7 9.8
Abbreviations as in Table 1. * Mean⫾ SD.
FIG. 3. Linearity of extract dilution. Endothelin was extracted from
two different human plasmas (upper and lower panels) and ex-tracts were serially diluted before measurement of immunoreactive endothelin-1 (ET-1) concentrations. The linearity of results ex-cludes cross-reacting interferences.
fmol/mL. These CV decreased with increasing concentra-tions of ET-1 from 11.9% to 0.5%.
The between-assay coefficients of variation for two human plasma samples are depicted in Table 2. They are situated at 7.8% and 9.8%.
The detection limit was defined as the ET-1 content read on the standard slope at three standard deviations above the optical density found in the absence of ET-1. The detection limit of the assay for 1 mL of plasma was 0.05 fmol/mL.
Assay accuracy is demonstrated by the close linear relationship between ET-1 added to and recovered from plasma (y⫽ 0.93x ⫺ 0.24, r ⫽ 0.99; Fig. 2) and by the linearity of ET-1 concentrations measured in two different serially diluted plasma extracts (Fig. 3) Taking the reac-tion with ET-1 as 1.00, the cross-reacreac-tions with big ET-1, with ET-2 and with ET-3 were 0.000006, 1.020, and 0.048, respectively. No ET-1-like material was detected when the albumin-containing borate buffer was extracted instead of plasma.
Plasma levels of ET-1 in normal human subjects were 0.85⫾ 0.30 fmol/mL (mean ⫾ SD, n ⫽ 37), ranging from 0.37 to 1.57 fmol/mL.
Rat Hypertension Models
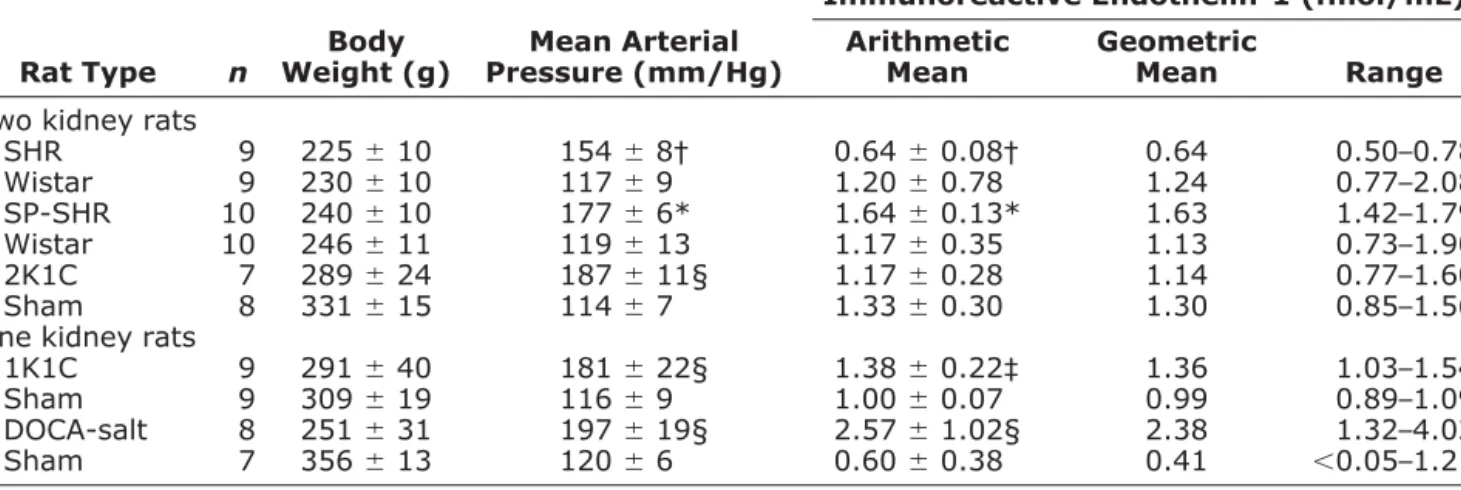
Table 3 shows plasma ET-1 concentrations as well as weight and mean arterial pressure of normotensive Wistar rats and of five different rat models of hypertension. Nor-motensive Wistar rats had plasma ET-1 levels of 0.7 to 2.1 fmol/mL. In SHR, plasma ET-1 levels were lower (P⬍ .01) and in SP-SHR, they were higher than in normoten-sive Wistar rats (P⬍ .001). Fig. 4 depicts blood pressure and plasma ET-1 levels in surgically induced models of hypertension. In hypertensive 1K1C rats, mean plasma ET-1 was increased 32% compared to sham-operated uni-nephrectomized rats (P⬍ .002). The equally hypertensive 2K1C rats had plasma ET-1 levels that where not different
from their controls but tended to be decreased (⫺11%; P ⫽ not significant). The DOCA-salt hypertensive rats ex-hibited 3.6-fold higher circulating ET-1 than normotensive uninephrectomized controls (P⬍ .001).
Discussion
Among the circulating endothelins, their precursors, and metabolites, the 21-amino-acid vasoconstrictor isopeptide endothelin-1 appears to play a predominant role.2 Its plasma concentrations in the low picomolar range require careful sample handling to avoid in vitro generation or metabolization of the peptide, as well as a reliable extrac-tion technique and sensitive methods to quantitate. Unlike its original commercial protocol, the modified assay de-scribed here fulfills these requirements. It enables accurate measurement of human plasma levels and allows to dem-onstrate differences in circulating ET-1 between various rat models of hypertension.
From 1 milliliter of EDTA–plasma endothelins are extracted into cold acetone during an extended (18 h) period, whereas proteins and enzymes generating or me-tabolizing ET-1 are precipitated. The procedure is charac-terized by reasonably low CV and ⬎50% recoveries of physiologic plasma ET-1 concentrations. For higher plasma ET-1 concentrations, mean recoveries are further increased and the CV become very small (Table 1).
The specificity of our ET-1 measurement is provided by the sandwich-type immunoassay. The capture antibody excludes big endothelins, and the detection antibody hardly recognizes endothelin-3 (5% cross-reaction), which only rep-resents 10% of circulating endothelins; the fully cross-react-ing endothelin-2 is virtually absent in plasma.19 –22 The absence of any interference is also confirmed by linearity of measured ET-1 levels in serially diluted plasma extract (Fig. 3), because any cross-reacting material would disturb the
Table 3. Plasma immunoreactive endothelin-1 in different rat models of hypertension (mean⫾ SD)
Rat Type n
Body Weight (g)
Mean Arterial Pressure (mm/Hg)
Immunoreactive Endothelin-1 (fmol/mL) Arithmetic
Mean
Geometric
Mean Range
Two kidney rats
SHR 9 225⫾ 10 154⫾ 8† 0.64⫾ 0.08† 0.64 0.50–0.78 Wistar 9 230⫾ 10 117⫾ 9 1.20⫾ 0.78 1.24 0.77–2.08 SP-SHR 10 240⫾ 10 177⫾ 6* 1.64⫾ 0.13* 1.63 1.42–1.79 Wistar 10 246⫾ 11 119⫾ 13 1.17⫾ 0.35 1.13 0.73–1.90 2K1C 7 289⫾ 24 187⫾ 11§ 1.17⫾ 0.28 1.14 0.77–1.60 Sham 8 331⫾ 15 114⫾ 7 1.33⫾ 0.30 1.30 0.85–1.56 One kidney rats
1K1C 9 291⫾ 40 181⫾ 22§ 1.38⫾ 0.22‡ 1.36 1.03–1.54 Sham 9 309⫾ 19 116⫾ 9 1.00⫾ 0.07 0.99 0.89–1.09 DOCA-salt 8 251⫾ 31 197⫾ 19§ 2.57⫾ 1.02§ 2.38 1.32–4.02 Sham 7 356⫾ 13 120⫾ 6 0.60⫾ 0.38 0.41 ⬍0.05–1.21
SHR⫽ spontaneously hypertensive rats; SP-SHR ⫽ stroke prone-spontaneously hypertensive rats; 2K1C ⫽ 2 Kidney-1 clip Goldblatt hypertensive rats; 1K1C⫽ 1 Kidney-1 clip hypertensive rats; DOCA-Salt ⫽ deoxycorticosterone acetate/saline rats.
linearity derived from a pure endothelin-1 standard slope.19,21,22
Several findings demonstrate the accuracy of our ET-1 measurement. First, serial dilution of plasma extracts yield perfectly linear endothelin-1 concentrations and the re-gression slopes show practically no y-axis intercept (Fig. 3). This virtually excludes the presence in the assay of any interfering or cross-reacting material. Second, buffer ex-tracts do not contain any ET-1 and thus, exclude blank interference due to extraction or washing procedures. Third, repeat measurements of ET-1 concentrations in different plasmas provide consistent results. Both within-assay and between-within-assay CV are consistently below 12% within the tested range.
The detection limit of the assay for plasma ET-1 is 0.05 fmol/mL. Normal human plasma levels of ET-1 are 0.4 to 1.6 fmol/mL. They are in agreement with low picomolar normal values published by other investigators, who sometimes cor-rected their results for recovery losses.14 –17,23–27Not surpris-ing, among these established assays for ET-1, the highest normal values were measured by assays which also included some cross-reacting big endothelins or endothelin-3; in addi-tion, nonspecific blank interference was never excluded.17,27 Using our assay method, we demonstrate increased ET-1 levels in the plasma of three experimental rat models of hypertension. Plasma ET-1 concentration was higher in SP-SHR than in normotensive Wistar rats, and DOCA-salt hypertensive rats exhibited four times higher ET-1 levels than sham-operated control rats. This contrasts with the findings of Li et al.16 They could not find increased cir-culating ET-1 levels in DOCA-salt rats using antibodies cross-reacting with endothelin-3 and big endothelin.16Our 1K1C hypertensive rats showed a moderate increase in ET-1 levels compared to sham-operated controls (Table 2). In contrast, the ET-1 level in the plasma of SHR was only half the level of normotensive Wistar rats. Schiffrin et al28 did not find such a difference between Wistar and SHR, but they used the SepPak extraction method and antiserum cross-reacting with big endothelin-1 and endo-thelin-3 at 10% and 7%, respectively. In 2K1C Goldblatt hypertensive rats, a renin-dependent model of hypertension, no increase in plasma ET-1 was observed. These findings complement and extend those reported by Schiffrin28,29and Sventek30 and their colleagues. These researchers demon-strated an increased content of ET-1 and of preproendothe-lin-1 mRNA in the vascular wall of SP-SHR, DOCA-salt, and 1K1C hypertensive rats, but not in 2K1C or SHR hyper-tensive rats. Thus, our modified extraction and quantitation procedures of plasma ET-1 made it possible to measure increased plasma ET-1 levels in some forms of hypertension (SP-SHR, DOCA-salt, 1K1C), but not in other forms (2K1C, SHR).
In conclusion, ET-1 concentration in 1 mL of plasma can be reliably measured by acetone extraction and sub-sequent ELISA. Normal plasma ET-1 levels in humans and rats are in the low picomolar range. Significant dif-ferences in plasma ET-1 levels are found in different models of experimental hypertension.
Acknowledgments
We thank Ms. Catherine Amstutz for excellent technical assistance.
References
1. Inoue A, Yanagisawa M, Kimura S, Kasuya Y, Miyauchi T, Goto K, Masaki T: The human endothelin family: Three structurally and pharmacologically distinct isopeptides predicted by three separate genes. Proc Natl Acad Sci U S A 1989;86:2863–2867.
2. Zollman FS, Paul M: Transgenic models for the study of endothelin function in the cardiovascular system. J Cardiovasc Pharmacol 2000;35(Suppl 2):S13–S16.
FIG. 4. Plasma immunoreactive ET-1 levels (upper panel) and
MAP (lower panel) in surgically induced hypertension models. 2K1C ⫽ 2 kidney-1 clip Goldblatt hypertensive rats; 1K1C ⫽ 1 kidney-1 clip hypertensive rats; DOCA-salt⫽ deoxycorticosterone acetate/saline rats; MAP⫽ mean arterial pressure; other abbrevia-tion as in Fig. 3. Open bars represent sham-operated rats. n.s.⫽ not significant; **P⬍ .01; ***P ⬍ .001 v sham-operated rats.
3. Giannessi D, Ry SD, Vitale RL: The role of endothelins and their receptors in heart failure. Pharmacol Res 2001;43:111–126. 4. Omland T, Lie RT, Aakvaag A, Aarsland T, Dickstein K: Plasma
endothelin determination as a prognostic indicator of 1-year mortality after acute myocardial infarction. Circulation 1994;89:1573–1579. 5. Kyriakides ZS, Kremastinos DT, Psychari SN, Kolettis T, Sbarouni
E, Webb DJ: Coronary vasoconstriction after coronary angioplasty is attenuated by endothelin receptor antagonism. Am J Cardiol 2001;87:1011–1013.
6. Lerman A, Holmes DR Jr, Bell MR, Garratt KN, Nishimura RA, Burnett JC Jr: Endothelin in coronary endothelial dysfunction and early atheroscelerosis in humans. Circulation 1995;92:2426 –2431. 7. Matsumoto H, Uemasu J, Kitano M, Kawasaki H: Clinical signifi-cance of plasma endothelin-1 in patients with chronic liver disease. Dig Dis Sci 1994;39:2665–2670.
8. Perico N, Remuzzi G: Role of endothelin in glomerular injury. Kidney Int 1993;39(Suppl):S76 –S80.
9. Ziv I, Fleminger G, Djaldetti R, Achiron A, Melamed E, Sokolovsky M: Increased plasma endothelin-1 in acute ischemic stroke. Stroke 1992;23:1014 –1016.
10. Ergul S, Parish DC, Puett D, Ergul A: Racial differences in plasma endothelin-1 concentrations in individuals with essential hyperten-sion. Hypertension 1996;28:652–655.
11. Watschinger B, Sayegh MH: Endothelin in organ transplantation. Am J Kidney Dis 1996;27:151–161.
12. Cifkova R, Pit’ha J, Trunecka P, Lanska V, Jindra A, Plaskova M, Peterkova L, Hrncarkova H, Horky K: Blood pressure, endothelial function and circulatory endothelin concentrations in liver trans-plant recipients. J Hypertens 2001;19:1359 –1367.
13. Nelson JB, Hedican SP, George DJ, Reddi AH, Piantadosi S, Eisenberger MA, Simons JW: Identification of endothelin-1 in the pathophysiology of metastatic adenocarcinoma of prostate. Nat Med 1995;1:944 –949.
14. Suzuki N, Matsumoto H, Kitada C, Masaki T, Fujino M: A sensitive sandwich-enzyme immunoassay for human endothelin. J Immunol Methods 1989;118:245–250.
15. Letizia C, Cerci S, De Ciocchis A, D’ambrosio C, Scuro I, Scano D: Plasma endothelin-1 levels in normotensive and borderline hyper-tensive subjects during a standard cold pressor test. J Hum Hyper-tens 1995;9:903–907.
16. Li JS, Larivie`re R, Schiffrin ER: Effect of a nonselective endothelin antagonist on vascular remodelling in deoxycorticosterone acetate-salt hypertensive rats. Hypertension 1994;24:183–188.
17. Schneider MP, Hilgers KF, Klingbeil AU, John S, Veelken R,
Schmieder RE: Plasma endothelin is increased in early essential hypertension. Am J Hypertens 2000;13:579 –585.
18. Wang Q, Chen Z, Fan XP, Xu DH, Zhou GH, Liang ZX: A simplified method for preparation of DOCA-salt hypertension model in rats by subcutaneous implantation of DOCA silastic tube. Acta Physiologica Sinica 1994;46:205–208.
19. Khono M, Yasunari K, Murakawa K, Yokokawa K, Horio T, Fukui T, Takeda T: Plasma immuno reactive endothelin in essential hy-pertension. Am J Med 1990;88:614 –618.
20. Matsumoto H, Suzuki N, Kitada C, Fujino M: Endothelin family peptides in human plasma and urine: their molecular forms and concentrations. Peptides 1994;3:505–510.
21. Suzuki N, Matsumoto H, Miyauchi T, Kitada C, Tsuda M, Goto K, Masaki T, Fujino M: Sandwich-enzyme immunoassays for endo-thelin family peptides. J. Cardiovasc Pharmacol 1991;17(Suppl 7): S420 –S422.
22. Godard J, Webb DJ: Plasma endothelin concentrations in hyperten-sion. J Cardiovasc Pharmacol 2000;35(Suppl 2):S25–S31. 23. Becker AJ, Uckert S, Stief CG, Truss MC, Hartmann U, Jonas U:
Systemic and cavernous plasma levels of endothelin (1-21) during different penile conditions in healthy males and patients with erec-tile dysfunction. World J Urol 2001;19:371–376.
24. Haufschild T, Shaw SG, Kesselring J, Flammer J: Increased endo-thelin-1 plasma levels in patients with multiple sclerosis. J Neu-roophthalmol 2001;21:37–38.
25. Blauw GJ, Westendrop RG, Srivastava N, Burggraaf K, Frolich M, Simons R, Cohen AF, Meinders AE: Hypoxia-induced arterial en-dothelin does not influence peripheral vascular tone. J Cardiovasc Pharmacol 1995;26(Suppl 3):S242–S243.
26. Kanai H, Hirakata H, Nakayama M, Nagashima A, Fujishima M: Minimal daily variations of plasma and urinary endothelin-1 in healthy subjects. Clin Nephrol 1996;46:353–354.
27. Elijovich F, Laffer CL, Amador E, Gavras H, Bresnahan MR, Schiffrin ER: Regulation of plasma endothelin by salt in salt-sensitive hypertension. Circulation 2001;103:263–268.
28. Schiffrin EL, Larivie`re R, Li JS, Sventek P, Touyz RM: Deoxycor-ticosterone acetate plus salt induce overexpression of vascular en-dothelin-1 and severe vascular hypertrophy in spontaneously hypertensive rats. Hypertension 1995;25:769 –773.
29. Schiffrin EL: Role of endothelin-1 in hypertension. Hypertension 1999;34:876 –881.
30. Sventek P, Turgeon A, Garcia R, Schiffrin EL: Vascular and cardiac overexpression of endothelin-1 gene in one kidney one clip Gold-blatt hypertension. J Hypertens 1996;14:57–64.