Anal Bioanal Chem (2005) 383: 434–441 DOI 10.1007/s00216-005-0021-x
S P E C I A L I S S U E PA P E R
Hans-Rudolf Kuhn . Detlef Günther
The agglomeration state of nanosecond laser-generated aerosol
particles entering the ICP
Received: 16 March 2005 / Revised: 8 July 2005 / Accepted: 11 July 2005 / Published online: 18 August 2005
# Springer-Verlag 2005
Abstract Fundamental understanding of aerosol forma-tion and particle transport are important aspects of under-standing and improving laser-ablation ICP–MS. To obtain more information about particles entering the ICP, laser aerosols generated under different ablation conditions were collected on membrane filters. The particles and agglom-erates were then visualised using scanning electron micro-scope (SEM) imaging. To determine variations between different sample matrices, opaque (USGS BCR-2G) and transparent (NIST SRM 610) glass, CaF2, and brass (MBH
B26) samples were ablated using two different laser wavelengths, 193 and 266 nm. This study showed that the condensed nano-particles (∼10 nm in diameter) formed by laser ablation reach the ICP as micron-sized agglom-erates; this is apparent from filters which contain only a few well-separated particles and particle agglomerates. Abla-tion experiments on different metals and non-metals show that the structure of the agglomerates is matrix-dependent. Laser aerosols generated from silicates and metals form linear agglomerates whereas particle-agglomerates of ab-lated CaF2have cotton-like structures. Amongst other
con-ditions, this study shows that the absorption characteristics of the sample and the laser wavelength determine the pro-duction of micron-sized spherical particles formed by liq-uid droplet ejection.
Keywords Laser-ablation ICP–MS . Aerosol transport . Particles . Particle agglomeration
Introduction
In laser-ablation inductively coupled plasma mass spec-trometry (LA–ICP–MS), laser-generated aerosol particles are vaporised and ionised in an ICP for mass analysis in the
MS [1]. Because particles larger than a critical size (150 nm for glass [2], depending on the ICP instrumentation and conditions) are not completely vaporised, atomised, and transformed into ions, laser conditions must be optimised so that as few large particles as possible are generated, to avoid ICP-induced element-fractionation effects [3–6]. It is, therefore, of major interest to know more about the structure of the particles before they enter the excitation source. Two main particle-formation mechanisms, leading to small and large aerosol particles, respectively, have been reported in literature. These are discussed below.
During laser ablation, a fraction of the ablated sample is described as being vaporised; this condenses in the de-creasing laser plasma plume to nanometre-sized particles. Theoretical calculations using condensation and nucleation theories predict particle sizes of a few nanometres [7], tens of nanometres [8] or even hundreds of nanometres [8,9], depending on the type of background gas and its pressure. Calculations indicate that particles 3 nm in diameter are formed 100 ns after laser impact [10]. Unfortunately, no further information about the transported particle sizes was presented. Particle diameters of several hundred nano-metres have been described as very unlikely, however, be-cause an unrealistically large number of atomic collisions would be required for the growing process [11]. In general, the higher rate of collision of gas species at ambient pressure would lead to larger condensed particles than condensation under vacuum conditions [12].
Experimentally, condensed silicon particles between 1 and 10 nm, generated by a KrF laser and deposited on TEM grids, have been measured under vacuum condi-tions [13]. Other authors reported glass particles with maximum diameters between 20 and 50 nm [14] when using a 351-nm XeF laser in a vacuum, depending on the laser energy. Most nanometre-sized particles have been measured as agglomerates on TEM grids, but it has not been reported where the agglomeration occurs. Agglom-eration is, however, very likely as soon as the particle number density exceeds a certain value [13]. The particle number density reaches its maximum immediately after condensation and before dilution with the carrier gas. When H.-R. Kuhn . D. Günther (*)
ETH Zurich, Laboratory for Inorganic Chemistry, 8093 Zurich, Switzerland
e-mail: [email protected] Fax: +41-44-6331071
agglomerates are formed it is therefore feasible that ag-glomeration starts within the ablation cell immediately after particle formation.
The second mechanism described for particle generation is direct ejection of droplets from the molten sample sur-face. This is affected by interactive conditions such as laser wavelength, sample absorption [15], and irradiation [16]. At low power densities (<22 GW cm−2 for silicon), but above the ablation threshold, laser-induced photomechan-ical stress leads to ejection of droplets which are up to several microns in diameter [12]. The size and amount of these particles are strongly affected by mechanical and surface properties of the sample. At higher power densities (>22 GW cm−2for silicon), phase explosion or explosive boiling of the molten sample leads to ejection of large par-ticles from the sample [16–18]. On filter-collected aerosol particles of lead, steel, glass, and ceramics [19–21] it has been shown that much of the ablated mass is transported as micron-sized spherical particles. Particle-size measure-ments using different laser wavelengths [22] indicate that the particle-size distribution strongly depends on the wave-length when ablating glass samples.
Particle-size distributions of laser-generated brass aero-sols have been measured using laser-light scattering or particle impaction [6, 23]. Recent studies comparing the aerosols produced by nanosecond and femtosecond laser ablation reported agglomerated nano-particles and single particles up to 200 nm for femtosecond laser pulses [24] whereas particles up to several microns were observed for 266-nm nanosecond laser ablation [23,24]. The SEM image of the largest particle (>2μm) was, however, of in-sufficient resolution for structural conclusions and could also represent agglomerated particles. Furthermore, parti-cles were collected on a silicon surface [24] acting as an impaction plate, and so might not be representative for the overall transported aerosol.
The two mechanisms discussed lead to two mainly independent particle size distributions based on condensed nano-particles or on ejected, solidified droplets. All types of particles are present within the same aerosol.
This study investigated the particle size and structure of the laser-generated aerosols routinely used in LA–ICP– MS, and their dependence on sample matrix, laser wave-length, and carrier gas composition. Another objective was to determine the state of agglomeration of the particles during transport before they enter the ICP. The presence of agglomerates would affect the various techniques used for particle-size determination. Because diffusion losses are more pronounced for very small particles, agglomeration of these particles would enhance the efficiency of transport of the aerosol particles [23].
Experimental
Laser ablation instrumentation
The aerosols investigated were generated using two dif-ferent laser wavelengths. All experiments were performed
using a beam-homogenised 193 nm ArF excimer laser [25] (GeoLas M, MicroLas, Göttingen, Germany) and a 266-nm 4th harmonics Nd:YAG laser (LSX500, Cetac Technolo-gies, Omaha, NE, USA). Power density and spot size were set to 2 GW cm−2and 80μm for the 193 nm laser and to 2 GW cm−2and 100μm for the 266 nm laser, respectively (Table1). Both lasers were operated at a repetition rate of 5 Hz and at power densities similar to those commonly used for LA–ICP–MS.
The samples were placed in a 30 cm3ablation cell, which was flushed with 0.4 L min−1carrier gas. For most experi-ments, helium was selected as the carrier gas; this resulted in higher sensitivity for many ICP–MS instruments for silicate matrices [26,27], because of the enhanced aerosol transport characteristics [6, 23]. Glass aerosols generated under argon atmosphere were also investigated, however, to determine possible variations of the aerosol character-istics. All samples were ablated in the single-hole drilling mode.
Particle filtering procedure
The filter was placed 0.5 m downstream of the ablation cell to collect the aerosol particles. The requirements for the filter material were a flat surface to ensure good visibility of the particles by scanning electron microscopy (SEM) and sufficient gas permeability to minimize carrier gas backpressure in the ablation cell. Membrane filters with a pore size of 400 nm were found to be suitable for the experiments (Isopore Membrane Filters HTTP01300, Millipore, Billerica, MA, USA). Most important, mounting of this type of filter on a conductive carbon tape enables SEM measurements without conductive surface coating. The ICP–MS signal intensities measured online were reduced by more than five orders of magnitude when inserting the filter between ablation cell and the ICP, indicating that most of the aerosol particles were deposited on the filter.
To obtain bulk information about particle sizes, 100 laser pulses were applied. For more detailed particle structures, five laser pulses only were applied to the sample resulting in well-separated particles on the filter surface. Previously published work showed that the amount of small particles remains constant during the first 100 laser pulses [2]. The amount of micron-sized particles decreases significantly within this time period, however, and, therefore, these par-ticles are expected to be more numerous than the small particles when applying only five laser pulses.
Table 1 Experimental conditions
Laser 193 nm (15 ns pulse length), 266 nm (6 ns pulse length)
Power density 2 GW cm−2for both lasers Carrier gas He (normal) or Ar (indicated) Gas flow rate 0.4 L min−1
Samples NIST SRM 610, USGS BCR-2G, Fluorite, B26 brass
SEM instrumentation
SEM images were collected at the microscopy centre at ETH Zurich with a Zeiss Gemini 1530 FEG instrument (Carl Zeiss, Germany) using a zirconated tungsten emitter and secondary electron detection (SE+ detector). A low acceleration voltage of 1 kV was used to reduce surface charging effects, which slightly reduced image resolution.
Samples
A NIST (National Institute of Standards and Technology, USA) standard reference material (SRM) 610 glass was selected as a sample for this study, because it is one of the calibration standards most frequently used for quantitative analysis in LA–ICP–MS [1]. The aerosol particle structure of this material is therefore of particular interest. Other matrices including metals and non-metals were also inves-tigated. Fluorite (CaF2) was selected because of its low
absorptivity and was compared with the high-absorbing USGS BCR-2G (Columbia River Basalt, US Geological Survey, USA) basaltic glass standard [28]. A brass sample (B26, MBH Analytical, UK; Cu/Zn=2.10) was selected as a metal sample. All non-metals were pre-ablated with five laser pulses, because these pulses have been shown to be not representative for chemical analysis [29].
Results and discussion
Aerosol structure of NIST SRM 610 after laser ablation
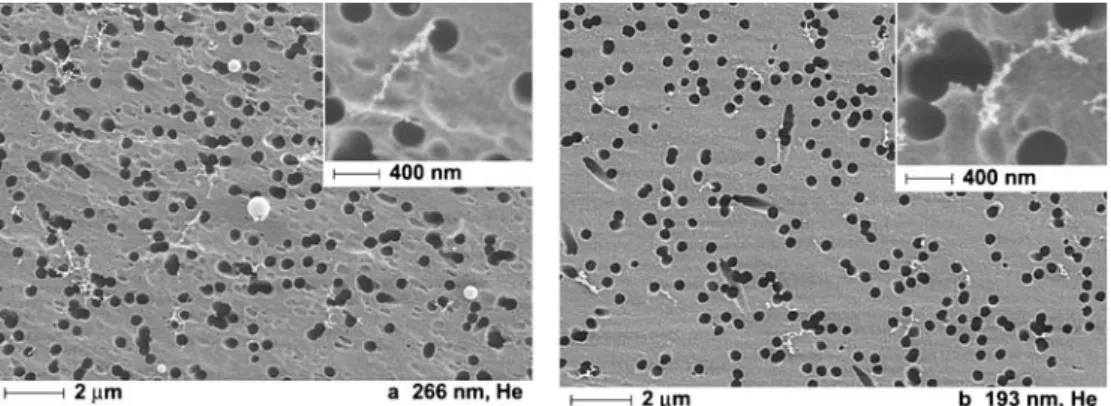
An experiment was designed to gain an overview of an NIST SRM 610 aerosol generated by using two different laser wavelengths. Particles from 100 ablation pulses were collected on filters to determine the overall size and shape of the aerosol particles. The particles were not fully ran-domly distributed on the filter surface, possibly because of variation of the gas permeability of the filter surface. The absolute particle numbers and the particle size-related mass could not, therefore, be directly correlated with the number of laser pulses. Despite this, the images shown in Fig. 1
provide evidence of two fundamentally different particle-generation mechanisms. For both laser wavelengths, a grid-like structure of particles smaller than approximately 10 nm was observed on the filter surface. Condensation from the vapour phase is the most probable origin of these particles. Ten nanometres is in the low region of the size range expected for vapour-condensed particles [7–14]. In addi-tion to condensed vapour, direct ejecaddi-tion of droplets has been predicted and shown in literature to be a second mechanism of aerosol generation during laser ablation [16–21]. Such solidified droplets are transported in the aerosol together with the smaller condensed particles and
Fig. 1 Filtered aerosol of NIST SRM 610 glass after 100 abla-tion pulses. a, b) 266 nm laser, 100μm spot size. Large parti-cles and agglomerates of nano-particles are visible. c, d) 193 nm laser, 80μm spot size. Almost exclusively agglomer-ates of nano-particles are visi-ble; no spherical particles are larger than 200 nm. The pores of the filter are visible in the images as dark areas
are visible on the filters (Fig.1a and b) depicting the aero-sol generated using 266-nm laser ablation. The aeroaero-sol contains significant amounts of spherical particles in a size range of up to 2μm, no significant agglomeration of these spherical particles was observed. In contrast, the aerosol from 193-nm laser ablation (Fig. 1c and d) contains no spherical particles exceeding 250 nm in size (Fig. 1d). These round-shaped 250 nm particles were also found to be extremely rare. The main part of the aerosol produced by the 193 nm laser consists of agglomerates of primary particles generated by vapour condensation.
Agglomeration of condensed nano-particles
Because the agglomerated particles shown in Fig.1do not enable determination of the origin of agglomeration and it remains questionable whether the condensed particles are transported as agglomerates immediately formed after the ablation or whether agglomeration occurs on the filter itself during particle deposition, only five laser pulses were applied to the sample to increase the distance between the deposited particles on the filter. Figure2a (266 nm) and b (193 nm) show almost“clean” filters containing only a few well-separated, spherical particles and agglomerates of nano-particles. Again, the observations for 266 nm and 193 nm laser ablation (Fig.1), showing that large particles are formed at 266 nm, are also confirmed for the low number of laser pulses. The agglomerates, however, seem comparable in size (approximately 0.5–2 μm) and are similar in structure for both wavelengths. This observation is a strong indication that a significant amount of the
ablated material undergoes the same fundamental process of condensation for both laser wavelengths. It can be assumed that the particle number density of condensed particles is high enough for agglomeration within the laser-induced plasma or during transport of the aerosol.
Figure 1b shows that the large, spherical aerosol par-ticles generated at 266 nm have a smooth, unstructured surface. Agglomerates attached to the particle surface (Fig. 1b) and single agglomerates (Fig. 2b) are similarly shaped and are, apparently, captured by the spherical particle during aerosol transport or on the filter after deposition.
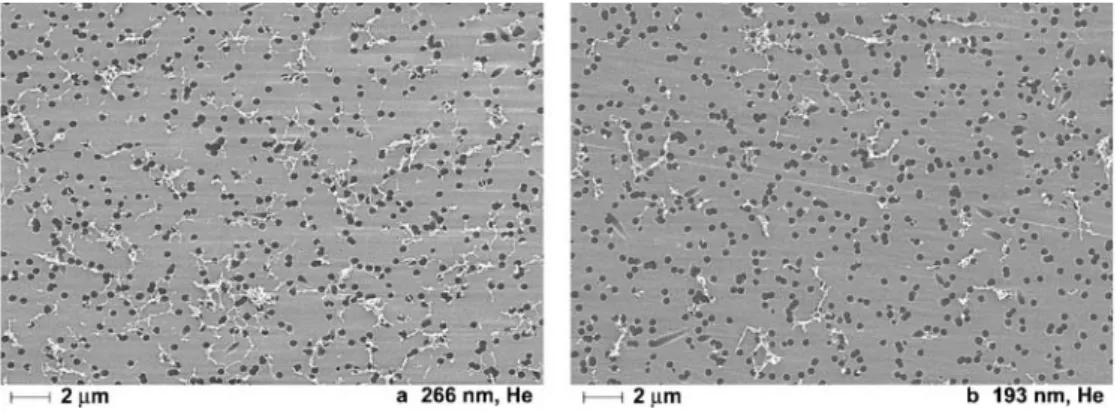
To assign the formation of the agglomerates to the ablation cell or the aerosol transport, particles were gener-ated under stopped-gas-flow conditions within the ablation cell using approximately 100 laser pulses at 193 nm. The particles were then flushed to the filter. Agglomerates generated at a longer residence time within the ablation cell were expected to be larger, because of the continuously growing aerosol particle number density in the ablation cell. The shapes of the filter-collected agglomerates gen-erated under stopped-gas-flow conditions (Fig. 3b) are significantly different from those of the agglomerates formed under normal gas flow (Fig.3a). Larger and more compact agglomerates are formed under stopped-gas-flow conditions whereas particles agglomerated under constant gas flow show more grid-like structures as already shown in Fig. 1c. This is another indication that particle ag-glomeration occurs within the ablation cell and is not a result of the filter collection process. Further experiments with carrier gas flow rates between 0.1 and 1 L min−1gave no further indication of a change in the size of the ag-Fig. 2 Filtered aerosol of NIST
SRM 610 glass after five laser pulses showing well separated particles and agglomerates. a Particles and agglomerates generated by 266 nm laser ablation (100μm spot size). b Agglomerates generated using 193 nm laser ablation (80μm spot size). The pores of the filter are visible in the images as dark areas
Fig. 3 a Filter-collected aerosol particles after 100 laser pulses (193 nm) transported using continuous gas flow. b) Agglomerates generated by approximately 100 pulses under stopped-gas-flow condi-tions, subsequently flushed to the filter. The pores of the filter are visible in the images as dark areas
glomerates. The fact that aerosol dilution does not affect aerosol particle sizes supports the finding that the ag-glomerates are formed immediately after condensation of their primary nano-particles is complete.
Aerosol structure of opaque BCR-2G basaltic glass
Particle formation for NIST SRM 610 glass and the opaque BCR-2G reference material was compared using 266 nm and 193 nm ablation for aerosol generation. Figure4shows the particles collected from ablated BCR-2G. Filter-collected agglomerates of nano-particles reveal no signif-icant differences between sizes and shapes for the two ablation conditions. The shapes of the agglomerates are similar, because both materials consist of a silicate matrix and differ mainly in their optical properties. The absorp-tivity determines the penetration depth in BCR-2G, which is small enough for both wavelengths to achieve complete vapour transition of the ablated sample material. Therefore, larger particles are absent for this high-absorbing glass. Such exclusive vapour condensation and agglomeration can usually be assumed for high-absorbing non-metal sam-ples at the power densities used in these experiments.
Comparison of the particle structures of NIST SRM 610 and BCR-2G leads to some general conclusions relevant to quantification using LA–ICP–MS, e.g. quantification of highly absorbing samples by using transparent NIST SRM 610 as an SRM at 266 nm is not as suitable as at 193 nm, because of the significantly different particle-size distribu-tion generated by laser abladistribu-tion. Furthermore, and as
pre-viously shown, the elemental composition of the aerosol particles depends on the particle size [30]. Therefore, dif-ferences between the particle structure observed at 266 nm for NIST SRM 610 and BCR-2G can lead to matrix effects within the ICP, because of incomplete particle vaporisation. Matching of the absorptivity for 266 nm of sample and calibration standard will, however, result in aerosol par-ticles of similar sizes and is, therefore, preferable for more accurate quantitative analysis in LA–ICP–MS, although the micron-sized spherical particles disturb the ICP sub-stantially and lead to higher RSDs.
Transparent fluorite (CaF2)
Pure fluorite is one of the most transparent materials in the low UV range. Because it has been shown for the NIST SRM 61X standard glass series that more large, spherical particles in the micron range are generated in the order 266 nm>213 nm>193 nm [15], an increased presence of these particles was also expected for the more transparent CaF2. Figure5a shows that even 193 nm ablation produces
significant amounts of particles approximately 0.5μm in diameter that are deposited on the filter. However, spherical particles up to 2μm in diameter were detected on the filter. Besides these micron-sized particles, the shapes of the ag-glomerates deposited on the filter were different from those of the agglomerates produced from the silicate glass sam-ples (Figs. 1–4). Whereas the agglomerates from ablated silicates were more linear in structure, the agglomerates from CaF2 were larger and had a cotton-like structure Fig. 4 Filtered aerosol from
a BCR-2G basaltic glass after 100 laser pulses. a 266 nm. b 193 nm. In contrast with NIST SRM 610, no spherical particles are visible for both wavelengths. However, the shape of the agglomerates is comparable with those from NIST SRM 610, because of the similar sil-icate matrix. The pores of the filter are visible in the images as dark areas
Fig. 5 Filtered aerosol of transparent CaF2ablated with a
193 nm laser at 80μm spot size. a 100 ablation pulses; b five ablation pulses. Spherical parti-cles and cotton-like structured agglomerates are formed. The pores of the filter are visible in the images as dark areas
(Fig.5b). This indicates that for each sample matrix, dif-ferent shaped agglomerates must be expected.
It is, therefore, important to mention that in a filter-influenced agglomeration process such matrix-dependent agglomeration structures would be difficult to explain.
Brass sample
The SEM images obtained from laser-generated and filter-collected brass aerosols indicate that vapour condensation is the predominant particle-formation mechanism for nano-second laser ablation at 266 nm (Fig. 6a) and 193 nm (Fig. 6c). Figure 6b shows the almost fractal-structured agglomerates of nano-particles, which are comparable in shape for both laser wavelengths. A variable amount of micron-sized, spherical particles is transported together with condensed vapour, depending on the laser operating
conditions selected. At 266 nm and power densities of 0.25 and 2 GW cm−2almost exclusively condensed and agglom-erated particles are genagglom-erated, whereas power densities in between (0.75 and 1.3 GW cm−2) lead to agglomerates and spherical particles in the micron range. A similar effect was measured for 193 nm laser ablation; at lower power densities (<0.3 GW cm−2) exclusively vapour is generated. No upper power density limit for complete vapour tran-sition of the sample was measured at 193 nm and 2 GW cm−2, however. With regard to the vaporisation and ion-isation of the aerosol particles in the ICP, laser energies leading to small particles or agglomerates are preferable for LA–ICP–MS. Different studies have reported non-stoichiometric aerosol compositions at low laser energies [23,31, 32], however, and that two sources of elemental fractionation can be observed (laser-induced and ICP-induced). High power densities at 266 nm also leading to exclusively small aerosol particles are therefore preferable Fig. 6 a Filtered aerosol
ob-tained from brass (B26) after 266 nm ablation at 2 GW cm−2 (100 pulses). Under these con-ditions, no large particles are generated. b After five pulses, well-separated agglomerates are deposited on the filter. c During 193 nm ablation at 2 GW cm−2 spherical particles and agglom-erates are generated. The pores of the filter are visible in the images as dark areas
Fig. 7 Filtered aerosol of NIST SRM 610 glass generated by 193 nm laser ablation in argon atmosphere after 500 shots (a) and after five shots (b) at 80μm spot size. The amount of parti-cles on the filter after 500 shots in argon (a) is comparable with that in helium after 100 shots only (Fig.1c), indicating that the transport efficiency in argon is significantly lower. The pores of the filter are visible in the images as dark areas
for quantitative analysis. More accurate results were also reported from femtosecond laser ablation [23] indicating that, for metals, the pulse length is an important condition.
Differences between argon and helium carrier gas
NIST SRM 610 was ablated at 193 nm using argon and helium as ambient gas during the ablation and as carrier gases. Previous particle-size-distribution measurements [33] indicated that the carrier gas shifts the particle size distribution towards smaller particles when using helium instead of argon. Furthermore, a 3–5 fold ICP–MS signal increase has been reported for 193 nm when using he-lium as carrier gas [26]. Both observations were made on the NIST SRM 610 glass.
When the particles deposited on the filter after a constant number of laser pulses are compared for both carrier gases it becomes obvious that the amount of deposited material after 500 laser pulses in argon (Fig.7a) is comparable with that deposited after 100 pulses in helium (Fig. 1c). When considering the similar ablation rates of the laser for the two carrier gas environments [34], this indicates that use of helium significantly enhances the transport efficiency. The lower transport efficiency in argon is accompanied by greater deposition of particles on the sample surface [33]. The size and shape of the deposited particles seem to be independent of carrier gas properties (Fig. 7b). The res-olution of the SEM is incapable of resolving changes in the size of primary particles below 10 nm, which might exist. However, a changed particle size within the low-nanometre range is not expected to change the vaporiza-tion behaviour in the ICP.
Conclusions
For laser ablation, two particle-formation mechanisms have been described in the literature; these lead to condensed nano-particles and to micron-sized spherical particles. Both types of particles were confirmed in this study of aerosol particles collected on filters before entering the ICP.
The SEM images shown here reveal vapour-condensed particles in the 10 nm range for different sample matrices such as glass, fluorite or metals. Furthermore and most important, these particles are transported as micron-sized agglomerates by the carrier gas and are most probably formed within the ablation cell. This result has a significant effect on the aerosol-measurement procedures as applied in Refs. [2, 23, 35]. It enables, for example, particle sizing with optical light scattering, which would not be possible for the primary 10 nm particles because light-scattering intensities would be too low. Furthermore, the agglomer-ates are too large to be separated by diffusion separation techniques. This is possible only for particles with physical dimensions smaller than approximately 200 nm—larger particles cannot be selectively separated by this technique. This study shows also that the shape of the agglomerates depends on the ablated sample matrix, and is
indepen-dent of the laser wavelength. The laser wavelength and sample absorptivity do, however, determine the amount of micron-sized spherical particles generated from non-metal samples. For non-non-metal samples, fewer of these par-ticles are present in aerosols generated at 193 nm compared to 266 nm ablation or for opaque samples such as BCR-2G. Metals readily absorb different laser wavelengths with comparable efficiencies, but their high thermal conductiv-ity increases the molten volume of the sample, especially for samples with low melting points, and can lead to enhanced splashing of large droplets. Reduction of droplet ejection by reducing the energy of the laser is critical, be-cause non-stoichiometric aerosols can be produced. Stoi-chiometric composition is, however, expected to be better for aerosols from high-energy ablation of brass leading to exclusively vapour generation. No data are available, how-ever, and determination of elemental composition will be part of further investigation.
Comparison of the effect of using argon and helium carrier gas shows no difference between particle or ag-glomerate structures. The total amount of particles trans-ported by helium is, however, significantly higher.
The results of this work reveal a need for more critical evaluation of the techniques used for particle-size distri-bution measurements, because of the simultaneous pres-ence of spherical particles and agglomerates of similar particle diameters within the aerosol. For glass samples with different transparencies, it can be concluded that aerosol structures are more similar after laser ablation at 193 nm than after ablation at 266 nm.
Acknowledgements This work was funded by the ETH Zurich and the Swiss National Science Foundation. The support by Dr Frank Krumeich and Michael Stalder, who facilitated the SEM measure-ments, is greatly appreciated.
References
1. Russo RE, Mao XL, Liu HC, Gonzalez J, Mao SS (2002) Talanta 57:425–451
2. Kuhn HR, Guillong M, Günther D (2004) Anal Bioanal Chem 378:1069–1074
3. Stirling CH, Lee DC, Christensen JN, Halliday AN (2000) Geochim Cosmochim Acta 64:3737–3750
4. Figg D, Kahr MS (1997) Appl Spectrosc 51:1185–1192 5. Guillong M, Günther D (2002) J Anal At Spectrom 17:831–837 6. Kuhn HR, Günther D (2003) Anal Chem 75:747–753 7. Callies G, Schittenhelm H, Berger P, Hugel H (1998) Appl Surf
Sci 129:134–141
8. Kar A, Mazumder J (1994) Phys Rev E 49:410–419
9. Gnedovets AG, Gusarov AV, Smurov I (2000) Appl Surf Sci 154:508–513
10. Bogaerts A (2004) Can modeling help us to “See the light”? Conference on Plasma Spectrochemistry, Fort Lauderdale, FL 11. Bogaerts A, Chen ZY, Gijbels R, Vertes A (2003) Spectrochim
Acta Part B 58:1867–1893
12. Zhigilei LV (2003) Appl Phys A-Mater Sci Process 76:339–350 13. Geohegan DB, Puretzky AA, Duscher G, Pennycook SJ (1998)
Appl Phys Lett 72:2987–2989
14. Zheng J, Lou QH, Dong JX, Li J, Wei JR (1996) Opt Commun 132:285–288
15. Guillong M, Horn I, Günther D (2003) J Anal At Spectrom 18:1224–1230
16. Yoo JH, Jeong SH, Mao XL, Greif R, Russo RE (2000) Appl Phys Lett 76:783–785
17. Yoo JH, Jeong SH, Greif R, Russo RE (2000) J Appl Phys 88:1638–1649
18. Lu QM, Mao SS, Mao XL, Russo RE (2002) Appl Phys Lett 80:3072–3074
19. Huang Y, Shibata Y, Morita M (1993) Anal Chem 65:2999– 3003
20. Baker SA, Smith BW, Winefordner JD (1998) Appl Spectrosc 52:154–160
21. Thompson M, Chenery S, Brett L (1990) J Anal At Spectrom 5:49–55
22. Alexander ML, Smith MR, Hartman JS, Mendoza A, Koppenaal DW (1998) Appl Surf Sci 129:255–261
23. Koch J, von Bohlen A, Hergenröder R, Niemax K (2004) J Anal At Spectrom 19:267–272
24. Liu C, Mao XL, Mao SS, Zeng X, Greif R, Russo RE (2004) Anal Chem 76:379–383
25. Günther D, Frischknecht R, Heinrich CA, Kahlert HJ (1997) J Anal At Spectrom 12:939–944
26. Eggins SM, Kinsley LPJ, Shelley JMG (1998) Appl Surf Sci 129:278–286
27. Günther D, Heinrich CA (1999) J Anal At Spectrom 14:1363– 1368
28. Gao S, Liu XM, Yuan HL, Hattendorf B, Günther D, Chen L, Hu SH (2002) Geostand Newsl 26:181–196
29. Jeong SH, Borisov OV, Yoo JH, Mao XL, Russo AE (1999) Anal Chem 71:5123–5130
30. Kuhn HR, Günther D (2004) J Anal At Spectrom 19:1158– 1164
31. Mao XL, Ciocan AC, Russo RE (1998) Appl Spectrosc 52:913–918
32. Mao XL, Chan WT, Caetano M, Shannon MA, Russo RE (1996) Appl Surf Sci 96(8):126–130
33. Horn I, Günther D (2003) Appl Surf Sci 207:144–157 34. Horn I, Guillong M, Günther D (2001) Appl Surf Sci 182:91–
102
35. Kosler J, Wiedenbeck M, Wirth R, Hovorka J, Sylvester P, Mikova J (2005) J Anal At Spectrom 20:402–409