Determinants of International
Activities: Are SMEs Different?
Heinz HollensteinABSTRACT. In this paper we econometrically investigate the factors determining the choice of a specific international-isation strategy. We distinguish four strategies, ranging from “serving foreign markets through exports only” up to “exporting and locating abroad several business functions such as distribution, production and R&D”. These strategies are evaluated against the reference category “domestic sales only” (multinomial logit model). The analysis, to a large extent, confirms Dunning’s well-known OLI paradigm. O-advantages turn out to be the main drivers of internationalisation, irre-spective of firm size and internationalisation strategy. However, the knowledge-base on which O-advantages of smaller firms rests is more narrow than that of large compa-nies. Whereas the former rely, in relative terms, primarily on capabilities related to incremental innovations, the latter draw to a higher extent on assets enabling them to be competitive in terms of far-reaching innovations. L-advantages (wages, regulatory framework, etc.) primarily are relevant in case of small firms; but even for this size class, O-advantages are dominant.
1. Introduction
Since the eighties, the internationalisation of SME strongly accelerated (UNCTAD, 1993; OECD, 1997). Although exporting is still the most frequent type of international activity, SMEs become more often directly involved at foreign locations through activities in distribution, pro-duction, R&D, etc.. Accordingly, research interest shifted towards this more recent phenomenon (Coviello and Mc Auley, 1999).
Most analyses of the internationalisation of SMEs assume that these firms face, to a higher extent than large companies, resource constraints in terms of finance, information, management capacity, etc. (Buckley, 1989), as well as external barriers such as market imperfections and regula-tions (Acs et al., 1997). As a consequence, the probability of SMEs internationalising their activities is lower than in case of large firms.
The same assumption is used to explain a firm’s decision on the ownership mode of entering inter-national markets. It is shown that SMEs more often than large firms choose contractual arrange-ments (see e.g. Berra et al., 1995), and, if inter-national activities are equity-based, SMEs prefer minority-stakes to full ownership, whereas in case of large firms the opposite is true (see e.g. Mutinelli and Piscitello; 1998; Fujita, 1995). Choosing “soft” forms of internationalisation is a way to overcome or reduce (some of) the above-mentioned constraints. Nevertheless, also in case of SMEs, full ownership often is chosen as strategy to going international, in particular in “high-tech” niche markets (Buckley, 1989; Kohn, 1997).
The increasing importance of contract-based internationalisation of SMEs is reflected in a growing body of literature which analyses this form of international engagement in some detail taking a “network perspective” (see the references in Coviello and Mc Auley, 1999). More intensive competition in a global economy, increasing science and knowledge content of economic activity and innovation, high and increasing costs of knowledge production and shortening of product cycles make collaborations attractive, or even necessary. Such agreements give access to complementary assets and are an opportunity to exploit economies of scale and scope. A special Final version accepted on July 29, 2003
Swiss Federal Institute of Technology Institute for Business Cycle Research Weinbergstrasse 35, CH-8092 Zurich Switzerland
and
Austrian Institute of Economic Research Vienna
Austria
E-mail: hollenstein@kof.gess.ethz.ch DOI 10.1007/s11187-005-6455-x
case of a (largely) contract-based internationali-sation are foreign engagements of young, mostly “high-tech” and/or knowledge intensive firms, which are addressed in the growing literature on “Born Globals” (see e.g. McDougall et al., 1994; Madsen and Servais, 1997 as well as a recent review of a large number of empirical studies by Rialp-Crado et al., 2002).1
The evidence on network-based international activities challenged the “stages view of interna-tionalisation” (Johanson and Wiedersheim-Paul, 1975; Johanson and Vahlne, 1977), which until the mid-eighties has been the dominant version of the process-oriented analysis of internationalisation. The rise of international alliances also uncovered some limitations of the traditional version of the OLI framework, as developed in the seventies and eighties (Dunning, 1988, 1993). However, recent developments of the OLI paradigm stress the role of alliances and networks as a means to augment the value of a firm’s unique capabilities by strate-gies of seeking complementary assets all over the world. The OLI framework gives now more weight to the evolutionary, process-oriented aspects of internationalisation than it did before (see Dunning, 2000; Cantwell and Narula, 2001). The theoretical developments of the last decade show thus some convergence of the various approaches.
In spite of the large number of empirical studies dealing with the internationalisation of SMEs it is difficult to draw general conclusions, for several reasons: firstly, the coverage in terms of industries and sectors is very limited in most studies (see Coviello and McAuley, 1999, Table 1). Usually, work is confined to manufacturing or to specific manufacturing and service industries (clothing, semi-conductors, tourism, computer software, various business services). There are few studies covering substantial parts of both sectors.
Secondly, much work is based on a small number of firms. Among the studies reviewed by Coviello and McAuley (1999, pp. 232–239), more than half draw on less than 50 observations, and only two are based on 500 or more firms (Berra et al., 1995; Korhonen et al., 1996). Although there are a few more studies using larger samples (e.g. Mutinelli and Piscitello, 1998; Kohn, 1997; Urata and Kawai, 2000), it remains difficult to generalise the findings. Nevertheless, a small
sample (often interview-based case study) approach may have its own merits, since it allows, among other things, an in-depth analysis of the process of internationalisation which, for example, can be used as starting point for coming-up with general theoretical propositions.
Thirdly, quantitative work related to the inter-nationalisation of SMEs, to a large extent, does not go beyond the analysis of bivariate relation-ships (see OECD, 1997; Coviello and McAuley, 1999, pp. 232–239). Exceptions are, for example, Mutinelli and Piscitello (1998) dealing with the ownership structure of foreign activities, Urata and Kawai (2000) investigating the choice of location of Japanese FDI, Simoes and Crespo (2002) studying the impact of firm-specific factors on the international involvement of firms, or Kuo and Li (2003) analysing, in a panel framework, the role played by firm-specific and location-specific factors in explaining FDI. Multivariate econo-metric work is more frequent in case of the internationalisation of SMEs through exports (for a recent example, based on firm-level data, see Lefebvre and Lefebvre, 2002).
Fourthly, and surprisingly, there are not many empirical studies which systematically compare the behaviour of small firms with that of large companies. To mention are, for example, Buckley (1997) as well as the (already mentioned) contri-butions of Kohn (1997), Mutinelli and Piscitello (1998) and Urata and Kawai (2000). SME-specific behaviour of internationalisation, as identified in purely SME-oriented studies, may turn out to be not as size-specific as it is concluded from this type of work.
In the present paper, we are able to correct for these four shortcomings: firstly, we cover the whole private sector of the Swiss economy, i.e. manufacturing, construction as well as services. Secondly, we can draw on a large dataset con-taining information from 2,424 firms, which responded to a comprehensive questionnaire. Thirdly, the analysis, besides a short descriptive part, is based on the econometric estimation of two multivariate models of internationalisation. Finally, since we estimate these models not only for the whole sample but also for three firm size classes (5–49, 50–199, 200 and more employees),2 we are in a position to identify size-specific patterns of explanation. To our knowledge, an
investigation taking into account, at the same time, all these aspects, thus largely correcting for the deficiencies mentioned above, is unique.3
In this paper, we investigate two topics. Firstly, we characterise the pattern of international activ-ities of Swiss firms. The purpose of this part is, one the one hand, to present some background information which prepares the ground for the econometric analysis. On the other hand, it yields some evidence with respect to size-specific insti-tutional arrangements of foreign activities (“own-ership mode”) as well as the appropriateness of the proposition of SMEs facing specific resource constraints which impede international activities. Secondly, we try to identify econometrically the factors determining international activities of Swiss firms, differentiated by three firm size classes. To this end, we specify two empirical models, taking the OLI paradigm as theoretical point of reference. In the first model, we estimate the probability of a firm belonging to one of the following three categories: (a) selling on domestic markets only, (b) serving, additionally, export markets without engaging in more far-reaching international activities, and (c) combining domestic and export sales with a direct presence at foreign locations. In the second model, we subdivide category (c) into three types of strate-gies in terms of (combinations of) business func-tions to be located abroad.
To our knowledge, there is no econometric work analysing a model of type II. Moreover, we know one single study based on estimates of a model of type I, that is Simoes and Crespo (2002) who investigate the internationalisation behaviour of Portuguese medium-sized manufacturing firms. Therefore, the present paper may significantly add to our understanding of the factors determining the choice of alternative internationalisation strategies. The set-up of the paper is as follows: In Section 2, we describe the database. Section 3 is devoted to a short descriptive analysis of the pattern of internationalisation of the Swiss economy, differ-entiated by firm size. In Section 4, the determi-nants of international activities of SMEs and large firms are analysed. Finally, we discuss the main findings and indicate some lines of future work.
2. Data
The firm data used in this investigation have been collected primarily in the course of a postal survey on the “Internationalisation of the Swiss Economy” carried out in autumn 1998. The available data are to a high extent qualitative in nature (nominal or ordinal measures). The questionnaire yielded information on international activities, differenti-ated by type of activity (exports, distribution, production, R&D, licensing, etc.) and degree of control (wholly-owned affiliate, joint venture, etc.), the regional orientation of exports and international investments, the motives for and the obstacles to expand internationally, etc. In addition, we collected information about innova-tive activities and some basic characteristics of the firm (sales, value added, employment, etc.).
The questionnaire has been addressed to a sample of 5,567 firms with at least five employees, which covered the private sector of the economy. The sample has been (disproportionally) stratified by 28 industries and three industry-specific firm size classes with full coverage of large firms. The survey yielded data for 2,424 enterprises, of which 44% are small and 37% medium-sized firms. The response rate of 43.5% is quite satisfactory given the very demanding questionnaire. The structure of the dataset in terms of firm size and industry is very similar to that of the underlying sample. To correct for “unit” non-response, we conducted a non-response survey with 400 firms (response rate: 95%). Since it did not point to a significant selectivity bias, the dataset at hand is representa-tive for the underlying sample.
In complex surveys, “item” non-response is another general problem. The usual procedure of dropping the observations with incomplete data may produce biased estimates of means, propor-tions and regression coefficients. To solve this problem, we used the method of “multiple impu-tation” (see Rubin, 1987; for details of the proce-dure, as applied in the present study, we refer to Donzé, 2001). By substituting imputed values for missing ones, we could avoid a substantial loss of observations. It turned out, however, that the results from estimating the model explaining a firm’s international activities (Section 4) were quite the same whether we used the whole sample (i.e. observations with imputed values included)
or the reduced one (i.e. only observations with no missing values for the explanatory variables). We are thus quite confident that the presented results referring to the whole sample are robust.
In addition to the data collected in the course of the “Internationalisation Survey 1998”, we used information stemming from the “Swiss Innovation Survey 1996” and the “Swiss Investment Survey 1998” which also were carried out by our insti-tute.4
3. Some characteristics of international activities of Swiss firms
The Swiss economy is highly internationalised (Table I). In 1998, 56% of the firms of our sample were engaged in foreign activities, either by serving foreign markets through exports only (23%) or, additionally, by being directly present in foreign countries (33%). The degree of inter-nationalisation is significantly higher for large than for small firms; nevertheless, even small companies (5–49 employees) are highly active in foreign transactions, with 45% of them exporting goods and/or services or being directly involved in activities at foreign locations.
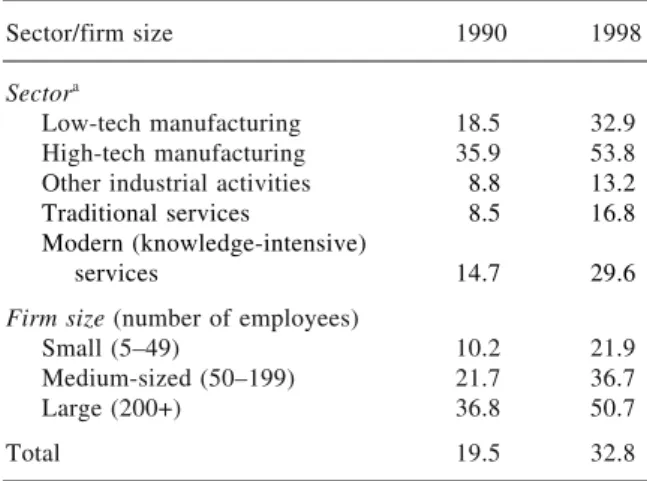
The most remarkable feature of the process of internationalisation over the nineties is the strong growth of the proportion of firms that are directly present abroad (Table II). It increased by almost 70% in the period 1990–98, with significantly
higher growth rates for SMEs and for the service sector. With 22% of small firms being directly engaged at foreign locations in 1998, even this category of firms was internationalised to a remarkable degree. Manufacturing industries (in particular, the “high-tech” segment) are distinctly more internationalised than services; nevertheless, the proportion of internationally active firms also reached a high level in knowledge-intensive services (in particular, business and R&D/IT services).
Returning to Table I, we get some information on the firms’ “portfolio of international activities”, representing the parallel use of several forms of foreign engagements, pertaining to exports and the foreign location of specific business functions (distribution, production, R&D, etc.). It turns out that strategies involving a direct foreign presence are more prevalent than exclusively export-based activities. Among the companies directly engaged at foreign locations, more than 40% follow a strategy which rests on one single type of business activity (categories 3a to c as a percentage of 3). Within this group of firms, “distribution/other activities only” (see note c to Table I) holds a larger share than “production/procurement only”. Foreign R&D takes place only in combination with other business functions. 30% of firms engaged at foreign locations are active in two types of activities (category 3d), and more than every fourth company combines R&D with one or
TABLE I
Share of firms by business functions as a percentage of all firms, 1998a
Business functions Small Medium Large Total
1. Domestic sales only 054.9 037.0 032.7 044.1
2. Domestic and export sales 023.2 026.3 016.6 023.1
3. Direct presence at foreign locationsb
021.9 036.7 050.7 032.8 3a. Foreign distribution/other activities onlyc
007.7 012.0 012.6 010.2
3b. Foreign production/procurement only 002.9 004.3 004.9 003.8
3c. Foreign R&D only 000.0 000.0 000.0 000.0
3d. Foreign distribution/other activitiesc
and production/procurement 005.0 012.5 016.0 009.8
3e. Foreign R&D and distribution/other activitiesc
and/or production/procurement 006.3 007.9 017.2 009.0
Total 100 100 100 100
a Firm size is measured by the number of employees: small (5–49), medium-sized (50–199), large (200+).
b 7% of the firms directly engaged abroad do not export any goods or services.
two of the other forms of foreign presence (category 3e).
The “portfolio of international activity” varies quite strongly among the three firm size classes. Large firms, not surprisingly, are most frequently present at foreign locations in a direct way, and the proportion of firms deploying abroad all types of business functions (category 3e) is particularly high in this case. Small firms show an interesting pattern of internationalisation. One the one hand, in comparison to large and medium-sized enter-prises, direct engagements are less prevalent; on the other hand, the proportion of small firms with foreign R&D as a percentage of all firms directly engaged at foreign locations (category 3e as a percentage of 3) is not much lower than that of large firms, and significantly higher than in case of medium-sized companies. There is thus a significant “high-tech” and knowledge-intensive segment of internationally active small firms. This finding may support the growing evidence of some weakening of the stepwise procedure of interna-tionalisation, as documented, in the first instance,
in studies of internationalisation based on a network perspective and in the “Born Global” literature (see Section 1).
Although the Swiss economy is highly inter-nationalised, the majority of firms were not (directly) present in other countries in 1998. Table III shows that SMEs, in most instances, are more frequently confronted with serious barriers to engage at foreign locations than large companies. This particularly holds true with respect to insuf-ficient management capacity, lack of financial resources, high financial risks, insufficient knowl-edge of foreign locations as well as legal insecu-rities. This pattern of constraints to expand internationally broadly confirms the hypotheses put forward by Buckley (1989) and others (see Section 1).
This size-specific pattern of obstacles also affects substantially the choice of a suitable insti-tutional arrangement when expanding to foreign locations. Given the risks and resource constraints, a cautious approach to internationalisation, which does not involve a too large amount of (fixed) investment, might be, in many instances, the most attractive strategy. Therefore, it is not surprising, as Table IV shows, that large companies more often hold a 100% equity stake in foreign affili-ates, in particular compared to small firms. With regard to minority stakes, the differences among the three size classes are negligible. On the whole, small firms tend to prefer contractual (co-opera-tive) arrangements, whereas large firms more often choose an equity-based organisation of their international activities. These results regarding the ownership mode of engagements in foreign coun-tries are in line with previous evidence (see Berra et al., 1995; Fujita, 1995; Mutinelli and Piscitello, 1998; see also the findings of many contributions based on the “network perspective of internation-alisation” referred to by Coviello and McAuley, 1999).5
However, as Table IV shows, even small firms, but in particular medium-sized companies consider quite frequently the full ownership of an affiliate as the appropriate mode of organising their internationalisation engagement. This type of arrangement might be optimal, if a firm, based on very specific knowledge, is a leading player in a market niche. In this case, co-operative agree-ments, which always involve (some) knowledge-TABLE II
Share of firms with direct engagements at foreign locations as a percentage of all firms, 1990 and 1998
Sector/firm size 1990 1998
Sectora
Low-tech manufacturing 18.5 32.9
High-tech manufacturing 35.9 53.8
Other industrial activities 08.8 13.2
Traditional services 08.5 16.8 Modern (knowledge-intensive)
services 14.7 29.6
Firm size (number of employees)
Small (5–49) 10.2 21.9
Medium-sized (50–199) 21.7 36.7
Large (200+) 36.8 50.7
Total 19.5 32.8
a
“Low-tech” manufacturing: food/beverages/tobacco,
tex-tiles/clothing, wood, paper, printing, non-metallic minerals, metals, metalworking, watch-making. “High-tech”
manufac-turing: pharmaceuticals, chemicals/plastics,
mechanical/elec-trical engineering, vehicles, electronics/instruments. Other
industrial activities: energy/gas/water, recycling, construction. “Traditional” services: wholesale/retail trade,
hotels/restau-rants, transport/communication, personal services. “Modern”
services: banking, insurance, R&D, IT services, business
sharing, would probably undermine the firm’s competitive edge (Kohn, 1997; Gomes-Casseres, 1997).
There are many motives inducing firms to engaging at foreign locations. Dunning (1993) distinguishes market-seeking (demand oriented) strategies of internationalisation as well as resource-seeking and efficiency-seeking (supply-oriented) foreign investments. Over the last decade, strategic asset-seeking strategies have become more important, giving rise to mergers and acquisitions as well as to strategic alliances (Acs and Preston, 1997; Dunning, 2000; Cantwell and Narula, 2001).
Table V presents some information on the motives for locating production/procurement facil-ities in foreign countries. It turns out that market-oriented motives (items 14 to 19 and 21 in the table), in particular “securing existing markets”, “entering/developing new markets”, are the most important objectives of going abroad. In case of small and medium-sized firms, however, motives related to cost-reduction (exploiting lower labour costs, supplying intermediate goods to the own firm; item 6 and 8), which reflect primarily effi-ciency-seeking strategies, seem to be (almost) as important as those related to market-seeking activities (even more so in the manufacturing TABLE III
Obstacles to start operations at foreign locations, 1998a
(share of firms assessing a specific obstacle as important (value 4 or 5 on a 5-point scale) as a percentage of firms for which going abroad is an option)
Obstacle Small Medium Large Total
Deficiency of financial resources 26.5 19.0 04.4 20.6
High financial risks 39.1 30.3 36.8 35.3
Restricted transfer of profits 12.2 08.7 08.8 10.4
Insufficient knowledge of foreign locations 16.4 14.9 05.9 14.4
Insufficient management capacity 33.6 30.3 23.5 30.9
Restrictive market regulations 18.1 16.9 22.1 18.2
Insufficient patent/trademark protection 09.7 07.2 00.0 07.4
Legal insecurities 18.1 14.9 11.8 16.0
Political instability 13.5 12.8 13.2 13.2
Other obstacles 09.7 16.4 17.7 13.4
a
For the definition of the firm size classes, see Table I.
TABLE IV
Share of firms directly engaged at foreign locations by ownership mode, 1998a
(sum of multiple answers = 100%)
Ownership mode Small Medium Large Total
1. Wholly-owned subsidiary 023.6 033.1 036.5 031.5
2. Minority stake, joint venture 018.3 015.8 019.6 017.7
3. Permanent co-operation 053.9 054.3 049.6 052.8
4. Subcontracting 023.9 019.8 017.7 020.4
5. Franchising, licensing to foreign partners 018.4 019.1 016.8 018.2 6. Service and management contracts, etc. 021.8 015.7 016.8 017.8
Total 100 100 100 100
Among which:
(a) Equity-based (1+2) 041.9 048.8 056.1 049.2
(b) Contract-based (3+4+5+6) 058.1 051.2 043.9 050.8
a
sector). Motives referring to resource-seeking strategies (items 1, 2, 4, 5, 7) as well as policy-related objectives (regulatory framework, tax regime; etc.; items 10 to 13) do not constitute substantial disadvantages of Swiss locations to be compensated for by going abroad. Information on the objectives of internationalisation of R&D, we presented in Arvanitis et al. (2001), points to the relevance of asset-seeking strategies. Exploiting the proximity to highly innovative (networks of) firms and to leading universities, as well as trans-ferring to Switzerland knowledge acquired through R&D activities at foreign locations are important motives for engaging in foreign R&D.
Summing up this descriptive part of the analysis,6we find that a large proportion of Swiss firms, whether they are big or small, are highly internationalised, with the process of directly engaging abroad having strongly proceeded over the nineties. A majority of the internationalised firms combines export activities with a presence in other countries. More than half of the firms directly engaged in foreign countries have located
there at least two business functions. Moreover, a substantial proportion, in case of small firms as well, deploy abroad also R&D activities. Because of internal resource constraints and external barriers, small firms, with some important excep-tions such as knowledge-based “niche-suppliers, prefer co-operative modes of internationalisation, whereas equity-based arrangements are dominant in case of large firms. Information on the motives for going abroad show that market-seeking gies are more prevalent than cost-oriented strate-gies, which, however, are quite important in case of SMEs. Moreover, asset-seeking strategies, e.g. with respect to foreign R&D, play a significant role.
We turn now to a model-based empirical analysis of international activities. More specifi-cally, we aim at explaining a firm’s choice of a specific “portfolio of international activities” as defined in Table I. We again differentiate by three firm size classes in order to get some insight into size-specific patterns of explanation.
TABLE V
Motives for production/procurement at foreign locations, 1998a
(share of firms assessing a specific motive as important (value 4 or 5 on a 5-point scale) as a percentage of firms with foreign production/procurement operations)
Advantage of foreign locations with respect to: Small Medium Large Total
01. Availability of natural resources 11.7 13.0 7.6 10.8
02. Supply of intermediate goods 21.2 16.4 008.7 15.1
03. Transport costs 23.4 20.2 21.5 21.5
04. Availability of qualified workers 16.8 21.2 04.8 17.8
05. Availability of unqualified workers 08.0 14.9 11.6 12.0
06. Wage costs 45.3 47.1 37.2 43.3
07. Availability/price of infrastructure 26.3 26.4 25.0 25.9
08. Supplying the own firm 35.0 36.1 29.1 33.5
09. Exchange rate risks 23.4 24.5 20.4 22.8
10. Tax burden, investment subsidies 28.5 20.7 16.9 21.5
11. Labour market regulations 18.3 20.7 16.9 18.8
12. Environmental regulations 12.4 11.1 04.1 09.1
13. Bureaucracy 21.9 24.0 19.2 21.9
14. Exporting to other countries 37.2 48.1 45.4 44.3
15. Securing/developing existing markets 54.0 63.5 65.1 61.5
16. Entering/developing new markets 52.6 60.6 70.0 61.5
17. Presence of main client 36.5 39.9 48.4 40.8
18. Presence of competitors 25.6 23.6 22.7 23.8
19. First mover advantages 34.3 35.6 38.4 36.2
20. Trade barriers in general 27.0 31.7 27.3 29.0
21. Access to EU market 37.2 39.9 36.1 37.9
a
4. Determinants of the international activities 4.1. Theoretical background
There are basically three strands of theory to explain international investments of firms. The classical theory of international trade stresses the factor endowment of an economy and implies that a firm’s investment follows the comparative advantages of different locations (see Mundell, 1957). According to the “new trade theory” firms exhibit specific capabilities (technology, mar-keting, etc.) that can be successfully exploited at home as well as at foreign locations, indepen-dently from the economic attractiveness of dif-ferent countries (see, for example, Helpman, 1984; Ethier, 1986). Transaction cost theory, finally, hypothesises that a firm tends to engage in FDI whenever the costs of setting up and running a transnational hierarchical (or network) organisa-tion are lower than those arising from external market transactions (Buckley and Casson, 1985). In addition to these basic theoretical approaches, there is a whole number of partial hypotheses to explain specific aspects of internationalisation, which are rooted in different “sub-disciplines” of economics such as industrial organisation, man-agement sciences, evolutionary economics, economic geography or finance (see Dunning, 2000).
It dates back to the seventies that Dunning hypothesised that no single approach is able to fully explain a firm’s international activity. Therefore, he proposed as framework of analysis an eclectic theory of international production, the “OLI paradigm”. In his understanding, it covers the most important theories in a way that it is more than just a sum of the constituent hypotheses (Dunning, 1988, 1993).
The OLI paradigm serves as theoretical frame-work of our econometric analysis. Dunning dis-tinguishes three groups of variables which explain international engagements of a firm: “ownership-specific” (O), “location-“ownership-specific” (L) and “inter-nalising advantages” (I). O-advantages are firm-specific characteristics and capabilities that make a firm superior to local competitors irre-spective of general locational characteristics. This type of advantages arises from the availability of human, knowledge and physical capital as well as
specific intangibles related to property rights, mar-keting, organisation, information processing, learning, managerial skills, governance and trust, finance, experience with foreign markets, etc. L-advantages represent potential gains a firm can realise by optimising its activities along the value chain across locations. This type of advantage is rooted mainly in country-specific differences with respect to factors of production (availability, quality, price), infrastructure, transport and com-munication costs, taxes and subsidies, regulatory framework, etc. I-advantages can be realised by internalising market transactions through mergers and acquisitions or by forming co-operations and alliances. In this way, a firm can reduce search and transaction costs, secure availability and high quality standards of key materials and compo-nents, etc. The three groups of variables are clearly related to the basic theoretical approaches men-tioned above: O-advantages capture the main ingredients of new trade theory, L-advantages are related to the classical trade theory, whereas I-advantages represent the transaction cost approach.
In recent years, the OLI paradigm has been further developed to take account of new economic forces (world-wide competition, reduc-tion of transacreduc-tion costs, increasing knowledge content of economic activities, etc.), provoking a change of patterns of internationalisation, among which international networking and strategic alliances are the most outstanding ones. These changes have been taken up by new explanatory approaches (e.g. the “network perspective of inter-nationalisation” or the “Born Global” literature) as well as by further developing more evolutionary concepts of the firm (from the resource-based concept of the firm (e.g. Wernerfelt, 1984) to the “dynamic capability view” (e.g. Teece and Pisano, 1998)). As a consequence, the OLI paradigm was adjusted to accommodate these more dynamic aspects. In its most recent version (Dunning, 2000; Cantwell and Narula, 2001), international alliances and networks are seen as efficient means to preserve and augment the firm’s unique resources and capabilities (i.e. the O-advantages), since they give access to (critical) assets which complement those of the firm itself. Correspondingly, asset-seeking internationalisation strategies play a prominent role in a more dynamic version of the
OLI framework. In spite of these adjustments, there has been no need to change the basic struc-ture of the eclectic paradigm (see Dunning, 2000, who also provides a very comprehensive review of recent additions to the literature).
4.2. The empirical model
Specification of the dependent variables and estimation method
We shall present cross-section estimates for two models. In model I, we distinguish two groups of internationalised firms (see Table I, categories 2 and 3): (a) firms serving foreign markets without direct presence in foreign countries (X), (b) firms which, in addition to exporting goods/services, are directly engaged in activities at foreign locations (FA). We estimate the probability to belong to category X or FA respectively, with firms without any foreign activity (H) as reference group (Table I, category 1). FA, X and H are considered as unordered categories (nominal measures). The multinomial logit model is thus the appropriate estimation procedure. It yields for each explana-tory variable two parameter estimates, one refer-ring to the response level X, the other one to FA, whose significance is evaluated against the refer-ence group “no foreign activity” (H).7
The same estimation procedure is used in case of model II, where the response level FA (Table I, category 3) is subdivided into three groups, based on the number of internationalised business functions. Category DF1 contains firms which are engaged abroad in distributive/other activities (3a) or local production/procurement (3b). DF2 repre-sents firms active abroad through distributive/ other activities and production/procurement (3d). Finally, category RDF covers companies which, in addition to distributive/other activities and/or production/procurement, also do some R&D in foreign countries (3e). We thus end up with five response levels, that is four internationalisation strategies (X, DF1, DF2, RDF), and strategy “no international activity” (H). For each explanatory variable, we estimate separate parameters for the four internationalisation strategies, which are thus evaluated against the reference group H.8
By estimating the two models, we are able to identify for each strategy of internationalisation the specific pattern of variables that determines
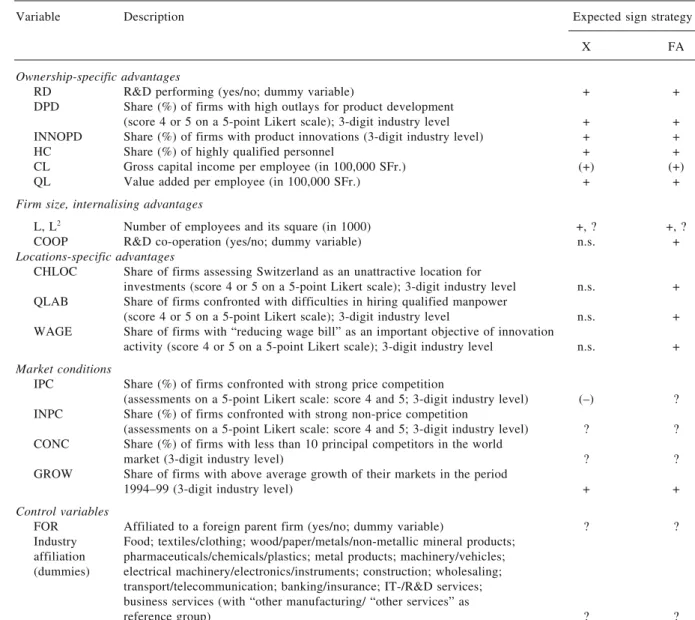
its occurrence. Moreover, based on size-specific sub-samples, we analyse whether the internation-alisation of firms of small-, medium-sized and large firms are driven by different forces, and whether the magnitude of the influence a specific explanatory variable exerts differs by firm size. Specification of the explanatory variables Table VI shows the specification and measurement as well as the expected signs of the explanatory variables we used to capture the main determinants of international activities, as proposed by the OLI paradigm and listed in some detail in Dunning (1993, p. 81) and in Dunning (2000).
A first group of variables represents O-advan-tages which are expected to be positively related to international activities. Technology and inno-vation are important dimensions of this type of advantages. We use three proxies to capture them. Two measures are related to the input side of the innovation process, that is a dummy variable (RD) which indicates whether a firm is active in R&D, and a more application-oriented variable (DPD) representing the intensity of outlays for developing new products. Whereas RD is a firm-level variable (data from the Internationalisation Survey 1998), DPD is measured at the 3-digit industry level (136 industries; data from the Innovation Survey 1996), with the 3-digit industry values ascribed to each firm affiliated to the corresponding industry.9The same procedure is used to specify the third inno-vation-related variable which reflects innovation output (INNOPD); it measures whether a firm, in a three-years reference period, brought new products at the market place. The availability of human capital, measured by the share of personnel holding university or similar degrees (HC), is another important dimension of O-advantages. We also included physical capital intensity, taking as an indicator the flow of capital services (i.e. gross capital income) per employee (CL). In view of the easy access to capital goods, it is an empirical question whether the firm-specific component of physical capital is large enough to produce O-advantages.
Some other O-advantages are more difficult to measure. To mention are firm-specific capabilities related to organisational matters (e.g. managerial skills, incentive structure for management and workforce, system of information gathering and
processing, networking capabilities, human resource development and learning, social capital and trust), marketing (e.g. brand names, well-developed relationships to users, efficient distrib-ution channels),10 or finance (e.g. access to the stock market, management of financial assets and risks). Our database did not allow to capture such capabilities explicitly. However, this shortcoming is not as serious as it looks at first sight. Some of the variables of our model, particularly human capital (HC) as well as research and
innovation-related measures (RD, DPD, INNOPD) indirectly capture some of these additional factors, since they are correlated with them (as can be shown by use of other survey data collected by our institute).11 We also include a productivity and a firm size variable, assuming that these represent in a summary way a firm’s endowment with those resources and capabilities we are not able to explicitly specify. Productivity is measured as value added per employee (QL), and firm size by the number of employees (L) and, to allow for TABLE VI
Specification of the explanatory variables
Variable Description Expected sign strategy
X FA
Ownership-specific advantages
RD R&D performing (yes/no; dummy variable) + +
DPD Share (%) of firms with high outlays for product development
(score 4 or 5 on a 5-point Likert scale); 3-digit industry level + +
INNOPD Share (%) of firms with product innovations (3-digit industry level) + +
HC Share (%) of highly qualified personnel + +
CL Gross capital income per employee (in 100,000 SFr.) (+) (+)
QL Value added per employee (in 100,000 SFr.) + +
Firm size, internalising advantages
L, L2
Number of employees and its square (in 1000) +, ? +, ?
COOP R&D co-operation (yes/no; dummy variable) n.s. +
Locations-specific advantages
CHLOC Share of firms assessing Switzerland as an unattractive location for
investments (score 4 or 5 on a 5-point Likert scale); 3-digit industry level n.s. +
QLAB Share of firms confronted with difficulties in hiring qualified manpower
(score 4 or 5 on a 5-point Likert scale); 3-digit industry level n.s. +
WAGE Share of firms with “reducing wage bill” as an important objective of innovation
activity (score 4 or 5 on a 5-point Likert scale); 3-digit industry level n.s. +
Market conditions
IPC Share (%) of firms confronted with strong price competition
(assessments on a 5-point Likert scale: score 4 and 5; 3-digit industry level) (–) ?
INPC Share (%) of firms confronted with strong non-price competition
(assessments on a 5-point Likert scale: score 4 and 5; 3-digit industry level) ? ?
CONC Share (%) of firms with less than 10 principal competitors in the world
market (3-digit industry level) ? ?
GROW Share of firms with above average growth of their markets in the period
1994–99 (3-digit industry level) + +
Control variables
FOR Affiliated to a foreign parent firm (yes/no; dummy variable) ? ?
Industry Food; textiles/clothing; wood/paper/metals/non-metallic mineral products;
affiliation pharmaceuticals/chemicals/plastics; metal products; machinery/vehicles;
(dummies) electrical machinery/electronics/instruments; construction; wholesaling;
transport/telecommunication; banking/insurance; IT-/R&D services; business services (with “other manufacturing/ “other services” as
scale effects, its square (L2). As far as firm size is concerned, we have to keep in mind that it does not only represent O-advantages but, as set out below, it also captures I-advantages. These dif-ferent roles of firm size can hardly be disentan-gled at the empirical level; therefore, one has to be cautious in interpreting estimates regarding this variable.
L-advantages are captured by three variables, which are expected to influence the choice of strategy FA, but not that of X, since this strategy is not a suitable means for compensating disad-vantages of Swiss locations. The first and the second measure of L-advantages refer to labour input. In case of Switzerland, which is charac-terised by low unemployment, difficulties in recruiting qualified manpower (QLAB) and high labour costs (WAGE) are assumed to be an incen-tive for firms to invest in countries which are more favourable in these respects (positive sign expec-tation). The third L-variable (CHLOC) is an overall measure of disadvantages of Switzerland as a location for investments (assessment of the respondents of the Swiss investment survey 1998). The less attractive Swiss locations are (high values of CHLOC), the higher is the propensity to invest abroad. A regression of CHLOC on a set of specific location variables (in particular: regula-tory framework, level of taxation/subsidies, con-straints with respects to investment financing, high cost level in general) yielded a very good fit; as a consequence, the overall measure CHLOC seems to be an appropriate L-variable. The three location-specific measures cover, with some exceptions, all L-specific factors mentioned in Section 3 (motives for going abroad) and Section 4.2 (theoretical considerations). L-variables are measured, in a similar way as DPD, at the 3-digit industry level. It is thus assumed that the attrac-tiveness of Switzerland differs across 3-digit cat-egories, but is the same for all firms affiliated to a specific 3-digit industry.
With respect to I-advantages, we assume that large firms are in a better position than small companies to reduce transaction costs through internalising some of the (external) market rela-tionships. Moreover, we use a firm’s propensity to co-operate with other firms as a second measure of I-advantages (COOP: share of co-operating firms at the 3-digit industry level).12Since the data
at hand did not allow to measure I-advantages more specifically (e.g. taking into account, for example, I-advantages related to “reducing uncer-tainty with respect to the quality of key compo-nents”), we only can rely on these two rough proxies. For this reason, and because firm size stands also for some O-advantages, it will be dif-ficult to identify unambiguously the importance of I-advantages. We expect that this type of advan-tages only is relevant in case of strategy FA; however, one has to keep in mind that firm size, since it also represents certain O-effects, might turn out to be positive in case of X as well.
A further set of variables is used to characterise a firm’s market conditions. We use them as control variables, assuming that a firm’s decision to under-take international activities is not independent of the market environment in which it operates. High intensity of price competition (IPC) might favour cost-reducing foreign operations (active strategy); however, it might also lead to passive adjustment strategies (e.g. closing-down of part of production facilities and specialising on high-end products). The sign of IPC is thus an empirical matter in case of strategy FA; with respect to X, one might even expect a negative sign (disadvantage of Switzerland in case of price-sensitive tradable products). Whether a high intensity of non-price competition (INPC) induces international engage-ments, has also to be decided at the empirical level. In some cases, it is advantageous to cen-tralise production and marketing of high quality products at home (positive sign for X, negative or insignificant for FA); in other instances, it may be necessary to be present at foreign locations to adjust the product to local market conditions (no impact in case of X, positive sign for FA). A priori, the sign of market concentration (CONC) is indeterminate too. Oligopolistic competition may require a direct presence on the most impor-tant markets; high (world) market concentration, however, may also deter firms from internation-alising their activities. Concentration is measured at world scale by using information on the number of principal competitors wherever these are located. Favourable prospects for market growth (GROW), measured by the firms’ assessment of the development of demand on the “relevant” markets over the nineties, should exert a positive influence on international activities (pull effect for
exports, incentive to exploit market opportunities by being present at foreign locations). The four variables we use to capture a firm’s market envi-ronment are measured at the 3-digit level (136 industries), which is assumed to represent the relevant markets.
Finally, we inserted a variable which controls for the characteristic “affiliate of a foreign company” (FOR). The sign of this variable is an empirical matter. It could be negative reflecting the fact that foreign-owned firms may be estab-lished in Switzerland to serve exclusively the domestic market. However, the opposite may also be true, since foreign-owned firms may deliver intermediate products to their mother company (positive sign with respect to X), or they may be regional headquarters of a foreign multinational company, responsible for serving specific inter-national markets (primarily European ones) through exports or sales of (sub-)affiliates at foreign (European) locations (positive sign of X and FA). We also inserted thirteen industry dummies to avoid an omitted variable bias.
4.3. Empirical results Model I
The results from estimating model I, which explains the probability of a firm choosing strategy X (“serving foreign markets through exports without direct presence abroad”), FA (“direct engagements at foreign locations in addition to exports”), or H (“domestic sales only”) are presented in Table VII. The model which yields parameter estimates for the strategies X and FA respectively, evaluated against the reference group H, fits the data quite well for the entire sample and the three size-specific sub-samples.
For each (sub-)sample, the model estimates show very clearly that O-advantages are the main driver of internationalisation. Not surprisingly, the more far-reaching strategy FA is stronger related to O-advantages than strategy X.13L-advantages also exert an influence on both types of interna-tionalisation, what is consistent with the model in case of strategy FA, whereas for strategy X one would expect insignificant parameter estimates. With respect to I-advantages, represented by firm size and its square (L, L2) and co-operation COOP,
the results are mixed. Whereas the size effects correspond to the predictions of the model, the positive sign of COOP in case of strategy X is not in line with our expectations (probably reflecting the specification problem mentioned in note 12). In addition, we find evidence for an impact on FA and X of some of the control variables (market conditions, foreign ownership). Besides, there are considerable industry effects (which are not reported in the table). If industry dummies are excluded from the model, the positive effect of high wage costs (WAGE) on engagements at foreign locations increases, and the parameter of physical capital (CL) becomes significantly negative. L-advantages might thus be somewhat more relevant than shown in Table VII. Taken as a whole, the results confirm the OLI paradigm in case of strategy FA. With respect to strategy X, the dominant role of O-advantages we hypothe-sised is corroborated; in this case, however, we also find some implausible effects (L-advantages, COOP).
A more detailed inspection of the model esti-mates based on the whole sample (columns 1 and 2 of the table) shows that all O-advantages – except capital intensity CL – significantly increase the probability of direct foreign engagements; in case of export strategies, only the innovation-related variables RD, DPD, INNOPD are relevant. Besides, we note that, in quantitative terms, inno-vative capabilities have a higher impact on the more far-reaching strategy FA than on X. The significant positive effects on FA, we find for the productivity measure QL and for firm size L confirm the strong impact of O-advantages. The fact that HC and the innovation-related explana-tory variables also capture some unspecified O-advantages underlines the importance of this type of capabilities as drivers of internationalisation.
We find an impact of firm size only up to a certain threshold (negative sign of the quadratic term), and only in case of strategy FA. Co-opera-tion (COOP), the second measure of I-advantages, is statistically significant only for strategy X (what is not very plausible). In view of the difficulties encountered in specifying I-advantages, the model estimates with respect to this type of advantages may not be taken at face value.
As far as L-advantages are concerned, we find that high wages in Switzerland (WAGE) as well
TABLE VII
Model I: Firms with export sales (X) and companies with, additionally, other foreign activities (FA), evaluated against firms
with domestic sales only (reference group: H) (multinomial logit estimates)a, b
Explanatory All firms Small firms Medium-sized firms Large firms
variableb
(< 50 employees) (50–199 employees) (≥ 200 employees)
X FA X FA X FA X FA O-advantages QL 1.41 4.97*** 0.122 4.20** 4.20 6.13** –1.39 1.02 (1.5) (1.3) (2.1) (1.9) (2.8) (2.7) (4.2) (2.8) HC –0.215 1.78*** 0.359 2.26*** –0.747 2.74*** 1.63 2.83*** (0.38) (0.34) (0.36) (0.46) (0.92) (0.76) (1.2) (1.1) CL –1.14 –2.47 –0.281 –3.81* –1.72 –1.19 1.59 6.76* (1.7) (1.6) (2.3) (2.2) (3.7) (3.5) (5.1) (3.8) RD 1.00*** 1.73*** 0.632*** 1.32*** 1.15*** 1.91*** 1.34*** 2.23*** (0.14) (0.13) (0.21) (0.21) (0.25) (0.24) (0.39) (0.34) DPD 0.010* 0.012** 0.014 0.003 0.020* 0.035*** –0.014 –0.009 (0.01) (0.01) (0.01) (0.01 (0.01) (0.01) (0.02) (0.02) INNOPD 0.298** 1.01*** 0.328* 1.00*** 0.161 0.883*** 0.224 1.01*** (0.13) (0.13) (0.18) (0.21) (0.23) (0.24) (0.39) (0.36) Firm size/I–advantages L 0.048 0.798*** 100*** 57.3* 41.0*** 62.3*** 0.471 0.293 (0.25) (0.18) (29) (30) (16) (16) (0.68) (0.21) L2 –0.000 –0.000*** –1.64*** –0.657 –0.170** –0.262*** –0.000 –0.000 (0.00) (0.00) (0.56) (0.60) (0.07) (0.07) (0.00) (0.00) COOP 0.016*** 0.003 0.005 –0.006 0.024** 0.007 0.047*** 0.009 (0.01) (0.01) (0.01) (0.01) (0.01) (0.01) (0.01) (0.01) L–advantages CHLOC 0.020*** 0.013* 0.019* 0.030** 0.021* 0.009 0.004 0.004 (0.01) (0.01) (0.01) (0.01) (0.01) (0.01) (0.02) (0.02) QLAB 0.016** 0.008 0.010 0.006 0.021* 0.014 0.031 0.002 (0.01) (0.01) (0.01) (0.01) (0.01) (0.01) (0.02) (0.02) WAGE 0.001 0.016*** –0.009 0.027*** 0.014 0.009 0.036* 0.030* (0.01) (0.01) (0.01) (0.01) (0.01) (0.01) (0.02) (0.02) Market conditions IPC –0.002 0.007 0.006 0.004 –0.010 0.008 –0.034* 0.022 (0.01) (0.01) (0.01) (0.01) (0.01) (0.01) (0.02) (0.02) INPC –0.007 –0.015*** –0.004 –0.018** –0.005 –0.012 –0.008 –0.020 (0.00) (0.01) (0.01) (0.01) (0.01) (0.01) (0.02) (0.01) CONC –0.018*** –0.015*** –0.013 –0.012 –0.031*** –0.021** –0.025 –0.012 (0.01) (0.01) (0.01) (0.01) (0.01) (0.01) (0.02) (0.01) GROW 0.011** 0.010** 0.024*** 0.018** –0.004 –0.002 0.008 –0.002 (0.00) (0.00) (0.01) (0.01) (0.01) (0.01) (0.01) (0.01) Control variable FOR 0.488*** 0.304* 0.330 0.798*** 0.115 –0.205 1.06** –0.200 (0.17) (0.17) (0.28) (0.29) (0.32) (0.32) (0.42) (0.42) Statistics N 2424 1072 882 470 McFadden R2 0.222 0.189 0.273 0.368 a
The multinomial logit model estimates for each explanatory variable several slope parameters (i.e. number of response levels minus 1), which allows to evaluate which responses differ significantly from the reference level. In the present case, we distin-guish three response levels, i.e. firms with domestic sales only (reference level H), those with export sales (level X) and those which, in addition to export sales, are engaged abroad with business functions like production, distribution, R&D, etc. (level FA). b
The estimates of the intercepts and the industry dummies have been throughout omitted. The significance of the parameters is indicated with ***, ** and * resp. representing the 1%, 5%- and 10%-level with standard errors in brackets.
as “insufficient attractiveness of this country as a location for investment” (CHLOC) provoke firms to become active in other countries. The positive signs of CHLOC and QLAB (insufficient supply of qualified labour) in case of strategy X do not comply with the expectations.
With respect to market conditions, we find that market growth (GROW), as expected, exerts a positive influence on internationalisation. The intensity of price competition (IPC) has no statis-tically significant impact; active and passive strategies to evade price competition seem thus to neutralise each other. The negative sign of market concentration (CONC), measured at world scale, indicates that the deterring effect of international competition is stronger than the impact of oli-gopolistic competition driving firms to engage directly on the most important foreign markets. There is no convincing explanation for the results concerning non-price competition (INPC). Finally, we find that foreign owned firms (FOR) are more often internationalised than Swiss companies, in particular in case of export strategies. The role of Switzerland as a base for serving foreign (mostly European) markets seems to weigh more, on balance, than the fact that selling on the Swiss market, in some instances, is the main objective of foreign ownership.
In the following we ask, whether we can detect, in terms of the explanatory variables of our model, patterns of explanation which differ between the three firm size classes distinguished in this paper. Although O-advantages are the most important variables explaining internationalisation irrespec-tive of the firm size class considered, there are, indeed, some differences between small, medium-sized and large firms (Table VII, columns 3 to 8). Firstly, L-advantages as an incentive to go abroad are most important in case of small com-panies (WAGE, CHLOC), presumably reflecting offensive adjustment strategies. High wage costs seem to play some role, though a rather weak one, for large firms as well. However, we cannot find statistically significant L-effects in case of medium-sized companies. If industry dummies are dropped, L-variables also become significant for this category of firms; in addition, the magnitude of L-effects becomes larger for both small and big firms. Furthermore, we find that capital intensity is negatively related to direct presence abroad in
case of small firms (labour-intensive firms go international), what is consistent with the results referring to L-advantages.
Secondly, the three size classes are charac-terised, in qualitative terms, by a similar pattern of O-advantages influencing strategy FA, with human capital and innovation-related capabilities building the common core of explanation (to a lesser extent, the same holds true for strategy X). In quantitative terms, however, the various O-advantages partly differ in importance among the size categories. The impact of knowledge- and innovation-related factors is stronger in case of large and medium-sized firms than for of small companies. The latter use more intensively their ability to generate (incremental) product innova-tions, whereas the capacity to produce more fun-damental (R&D-based) innovations is crucial in case of both large and medium-sized firms, for which development-oriented capabilities (DPD) are another important asset.
Thirdly, we also find size effects for two of the three sub-samples (SMEs). From the fact that firm size is not significant in the large-firm sub-sample we conclude that beyond a threshold of about 200 employees firm size does not exert an independent influence on internationalisation anymore. How-ever, firm size still may have some indirect effect, that is through other variables of the model (e.g. big firms disposing of a larger amount of firm-specific assets such as knowledge capital than SMEs).
Finally, market conditions exert an influence on internationalisation in case of small and (to a weaker extent) medium-sized companies, but with different variables playing a role. Foreign owner-ship is relevant in case of small as well as large firms, with different effects on the two interna-tionalisation strategies.
Summing up, we find that the basic pattern of variables explaining internationalisation does not much differ among firm size classes. The OL-part of the OLI paradigm is confirmed in all three size categories as far as strategy FA is concerned. O-advantages are the core explanatory for both internationalisation strategies. The most prominent difference among the three firm size classes are the following: firstly, L-advantages are provoking engagements at foreign locations primarily in case of small firms (for a similar result in case of Japan,
see Urata and Kawai, 2000); secondly, size-specific differences exist, but they are a matter of degree (different magnitude of effects) rather than of substance (similar pattern of O-advantages).14 Model II
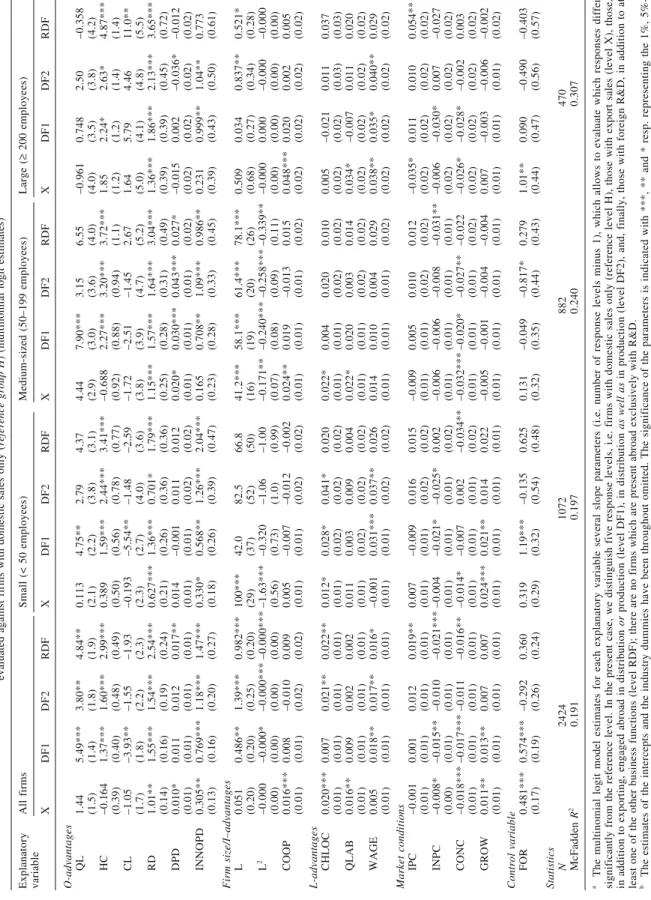
In practice, the choice of strategy FA is more differentiated; firms decide among some sub-strategies of FA (e.g. foreign production vs. foreign-based distribution affiliates). Therefore, we subdivide strategy FA, based on the number of business functions located in foreign countries, into three categories, that is: DF1 (distribution/ other activities or production/procurement), DF2 (distribution/other activities and production/ procurement) and, finally, RDF (foreign R&D complementing activities already covered by DF1 or DF2). Estimation of a multinomial logit model yields parameters for the strategies X, DF1, DF2 and RDF, which again are evaluated against the reference strategy H (“domestic sales only”). The results presented in Table VIII show that model II fits the data quite well. In what follows, the most important results are summarised.
Firstly, we find that the OLI paradigm (at least the OL-part) is supported by estimates based on the whole sample as well as two size-specific sub-samples (small and large firms respectively); in case of medium-sized firms, we do not find evidence for L-advantages; however, as in model I, some of the L-variables become significant when industry dummies are dropped. Besides, we get the same pattern in estimates referring to the strategies DF1 and DF2. In case of RDF, we can identify positive L-effects only on the basis of the whole sample. O-advantages are clearly the dominant element of explanation. For reasons already mentioned, we do not get reliable results with respect to I-advantages. Nevertheless, the findings, on the whole, are quite in line with the OLI framework (as it is also the case for model I estimates).
Secondly, we compare, in quantitative terms, the impact of the O-variables as a whole across the four strategies (Table VIII: column 1 vs. 2 vs. 3 vs. 4 (all firms); 5 vs. 6 vs. 7 vs. 8 (small firms); etc.). The estimates based on the whole sample show that strategy RDF draws on firm-specific capabilities to a higher extent than the other strate-gies. This result is not very surprising, since RDF
is the most developed internationalisation strategy (if the number of types of foreign engagements is taken as criterion). The strategies DF1 and DF2 are quite similar with respect to the magnitude of O-advantages. The three strategies based on a (direct) engagement at foreign locations (RDF, DF1, DF2) rely more intensively on firm-specific capabilities than the X-strategy (internationalisa-tion exclusively through export sales). Besides, in each size-class, we find the same ranking of the four internationalisation strategies in terms of the intensity of O-effects as for the economy as a whole.
Thirdly, the weight of the individual O-vari-ables is not the same for each internationalisation strategy. In the whole sample, the RDF strategy relies, compared to the other strategies, to a par-ticular large extent on human capital as well as on R&D- and development-related capabilities. The capacity to generate incremental innovations is more relevant for the DF2-strategy. The same holds, though not to the same extent, for firms embarked on a DF1-strategy, which, in addition, are labour-intensive. Finally, X-strategies rest, in comparison to the more far-reaching strategies, primarily on innovation-related assets, whereas human capital is not much used, even not to a higher extent than it is the case for domestically-oriented firms.
Finally, we compare the internationalisation strategies by firm size classes in the same way as we did in the previous paragraph, that is we look at the relative importance of the individual O-vari-ables. In case of RDF, for example, we find that medium-sized firms show quite the same pattern of O-advantages as the average firm of the economy as a whole. RDF-strategies pursued by small companies, however, exploit – to a higher extent than firms of the other size classes – their capability to generate incremental innovations. The RDF strategy of large firms is strongly focused on R&D, human and physical capital. With regard to the other strategies, we observe, in general, that small firms rely, in relative terms, quite strongly on capabilities leading to incre-mental innovations, whereas medium-sized and large firms can make use of a broader knowledge-base pertaining to all types of innovation-related assets (RD, DPD, INNOPD) as well as to human capital.
TABLE VIII
Model II:
Firms with export sales (X) and three other groups of firms characterised by specific combinations of additional foreign activi
ties (DF1, DF2, RDF),
evaluated against firms with domestic sales only (
reference group H
) (multinomial logit estimates)
a, b Explanatory All firms Small (< 50 employees) Medium-sized (50–199 employees) Large ( ≥ 200 employees) variable X D F1 DF2 RDF X DF1 DF2 RDF X DF1 DF2 RDF X DF1 DF2 RDF O-advantages QL 1.44 5.49*** 3.80** 4.84** 0.113 4.75** 2.79 4.37 4.44 7.90*** 3.15 6.55 –0.961 0.748 2.50 –0.358 (1.5) (1.4) (1.8) (1.9) (2.1) (2.2) (3.8) (3.1) (2.9) (3.0) (3.6) (4.0) (4.0) (3.5) (3.8) (4.2) HC –0.164 1.37*** 1.60*** 2.99*** 0.389 1.59*** 2.44*** 3.41*** –0.688 2.27*** 3.20*** 3.72*** 1.85 2.24* 2.63* 4.87*** (0.39) (0.40) (0.48) (0.49) (0.50) (0.56) (0.78) (0.77) (0.92) (0.88) (0.94) (1.1) (1.2) (1.2) (1.4) (1.4) CL –1.05 –3.93** –1.55 –1.93 –0.193 –5.54** –1.48 –2.59 –1.72 –2.51 –1.45 2.67 1.64 5.79 4.46 11.0** (1.7) (1.8) (2.2) (2.3) (2.3) (2.7) (4.0) (3.6) (3.8) (3.9) (4.7) (5.2) (5.0) (4.1) (4.8) (5.5) RD 1.01** 1.55*** 1.54*** 2.54*** 0.627*** 1.36*** 0.701* 1.79*** 1.15*** 1.57*** 1.64*** 3.04*** 1.36*** 1.86*** 2.13*** 3.65*** (0.14) (0.16) (0.19) (0.24) (0.21) (0.26) (0.36) (0.36) (0.25) (0.28) (0.31) (0.49) (0.39) (0.39) (0.45) (0.72) DPD 0.010* 0.011 0.012 0.017** 0.014 –0.001 0.011 0.012 0.020* 0.030*** 0.043*** 0.027* –0.015 0.002 –0.036* –0.012 (0.01) (0.01) (0.01) (0.01) (0.01) (0.01) (0.02) (0.02) (0.01) (0.01) (0.01) (0.02) (0.02) (0.02) (0.02) (0.02) INNOPD 0.305** 0.769*** 1.18*** 1.47*** 0.330* 0.568** 1.26*** 2.04*** 0.165 0.708** 1.09*** 0.986** 0.231 0.999** 1.04** 0.773 (0.13) (0.16) (0.20) (0.27) (0.18) (0.26) (0.39) (0.47) (0.23) (0.28) (0.33) (0.45) (0.39) (0.43) (0.50) (0.61) Firm size/I–advantages L 0.051 0.486** 1.39*** 0.982*** 100*** 42.0 82.5 66.8 41.2*** 58.1*** 61.4*** 78.1*** 0.509 0.034 0.837** 0.521* (0.20) (0.20) (0.25) (0.20) (29) (37) (52) (50) (16) (19) (20) (26) (0.68) (0.27) (0.34) (0.28) L 2 –0.000 –0.000* –0.000*** –0.000*** –1.63*** –0.320 –1.06 –1.00 –0.171** –0.240*** –0.258*** –0.339** –0.000 0.000 –0.000 –0.000 (0.00) (0.00) (0.00) (0.00) (0.56) (0.73) (1.0) (0.99) (0.07) (0.08) (0.09) (0.11) (0.00) (0.00) (0.00) (0.00) COOP 0.016*** 0.008 –0.010 0.009 0.005 –0.007 –0.012 –0.002 0.024** 0.019 –0.013 0.015 0.048*** 0.020 0.002 0.005 (0.01) (0.01) (0.02) (0.02) (0.01) (0.01) (0.02) (0.02) (0.01) (0.01) (0.01) (0.02) (0.02) (0.02) (0.02) (0.02) L-advantages CHLOC 0.020*** 0.007 0.021** 0.022** 0.012* 0.028* 0.041* 0.020 0.022* 0.004 0.020 0.010 0.005 –0.021 0.011 0.037 (0.01) (0.01) (0.01) (0.01) (0.01) (0.02) (0.02) (0.02) (0.01) (0.01) (0.02) (0.02) (0.02) (0.02) (0.03) (0.03) QLAB 0.016** 0.009 0.002 0.002 0.011 0.003 0.009 0.004 0.022* 0.020 0.003 0.014 0.034* –0.007 0.011 0.020 (0.01) (0.01) (0.01) (0.01) (0.01) (0.02) (0.02) (0.02) (0.01) (0.01) (0.02) (0.02) (0.02) (0.02) (0.02) (0.02) WAGE 0.005 0.018** 0.017** 0.016* –0.001 0.031*** 0.037** 0.026 0.014 0.010 0.004 0.029 0.038** 0.035* 0.040** 0.029 (0.01) (0.01) (0.01) (0.01) (0.01) (0.01) (0.02) (0.02) (0.01) (0.01) (0.01) (0.02) (0.02) (0.02) (0.02) (0.02) Market conditions IPC –0.001 0.001 0.012 0.019** 0.007 –0.009 0.016 0.015 –0.009 0.005 0.010 0.012 –0.035* 0.011 0.010 0.054** (0.01) (0.01) (0.01) (0.01) (0.01) (0.01) (0.02) (0.02) (0.01) (0.01) (0.02) (0.02) (0.02) (0.02) (0.02) (0.02) INPC –0.008* –0.015** –0.010 –0.021*** –0.004 –0.021* –0.025* 0.002 –0.006 –0.006 –0.008 –0.031** –0.006 –0.030* 0.007 –0.027 (0.00) (0.01) (0.01) (0.01) (0.01) (0.01) (0.01) (0.02) (0.01) (0.01) (0.01) (0.01) (0.02) (0.02) (0.02) (0.02) CONC –0.018*** –0.017*** –0.011 –0.016** –0.014* –0.007 0.002 –0.034** –0.032*** –0.020* –0.027** –0.022 –0.026* –0.028* –0.002 0.003 (0.01) (0.01) (0.01) (0.01) (0.01) (0.01) (0.01) (0.02) (0.01) (0.01) (0.01) (0.02) (0.02) (0.02) (0.02) (0.02) GROW 0.011** 0.013** 0.007 0.007 0.024*** 0.021** 0.014 0.022 –0.005 –0.001 –0.004 –0.004 0.007 –0.003 –0.006 –0.002 (0.01) (0.01) (0.01) (0.01) (0.01) (0.01) (0.01) (0.01) (0.01) (0.01) (0.01) (0.01) (0.01) (0.01) (0.01) (0.02) Control variable FOR 0.481*** 0.574*** –0.292 0.360 0.319 1.19*** –0.135 0.625 0.131 –0.049 –0.817* 0.279 1.01** 0.090 –0.490 –0.403 (0.17) (0.19) (0.26) (0.24) (0.29) (0.32) (0.54) (0.48) (0.32) (0.35) (0.44) (0.43) (0.44) (0.47) (0.56) (0.57) Statistics N 2424 1072 882 470 McFadden R 2 0.191 0.197 0.240 0.307 a
The multinomial logit model estimates for each explanatory variable several slope parameters (i.e. number of response levels mi
nus 1), which allows to evaluate which responses differ
significantly from the reference level. In the present case, we distinguish five response levels, i.e. firms with domestic sale
s only (reference level H), those with export sales (level X), those,
in addition to exporting, engaged abroad in distribution
or
production (level DF1), in distribution
as well as
in production (level DF2), and, finally, those with foreign R&D, in addition to at
least one of the other business functions (level RDF); there are no firms which are present abroad exclusively with R&D. b
The estimates of the intercepts and the industry dummies have been throughout omitted. The significance of the parameters is in
dicated with ***, ** and * resp. representing the 1%,
Summing up, we find that, in accordance with model I, the OLI-framework is more or less confirmed (keeping in mind the specification problems with respect to I-advantages). The various internationalisation strategies can be ranked according to the extent they draw on firm-specific capabilities. The (fully-deployed) strategy RDF takes the place at the top of the ladder, and the X-strategy comes last. DF1 and DF2 do not much differ in terms of O-advantages, which are the driver of internationalisation; as a conse-quence, one could merge them into one category. This result holds true quite independently of the firm size-class considered. The most important size-specific difference we find pertains to the orientation of the knowledge base firms are drawing on. Small firms, among them many labour intensive ones, rely, in relative terms, more on application-oriented capabilities, which are used to produce, in the first instance, incremental inno-vations. Medium-sized and, even to a higher extent, large firms can make use of a broader knowledge-base composed of a large amount of human capital and research-/development-oriented assets.
5. Conclusions
In the descriptive part of the paper, we docu-mented, firstly, the high degree of internationali-sation of the Swiss economy. Over the last decade, SMEs and services firms exhibited a particularly high increase of direct engagements at foreign locations. Secondly, some important hypotheses put forward in the SME-oriented internationalisa-tion literature have been confirmed, based on a more representative database than it is used in most other studies (large sample covering the whole private sector of the economy). To mention are, in particular, the relevance of various types of constraints SMEs are confronted with when expanding internationally (deficiency of finance, insufficient management capacity, etc.), and the firm’s choice of the ownership mode of entering foreign markets (preference of SMEs for contrac-tual as against equity-based arrangements). Thirdly, it is shown that there is a significant proportion of firms, even small ones, which, in addition to exporting goods/services, deploy at foreign locations several business functions
such as distributive activities, production, R&D, etc.
The second part of this contribution focuses on explaining the probability of a firm choosing a specific internationalisation strategy with “firms staying at home” as reference group. In a first model, we distinguished two “states” of interna-tionalisation, that is (a) firms serving foreign markets without a presence in foreign countries, (b) firms which, additionally, are directly engaged at foreign locations. In the second model, the strategy involving a foreign presence is differen-tiated into three sub-categories based on combi-nations of business functions a firm locates abroad: “distribution/similar activities” or pro-duction/procurement”; “distribution/similar activ-ities” and production/procurement”; “R&D in addition to one of the first two categories”.
The econometric estimates confirmed that large firms more often tend to internationalise their activities than smaller companies; however, size matters only up to a certain threshold (firms with 200 employees), and is merely relevant in case of strategies involving a direct presence at foreign locations. The model estimates, to a large extent, are consistent with the OLI paradigm in case of a direct foreign engagement; as far as the strategy of “exporting only” is concerned, as expected, only the O-part is relevant. O-advantages, that is several types of innovation-related capabilities, human capital and some unspecified firm-specific assets in fields like marketing, organisation, finance (captured by productivity, firm size and – indirectly – through human capital and R&D expenditures), turned out to be the most important drivers of internationalisation (irrespective of firm size and type of strategy). L-disadvantages of Switzerland are a substantial incentive for engaging abroad in case of small firms. This holds true, to a lesser extent, for large companies too, whereas the evidence for L-effects in case of medium-sized companies is weak. We did not succeed to assess unambiguously the importance of I-advantages reflecting difficulties of finding suitable measures.
The results pertaining to O-advantages showed a clear ranking among different internationalisa-tion strategies in terms of the amount of the various firm-specific assets a firm disposes of. The larger a firm’s stock of specific assets and