Two sub-states of the red2 state of methyl-coenzyme M reductase revealed by high-field EPR spectroscopy
9
0
0
Texte intégral
Figure
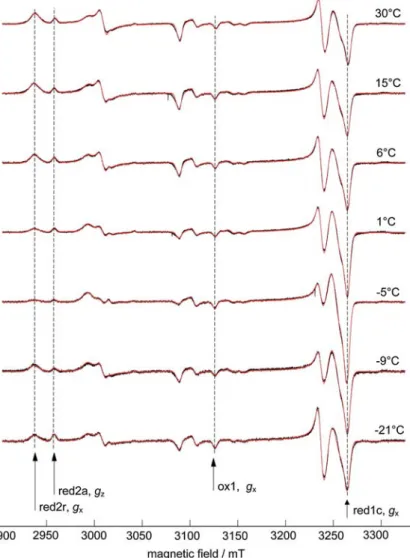
![Figure 2 also features spectral simulations of the dif- dif-ferent components that contribute to the overall signal (the g values are in good agreement with previously reported values [20] and are summarized in Table 1).](https://thumb-eu.123doks.com/thumbv2/123doknet/14835478.622004/4.892.109.398.565.986/features-spectral-simulations-components-contribute-agreement-previously-summarized.webp)
Documents relatifs