Calculus Volume 3
SENIOR CONTRIBUTING AUTHORS
EDWIN "JED" HERMAN, UNIVERSITY OF WISCONSIN-STEVENS POINT
G
ILBERT
S
TRANG
,
M
ASSACHUSETTS
I
NSTITUTE OF
T
ECHNOLOGY
OpenStax Rice University
6100 Main Street MS-375 Houston, Texas 77005
To learn more about OpenStax, visit https://openstax.org.
Individual print copies and bulk orders can be purchased through our website.
©2018 Rice University. Textbook content produced by OpenStax is licensed under a Creative Commons Attribution Non-Commercial ShareAlike 4.0 International License (CC BY-NC-SA 4.0). Under this license, any user of this textbook or the textbook contents herein can share, remix, and build upon the content for noncommercial purposes only. Any adaptations must be shared under the same type of license. In any case of sharing the original or adapted material, whether in whole or in part, the user must provide proper attribution as follows:
- If you noncommercially redistribute this textbook in a digital format (including but not limited to PDF and HTML), then you must retain on every page the following attribution:
“Download for free at https://openstax.org/details/books/calculus-volume-3.”
- If you noncommercially redistribute this textbook in a print format, then you must include on every physical page the following attribution:
“Download for free at https://openstax.org/details/books/calculus-volume-3.”
- If you noncommercially redistribute part of this textbook, then you must retain in every digital format page view (including but not limited to PDF and HTML) and on every physical printed page the following attribution: “Download for free at https://openstax.org/details/books/calculus-volume-3.”
- If you use this textbook as a bibliographic reference, please include https://openstax.org/details/books/calculus-volume-3 in your citation.
For questions regarding this licensing, please contact [email protected].
Trademarks
The OpenStax name, OpenStax logo, OpenStax book covers, OpenStax CNX name, OpenStax CNX logo, OpenStax Tutor name, Openstax Tutor logo, Connexions name, Connexions logo, Rice University name, and Rice University logo are not subject to the license and may not be reproduced without the prior and express written consent of Rice University.
PRINT BOOK ISBN-10 1-938168-07-0
PRINT BOOK ISBN-13 978-1-938168-07-9
PDF VERSION ISBN-10 1-947172-16-6
PDF VERSION ISBN-13 978-1-947172-16-6
Revision Number C3-2016-003(03/18)-MJ
O
PENS
TAXOpenStax provides free, peer-reviewed, openly licensed textbooks for introductory college and Advanced Placement® courses and low-cost, personalized courseware that helps students learn. A nonprofit ed tech initiative based at Rice University, we’re committed to helping students access the tools they need to complete their courses and meet their educational goals.
R
ICEU
NIVERSITYOpenStax, OpenStax CNX, and OpenStax Tutor are initiatives of Rice University. As a leading research university with a distinctive commitment to undergraduate education, Rice University aspires to path-breaking research, unsurpassed teaching, and contributions to the betterment of our world. It seeks to fulfill this mission by cultivating a diverse community of learning and discovery that produces leaders across the spectrum of human endeavor.
F
OUNDATIONS
UPPORTOpenStax is grateful for the tremendous support of our sponsors. Without their strong engagement, the goal of free access to high-quality textbooks would remain just a dream.
Laura and John Arnold Foundation (LJAF) actively seeks opportunities to invest in organizations and thought leaders that have a sincere interest in implementing fundamental changes that not only yield immediate gains, but also repair broken systems for future generations. LJAF currently focuses its strategic investments on education, criminal justice, research integrity, and public accountability.
The William and Flora Hewlett Foundation has been making grants since 1967 to help solve social and environmental problems at home and around the world. The Foundation concentrates its resources on activities in education, the environment, global development and population, performing arts, and philanthropy, and makes grants to support disadvantaged communities in the San Francisco Bay Area.
Calvin K. Kazanjian was the founder and president of Peter Paul (Almond Joy), Inc. He firmly believed that the more people understood about basic economics the happier and more prosperous they would be. Accordingly, he established the Calvin K. Kazanjian Economics Foundation Inc, in 1949 as a philanthropic, nonpolitical educational organization to support efforts that enhanced economic understanding.
Guided by the belief that every life has equal value, the Bill & Melinda Gates Foundation works to help all people lead healthy, productive lives. In developing countries, it focuses on improving people’s health with vaccines and other life-saving tools and giving them the chance to lift themselves out of hunger and extreme poverty. In the United States, it seeks to significantly improve education so that all young people have the opportunity to reach their full potential. Based in Seattle, Washington, the foundation is led by CEO Jeff Raikes and Co-chair William H. Gates Sr., under the direction of Bill and Melinda Gates and Warren Buffett.
The Maxfield Foundation supports projects with potential for high impact in science, education, sustainability, and other areas of social importance.
Our mission at The Michelson 20MM Foundation is to grow access and success by eliminating unnecessary hurdles to affordability. We support the creation, sharing, and proliferation of more effective, more affordable educational content by leveraging disruptive technologies, open educational resources, and new models for collaboration between for-profit, nonprofit, and public entities.
Access. The future of education.
OpenStax.org
I like free textbooks
and I cannot lie.
to OpenStax and
we’ll send you a
sticker!
OpenStax is a nonprofit initiative, which means that that every dollar you give helps us maintain and grow our library of free textbooks.
If you have a few dollars to spare, visit OpenStax.org/give to donate.
We’ll send you an OpenStax sticker to thank you for your support!
Preface . . . 1
Chapter 1: Parametric Equations and Polar Coordinates . . . 7
1.1 Parametric Equations . . . 8
1.2 Calculus of Parametric Curves . . . 27
1.3 Polar Coordinates . . . 44
1.4 Area and Arc Length in Polar Coordinates . . . 64
1.5 Conic Sections . . . 73
Chapter 2: Vectors in Space . . . 101
2.1 Vectors in the Plane . . . 102
2.2 Vectors in Three Dimensions . . . 123
2.3 The Dot Product . . . 146
2.4 The Cross Product . . . 165
2.5 Equations of Lines and Planes in Space . . . 186
2.6 Quadric Surfaces . . . 211
2.7 Cylindrical and Spherical Coordinates . . . 228
Chapter 3: Vector-Valued Functions . . . 259
3.1 Vector-Valued Functions and Space Curves . . . 260
3.2 Calculus of Vector-Valued Functions . . . 270
3.3 Arc Length and Curvature . . . 283
3.4 Motion in Space . . . 305
Chapter 4: Differentiation of Functions of Several Variables . . . 333
4.1 Functions of Several Variables . . . 334
4.2 Limits and Continuity . . . 352
4.3 Partial Derivatives . . . 369
4.4 Tangent Planes and Linear Approximations . . . 389
4.5 The Chain Rule . . . 406
4.6 Directional Derivatives and the Gradient . . . 422
4.7 Maxima/Minima Problems . . . 438
4.8 Lagrange Multipliers . . . 458
Chapter 5: Multiple Integration . . . 477
5.1 Double Integrals over Rectangular Regions . . . 478
5.2 Double Integrals over General Regions . . . 501
5.3 Double Integrals in Polar Coordinates . . . 526
5.4 Triple Integrals . . . 546
5.5 Triple Integrals in Cylindrical and Spherical Coordinates . . . 566
5.6 Calculating Centers of Mass and Moments of Inertia . . . 592
5.7 Change of Variables in Multiple Integrals . . . 610
Chapter 6: Vector Calculus . . . 641
6.1 Vector Fields . . . 642
6.2 Line Integrals . . . 663
6.3 Conservative Vector Fields . . . 689
6.4 Green’s Theorem . . . 711
6.5 Divergence and Curl . . . 737
6.6 Surface Integrals . . . 753
6.7 Stokes’ Theorem . . . 789
6.8 The Divergence Theorem . . . 807
Chapter 7: Second-Order Differential Equations . . . 831
7.1 Second-Order Linear Equations . . . 832
7.2 Nonhomogeneous Linear Equations . . . 849
7.3 Applications . . . 863
7.4 Series Solutions of Differential Equations . . . 884
Appendix A: Table of Integrals . . . 897
Appendix B: Table of Derivatives . . . 903
Appendix C: Review of Pre-Calculus . . . 905
PREFACE
Welcome to Calculus Volume 3, an OpenStax resource. This textbook was written to increase student access to high-quality learning materials, maintaining highest standards of academic rigor at little to no cost.
About OpenStax
OpenStax is a nonprofit based at Rice University, and it’s our mission to improve student access to education. Our first openly licensed college textbook was published in 2012, and our library has since scaled to over 25 books for college and AP®courses used by hundreds of thousands of students. OpenStax Tutor, our low-cost personalized learning tool, is
being used in college courses throughout the country. Through our partnerships with philanthropic foundations and our alliance with other educational resource organizations, OpenStax is breaking down the most common barriers to learning and empowering students and instructors to succeed.
About OpenStax's resources
Customization
Calculus Volume 3 is licensed under a Creative Commons Attribution 4.0 International (CC BY) license, which means
that you can distribute, remix, and build upon the content, as long as you provide attribution to OpenStax and its content contributors.
Because our books are openly licensed, you are free to use the entire book or pick and choose the sections that are most relevant to the needs of your course. Feel free to remix the content by assigning your students certain chapters and sections in your syllabus, in the order that you prefer. You can even provide a direct link in your syllabus to the sections in the web view of your book.
Instructors also have the option of creating a customized version of their OpenStax book. The custom version can be made available to students in low-cost print or digital form through their campus bookstore. Visit your book page on OpenStax.org for more information.
Errata
All OpenStax textbooks undergo a rigorous review process. However, like any professional-grade textbook, errors sometimes occur. Since our books are web based, we can make updates periodically when deemed pedagogically necessary. If you have a correction to suggest, submit it through the link on your book page on OpenStax.org. Subject matter experts review all errata suggestions. OpenStax is committed to remaining transparent about all updates, so you will also find a list of past errata changes on your book page on OpenStax.org.
Format
You can access this textbook for free in web view or PDF through OpenStax.org, and for a low cost in print.
About Calculus Volume 3
Calculus is designed for the typical two- or three-semester general calculus course, incorporating innovative features to
enhance student learning. The book guides students through the core concepts of calculus and helps them understand how those concepts apply to their lives and the world around them. Due to the comprehensive nature of the material, we are offering the book in three volumes for flexibility and efficiency. Volume 3 covers parametric equations and polar coordinates, vectors, functions of several variables, multiple integration, and second-order differential equations.
Coverage and scope
Our Calculus Volume 3 textbook adheres to the scope and sequence of most general calculus courses nationwide. We have worked to make calculus interesting and accessible to students while maintaining the mathematical rigor inherent in the subject. With this objective in mind, the content of the three volumes of Calculus have been developed and arranged to provide a logical progression from fundamental to more advanced concepts, building upon what students have already learned and emphasizing connections between topics and between theory and applications. The goal of each section is to enable students not just to recognize concepts, but work with them in ways that will be useful in later courses and future careers. The organization and pedagogical features were developed and vetted with feedback from mathematics educators dedicated to the project.
Chapter 1: Functions and Graphs Chapter 2: Limits
Chapter 3: Derivatives
Chapter 4: Applications of Derivatives Chapter 5: Integration
Chapter 6: Applications of Integration
Volume 2
Chapter 1: Integration
Chapter 2: Applications of Integration Chapter 3: Techniques of Integration
Chapter 4: Introduction to Differential Equations Chapter 5: Sequences and Series
Chapter 6: Power Series
Chapter 7: Parametric Equations and Polar Coordinates
Volume 3
Chapter 1: Parametric Equations and Polar Coordinates Chapter 2: Vectors in Space
Chapter 3: Vector-Valued Functions
Chapter 4: Differentiation of Functions of Several Variables Chapter 5: Multiple Integration
Chapter 6: Vector Calculus
Chapter 7: Second-Order Differential Equations
Pedagogical foundation
Throughout Calculus Volume 3 you will find examples and exercises that present classical ideas and techniques as well as modern applications and methods. Derivations and explanations are based on years of classroom experience on the part of long-time calculus professors, striving for a balance of clarity and rigor that has proven successful with their students. Motivational applications cover important topics in probability, biology, ecology, business, and economics, as well as areas of physics, chemistry, engineering, and computer science. Student Projects in each chapter give students opportunities to explore interesting sidelights in pure and applied mathematics, from navigating a banked turn to adapting a moon landing vehicle for a new mission to Mars. Chapter Opening Applications pose problems that are solved later in the chapter, using the ideas covered in that chapter. Problems include the average distance of Halley's Comment from the Sun, and the vector field of a hurricane. Definitions, Rules, and Theorems are highlighted throughout the text, including over 60 Proofs of theorems.
Assessments that reinforce key concepts
In-chapter Examples walk students through problems by posing a question, stepping out a solution, and then asking students to practice the skill with a “Checkpoint” question. The book also includes assessments at the end of each chapter so students can apply what they’ve learned through practice problems. Many exercises are marked with a [T] to indicate they are suitable for solution by technology, including calculators or Computer Algebra Systems (CAS). Answers for selected exercises are available in the Answer Key at the back of the book. The book also includes assessments at the end of each chapter so students can apply what they’ve learned through practice problems.
Early or late transcendentals
The three volumes of Calculus are designed to accommodate both Early and Late Transcendental approaches to calculus. Exponential and logarithmic functions are introduced informally in Chapter 1 of Volume 1 and presented in more rigorous terms in Chapter 6 in Volume 1 and Chapter 2 in Volume 2. Differentiation and integration of these functions is covered in Chapters 3–5 in Volume 1 and Chapter 1 in Volume 2 for instructors who want to include them with other types of functions. These discussions, however, are in separate sections that can be skipped for instructors who prefer to wait until the integral definitions are given before teaching the calculus derivations of exponentials and logarithms.
Comprehensive art program
Our art program is designed to enhance students’ understanding of concepts through clear and effective illustrations, diagrams, and photographs.
Additional resources
Student and instructor resources
We’ve compiled additional resources for both students and instructors, including Getting Started Guides, an instructor solution manual, and PowerPoint slides. Instructor resources require a verified instructor account, which you can apply for when you log in or create your account on OpenStax.org. Take advantage of these resources to supplement your OpenStax book.
Community Hubs
OpenStax partners with the Institute for the Study of Knowledge Management in Education (ISKME) to offer Community Hubs on OER Commons – a platform for instructors to share community-created resources that support OpenStax books, free of charge. Through our Community Hubs, instructors can upload their own materials or download resources to use in their own courses, including additional ancillaries, teaching material, multimedia, and relevant course content. We encourage instructors to join the hubs for the subjects most relevant to your teaching and research as an opportunity both to enrich your courses and to engage with other faculty.
To reach the Community Hubs, visitwww.oercommons.org/hubs/OpenStax.
Partner resources
OpenStax Partners are our allies in the mission to make high-quality learning materials affordable and accessible to students and instructors everywhere. Their tools integrate seamlessly with our OpenStax titles at a low cost. To access the partner resources for your text, visit your book page on OpenStax.org.
About the authors
Senior contributing authors
Gilbert Strang, Massachusetts Institute of Technology
Dr. Strang received his PhD from UCLA in 1959 and has been teaching mathematics at MIT ever since. His Calculus online textbook is one of eleven that he has published and is the basis from which our final product has been derived and updated for today’s student. Strang is a decorated mathematician and past Rhodes Scholar at Oxford University.
Edwin “Jed” Herman, University of Wisconsin-Stevens Point
Dr. Herman earned a BS in Mathematics from Harvey Mudd College in 1985, an MA in Mathematics from UCLA in 1987, and a PhD in Mathematics from the University of Oregon in 1997. He is currently a Professor at the University of Wisconsin-Stevens Point. He has more than 20 years of experience teaching college mathematics, is a student research mentor, is experienced in course development/design, and is also an avid board game designer and player.
Contributing authors
Catherine Abbott, Keuka College
Nicoleta Virginia Bila, Fayetteville State University Sheri J. Boyd, Rollins College
Joyati Debnath, Winona State University Valeree Falduto, Palm Beach State College Joseph Lakey, New Mexico State University Julie Levandosky, Framingham State University David McCune, William Jewell College Michelle Merriweather, Bronxville High School Kirsten R. Messer, Colorado State University - Pueblo Alfred K. Mulzet, Florida State College at Jacksonville
William Radulovich (retired), Florida State College at Jacksonville Erica M. Rutter, Arizona State University
David Smith, University of the Virgin Islands Elaine A. Terry, Saint Joseph’s University David Torain, Hampton University
Reviewers
Marwan A. Abu-Sawwa, Florida State College at Jacksonville Kenneth J. Bernard, Virginia State University
John Beyers, University of Maryland
Charles Buehrle, Franklin & Marshall College Matthew Cathey, Wofford College
Michael Cohen, Hofstra University
William DeSalazar, Broward County School System Murray Eisenberg, University of Massachusetts Amherst Kristyanna Erickson, Cecil College
Tiernan Fogarty, Oregon Institute of Technology David French, Tidewater Community College Marilyn Gloyer, Virginia Commonwealth University Shawna Haider, Salt Lake Community College Lance Hemlow, Raritan Valley Community College Jerry Jared, The Blue Ridge School
Peter Jipsen, Chapman University David Johnson, Lehigh University M.R. Khadivi, Jackson State University Robert J. Krueger, Concordia University Tor A. Kwembe, Jackson State University
Jean-Marie Magnier, Springfield Technical Community College Cheryl Chute Miller, SUNY Potsdam
Bagisa Mukherjee, Penn State University, Worthington Scranton Campus Kasso Okoudjou, University of Maryland College Park
Peter Olszewski, Penn State Erie, The Behrend College Steven Purtee, Valencia College
Doug Shaw, University of Northern Iowa Hussain Elalaoui-Talibi, Tuskegee University Jeffrey Taub, Maine Maritime Academy William Thistleton, SUNY Polytechnic Institute A. David Trubatch, Montclair State University Carmen Wright, Jackson State University Zhenbu Zhang, Jackson State University
1
|
PARAMETRIC
EQUATIONS AND POLAR
COORDINATES
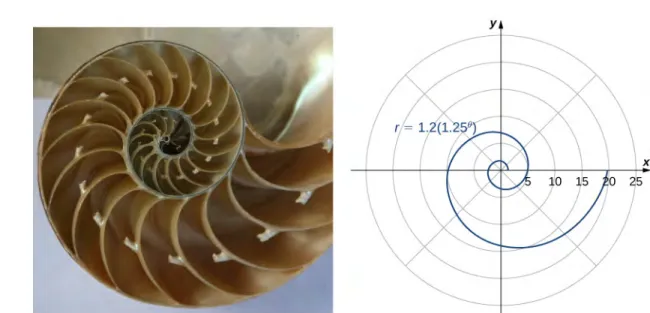
Figure 1.1 The chambered nautilus is a marine animal that lives in the tropical Pacific Ocean. Scientists think they have existed mostly unchanged for about 500 million years.(credit: modification of work by Jitze Couperus, Flickr)
Chapter Outline
1.1Parametric Equations
1.2Calculus of Parametric Curves
1.3Polar Coordinates
1.4Area and Arc Length in Polar Coordinates
1.5Conic Sections
Introduction
The chambered nautilus is a fascinating creature. This animal feeds on hermit crabs, fish, and other crustaceans. It has a hard outer shell with many chambers connected in a spiral fashion, and it can retract into its shell to avoid predators. When part of the shell is cut away, a perfect spiral is revealed, with chambers inside that are somewhat similar to growth rings in a tree.
The mathematical function that describes a spiral can be expressed using rectangular (or Cartesian) coordinates. However, if we change our coordinate system to something that works a bit better with circular patterns, the function becomes much simpler to describe. The polar coordinate system is well suited for describing curves of this type. How can we use this coordinate system to describe spirals and other radial figures? (SeeExample 1.14.)
In this chapter we also study parametric equations, which give us a convenient way to describe curves, or to study the position of a particle or object in two dimensions as a function of time. We will use parametric equations and polar coordinates for describing many topics later in this text.
1.1
|
Parametric Equations
Learning Objectives
1.1.1 Plot a curve described by parametric equations.
1.1.2 Convert the parametric equations of a curve into the form y = f (x).
1.1.3 Recognize the parametric equations of basic curves, such as a line and a circle.
1.1.4 Recognize the parametric equations of a cycloid.
In this section we examine parametric equations and their graphs. In the two-dimensional coordinate system, parametric equations are useful for describing curves that are not necessarily functions. The parameter is an independent variable that both x and y depend on, and as the parameter increases, the values of x and y trace out a path along a plane curve. For example, if the parameter is t (a common choice), then t might represent time. Then x and y are defined as functions of time, and ⎛
⎝x(t), y(t)⎞⎠ can describe the position in the plane of a given object as it moves along a curved path.
Parametric Equations and Their Graphs
Consider the orbit of Earth around the Sun. Our year lasts approximately 365.25 days, but for this discussion we will use 365 days. On January 1 of each year, the physical location of Earth with respect to the Sun is nearly the same, except for leap years, when the lag introduced by the extra 1
4 day of orbiting time is built into the calendar. We call January 1 “day 1”
of the year. Then, for example, day 31 is January 31, day 59 is February 28, and so on.
The number of the day in a year can be considered a variable that determines Earth’s position in its orbit. As Earth revolves around the Sun, its physical location changes relative to the Sun. After one full year, we are back where we started, and a new year begins. According to Kepler’s laws of planetary motion, the shape of the orbit is elliptical, with the Sun at one focus of the ellipse. We study this idea in more detail inConic Sections.
Figure 1.2 Earth’s orbit around the Sun in one year.
Figure 1.2depicts Earth’s orbit around the Sun during one year. The point labeled F2 is one of the foci of the ellipse; the other focus is occupied by the Sun. If we superimpose coordinate axes over this graph, then we can assign ordered pairs to each point on the ellipse (Figure 1.3). Then each x value on the graph is a value of position as a function of time, and each
y value is also a value of position as a function of time. Therefore, each point on the graph corresponds to a value of Earth’s
position as a function of time.
Figure 1.3 Coordinate axes superimposed on the orbit of Earth.
We can determine the functions for x(t) and y(t), thereby parameterizing the orbit of Earth around the Sun. The variable
t is called an independent parameter and, in this context, represents time relative to the beginning of each year.
A curve in the (x, y) plane can be represented parametrically. The equations that are used to define the curve are called
parametric equations.
Definition
If x and y are continuous functions of t on an interval I, then the equations
x = x(t) and y = y(t)
interval I is called the graph of the parametric equations. The graph of parametric equations is called a parametric
curve or plane curve, and is denoted by C.
Notice in this definition that x and y are used in two ways. The first is as functions of the independent variable t. As t varies over the interval I, the functions x(t) and y(t) generate a set of ordered pairs (x, y).This set of ordered pairs generates the graph of the parametric equations. In this second usage, to designate the ordered pairs, x and y are variables. It is important to distinguish the variables x and y from the functions x(t) and y(t).
Example 1.1
Graphing a Parametrically Defined Curve
Sketch the curves described by the following parametric equations: a. x(t) = t − 1, y(t) = 2t + 4, −3 ≤ t ≤ 2
b. x(t) = t2− 3, y(t) = 2t + 1, −2 ≤ t ≤ 3 c. x(t) = 4 cos t, y(t) = 4 sin t, 0 ≤ t ≤ 2π
Solution
a. To create a graph of this curve, first set up a table of values. Since the independent variable in both x(t) and y(t) is t, let t appear in the first column. Then x(t) and y(t) will appear in the second and third columns of the table.
t x(t) y(t) −3 −4 −2 −2 −3 0 −1 −2 2 0 −1 4 1 0 6 2 1 8
The second and third columns in this table provide a set of points to be plotted. The graph of these points appears inFigure 1.4. The arrows on the graph indicate the orientation of the graph, that is, the direction that a point moves on the graph as t varies from −3 to 2.
Figure 1.4 Graph of the plane curve described by the parametric equations in part a.
b. To create a graph of this curve, again set up a table of values.
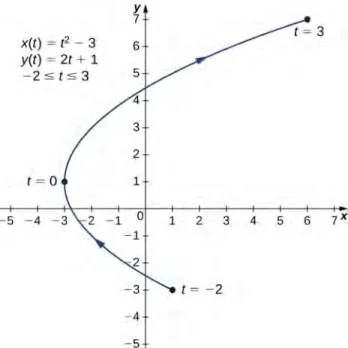
t x(t) y(t) −2 1 −3 −1 −2 −1 0 −3 1 1 −2 3 2 1 5 3 6 7
The second and third columns in this table give a set of points to be plotted (Figure 1.5). The first point on the graph (corresponding to t = −2) has coordinates (1, −3), and the last point (corresponding to t = 3) has coordinates (6, 7). As t progresses from −2 to 3, the point on the curve travels along a parabola. The direction the point moves is again called the orientation and is indicated on the graph.
Figure 1.5 Graph of the plane curve described by the parametric equations in part b.
c. In this case, use multiples of π/6 for t and create another table of values:
t x(t) y(t) t x(t) y(t) 0 4 0 7π 6 −2 3 ≈ −3.5 2 π 6 2 3 ≈ 3.5 2 4π3 −2 −2 3 ≈ −3.5 π 3 2 2 3 ≈ 3.5 3π2 0 −4 π 2 0 4 5π3 2 −2 3 ≈ −3.5 2π 3 −2 2 3 ≈ 3.5 11π6 2 3 ≈ 3.5 2 5π 6 −2 3 ≈ −3.5 2 2π 4 0 π −4 0
1.1
The graph of this plane curve appears in the following graph.
Figure 1.6 Graph of the plane curve described by the parametric equations in part c.
This is the graph of a circle with radius 4 centered at the origin, with a counterclockwise orientation. The starting point and ending points of the curve both have coordinates (4, 0).
Sketch the curve described by the parametric equations
x(t) = 3t + 2, y(t) = t2− 1, −3 ≤ t ≤ 2.
Eliminating the Parameter
To better understand the graph of a curve represented parametrically, it is useful to rewrite the two equations as a single equation relating the variables x and y. Then we can apply any previous knowledge of equations of curves in the plane to identify the curve. For example, the equations describing the plane curve inExample 1.1b. are
x(t) = t2− 3, y(t) = 2t + 1, −2 ≤ t ≤ 3.
Solving the second equation for t gives
t = y − 12 .
This can be substituted into the first equation:
x =⎛⎝y − 12 ⎞⎠2− 3 = y2− 2y + 14 − 3 = y2− 2y − 114 .
This equation describes x as a function of y. These steps give an example of eliminating the parameter. The graph of this function is a parabola opening to the right. Recall that the plane curve started at (1, −3) and ended at (6, 7). These terminations were due to the restriction on the parameter t.
Example 1.2
Eliminating the Parameter
Eliminate the parameter for each of the plane curves described by the following parametric equations and describe the resulting graph.
a. x(t) = 2t + 4, y(t) = 2t + 1, −2 ≤ t ≤ 6 b. x(t) = 4 cos t, y(t) = 3 sin t, 0 ≤ t ≤ 2π
Solution
a. To eliminate the parameter, we can solve either of the equations for t. For example, solving the first equation for t gives
x = 2t + 4 x2 = 2t + 4
x2− 4 = 2t
t = x22 .− 4
Note that when we square both sides it is important to observe that x ≥ 0. Substituting t = x22− 4 this into y(t) yields
y(t) = 2t + 1
y = 2
⎛
⎝
x22− 4⎞
⎠
+ 1y = x2− 4 + 1
y = x2− 3.
This is the equation of a parabola opening upward. There is, however, a domain restriction because of the limits on the parameter t. When t = −2, x = 2(−2) + 4 = 0, and when t = 6,
Figure 1.7 Graph of the plane curve described by the parametric equations in part a.
b. Sometimes it is necessary to be a bit creative in eliminating the parameter. The parametric equations for this example are
x(t) = 4 cos t and y(t) = 3 sin t.
Solving either equation for t directly is not advisable because sine and cosine are not one-to-one functions. However, dividing the first equation by 4 and the second equation by 3 (and suppressing the t) gives us
cos t = x4 andsint = y3.
Now use the Pythagorean identity cos2t + sin2t = 1 and replace the expressions for sin t and cos t with the equivalent expressions in terms of x and y. This gives
⎛ ⎝x4⎞⎠ 2 +⎛⎝3y⎞⎠2 = 1 x2 16 +y 2 9 = 1.
This is the equation of a horizontal ellipse centered at the origin, with semimajor axis 4 and semiminor axis 3 as shown in the following graph.
1.2
Figure 1.8 Graph of the plane curve described by the parametric equations in part b.
As t progresses from 0 to 2π, a point on the curve traverses the ellipse once, in a counterclockwise direction. Recall from the section opener that the orbit of Earth around the Sun is also elliptical. This is a perfect example of using parameterized curves to model a real-world phenomenon.
Eliminate the parameter for the plane curve defined by the following parametric equations and describe the resulting graph.
x(t) = 2 + 3t, y(t) = t − 1, 2 ≤ t ≤ 6
So far we have seen the method of eliminating the parameter, assuming we know a set of parametric equations that describe a plane curve. What if we would like to start with the equation of a curve and determine a pair of parametric equations for that curve? This is certainly possible, and in fact it is possible to do so in many different ways for a given curve. The process is known as parameterization of a curve.
Example 1.3
Parameterizing a Curve
Find two different pairs of parametric equations to represent the graph of y = 2x2− 3.
Solution
First, it is always possible to parameterize a curve by defining x(t) = t, then replacing x with t in the equation for y(t). This gives the parameterization
1.3
Since there is no restriction on the domain in the original graph, there is no restriction on the values of t. We have complete freedom in the choice for the second parameterization. For example, we can choose
x(t) = 3t − 2. The only thing we need to check is that there are no restrictions imposed on x; that is, the range of x(t) is all real numbers. This is the case for x(t) = 3t − 2. Now since y = 2x2− 3, we can substitute
x(t) = 3t − 2 for x. This gives
y(t) = 2(3t − 2)2− 2 = 2⎛⎝9t2− 12t + 4⎞⎠− 2
= 18t2− 24t + 8 − 2 = 18t2− 24t + 6.
Therefore, a second parameterization of the curve can be written as
x(t) = 3t − 2 and y(t) = 18t2− 24t + 6.
Find two different sets of parametric equations to represent the graph of y = x2+ 2x.
Cycloids and Other Parametric Curves
Imagine going on a bicycle ride through the country. The tires stay in contact with the road and rotate in a predictable pattern. Now suppose a very determined ant is tired after a long day and wants to get home. So he hangs onto the side of the tire and gets a free ride. The path that this ant travels down a straight road is called a cycloid (Figure 1.9). A cycloid generated by a circle (or bicycle wheel) of radius a is given by the parametric equations
x(t) = a(t − sin t), y(t) = a(1 − cos t).
To see why this is true, consider the path that the center of the wheel takes. The center moves along the x-axis at a constant height equal to the radius of the wheel. If the radius is a, then the coordinates of the center can be given by the equations
x(t) = at, y(t) = a
for any value of t. Next, consider the ant, which rotates around the center along a circular path. If the bicycle is moving from left to right then the wheels are rotating in a clockwise direction. A possible parameterization of the circular motion of the ant (relative to the center of the wheel) is given by
x(t) = −a sin t, y(t) = −a cos t.
(The negative sign is needed to reverse the orientation of the curve. If the negative sign were not there, we would have to imagine the wheel rotating counterclockwise.) Adding these equations together gives the equations for the cycloid.
x(t) = a(t − sin t), y(t) = a(1 − cos t).
Figure 1.9 A wheel traveling along a road without slipping; the point on the edge of the wheel traces out a cycloid.
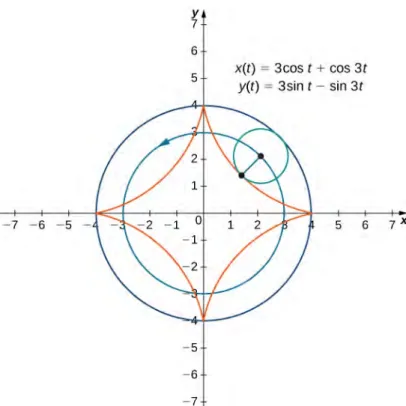
Now suppose that the bicycle wheel doesn’t travel along a straight road but instead moves along the inside of a larger wheel, as inFigure 1.10. In this graph, the green circle is traveling around the blue circle in a counterclockwise direction. A point
on the edge of the green circle traces out the red graph, which is called a hypocycloid.
Figure 1.10 Graph of the hypocycloid described by the parametric equations shown.
The general parametric equations for a hypocycloid are
x(t) = (a − b) cos t + b cos⎛⎝a − bb ⎞⎠t y(t) = (a − b) sin t − b sin⎛⎝a − bb ⎞⎠t.
These equations are a bit more complicated, but the derivation is somewhat similar to the equations for the cycloid. In this case we assume the radius of the larger circle is a and the radius of the smaller circle is b. Then the center of the wheel travels along a circle of radius a − b. This fact explains the first term in each equation above. The period of the second trigonometric function in both x(t) and y(t) is equal to a − b.2πb
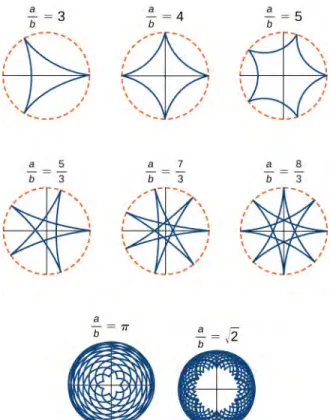
The ratio ab is related to the number of cusps on the graph (cusps are the corners or pointed ends of the graph), as illustrated inFigure 1.11. This ratio can lead to some very interesting graphs, depending on whether or not the ratio is rational. Figure 1.10corresponds to a = 4 and b = 1. The result is a hypocycloid with four cusps.Figure 1.11 shows some other possibilities. The last two hypocycloids have irrational values for a
b. In these cases the hypocycloids have an infinite
Figure 1.11 Graph of various hypocycloids corresponding to different values of a/b.
The Witch of Agnesi
Many plane curves in mathematics are named after the people who first investigated them, like the folium of Descartes or the spiral of Archimedes. However, perhaps the strangest name for a curve is the witch of Agnesi. Why a witch? Maria Gaetana Agnesi (1718–1799) was one of the few recognized women mathematicians of eighteenth-century Italy. She wrote a popular book on analytic geometry, published in 1748, which included an interesting curve that had been studied by Fermat in 1630. The mathematician Guido Grandi showed in 1703 how to construct this curve, which he later called the “versoria,” a Latin term for a rope used in sailing. Agnesi used the Italian term for this rope, “versiera,” but in Latin, this same word means a “female goblin.” When Agnesi’s book was translated into English in 1801, the translator used the term “witch” for the curve, instead of rope. The name “witch of Agnesi” has stuck ever since. The witch of Agnesi is a curve defined as follows: Start with a circle of radius a so that the points (0, 0) and (0, 2a) are points on the circle (Figure 1.12). Let O denote the origin. Choose any other point A on the circle, and draw the secant line OA. Let B denote the point at which the line OA intersects the horizontal line through (0, 2a). The vertical line through B intersects the horizontal line through A at the point P. As the point A varies, the path that the point P travels is the witch of Agnesi curve for the given circle.
Witch of Agnesi curves have applications in physics, including modeling water waves and distributions of spectral lines. In probability theory, the curve describes the probability density function of the Cauchy distribution. In this project you will parameterize these curves.
Figure 1.12 As the point A moves around the circle, the point P traces out the witch of Agnesi curve for the given circle.
1. On the figure, label the following points, lengths, and angle: a. C is the point on the x-axis with the same x-coordinate as A. b. x is the x-coordinate of P, and y is the y-coordinate of P. c. E is the point (0, a).
d. F is the point on the line segment OA such that the line segment EF is perpendicular to the line segment
OA.
e. b is the distance from O to F. f. c is the distance from F to A. g. d is the distance from O to B. h. θ is the measure of angle ∠COA.
The goal of this project is to parameterize the witch using θ as a parameter. To do this, write equations for x and y in terms of only θ.
2. Show that d = 2asin θ.
3. Note that x = d cos θ. Show that x = 2a cot θ. When you do this, you will have parameterized the
x-coordinate of the curve with respect to θ. If you can get a similar equation for y, you will have parameterized
the curve.
4. In terms of θ, what is the angle ∠EOA? 5. Show that b + c = 2a cos⎛⎝π
2 − θ⎞⎠.
6. Show that y = 2a cos⎛⎝π
2 − θ⎞⎠sin θ.
7. Show that y = 2a sin2θ. You have now parameterized the y-coordinate of the curve with respect to θ. 8. Conclude that a parameterization of the given witch curve is
x = 2a cot θ, y = 2a sin2θ, − ∞ < θ < ∞.
9. Use your parameterization to show that the given witch curve is the graph of the function f (x) = 8a3
Travels with My Ant: The Curtate and Prolate Cycloids
Earlier in this section, we looked at the parametric equations for a cycloid, which is the path a point on the edge of a wheel traces as the wheel rolls along a straight path. In this project we look at two different variations of the cycloid, called the curtate and prolate cycloids.
First, let’s revisit the derivation of the parametric equations for a cycloid. Recall that we considered a tenacious ant trying to get home by hanging onto the edge of a bicycle tire. We have assumed the ant climbed onto the tire at the very edge, where the tire touches the ground. As the wheel rolls, the ant moves with the edge of the tire (Figure 1.13). As we have discussed, we have a lot of flexibility when parameterizing a curve. In this case we let our parameter t represent the angle the tire has rotated through. Looking atFigure 1.13, we see that after the tire has rotated through an angle of t, the position of the center of the wheel, C = (xC, yC), is given by
xC= at and yC= a.
Furthermore, letting A = (xA, yA) denote the position of the ant, we note that
xC− xA= a sin t and yC− yA= a cos t.
Then
xA= xC− a sin t = at − a sin t = a(t − sin t)
yA= yC− a cos t = a − a cos t = a(1 − cos t).
Figure 1.13 (a) The ant clings to the edge of the bicycle tire as the tire rolls along the ground. (b) Using geometry to determine the position of the ant after the tire has rotated through an angle of t.
Note that these are the same parametric representations we had before, but we have now assigned a physical meaning to the parametric variable t.
After a while the ant is getting dizzy from going round and round on the edge of the tire. So he climbs up one of the spokes toward the center of the wheel. By climbing toward the center of the wheel, the ant has changed his path of motion. The new path has less up-and-down motion and is called a curtate cycloid (Figure 1.14). As shown in the figure, we let b denote the distance along the spoke from the center of the wheel to the ant. As before, we let t represent the angle the tire has rotated through. Additionally, we let C = (xC, yC) represent the position of the center of the wheel and A = (xA, yA) represent the position of the ant.
Figure 1.14 (a) The ant climbs up one of the spokes toward the center of the wheel. (b) The ant’s path of motion after he climbs closer to the center of the wheel. This is called a curtate cycloid. (c) The new setup, now that the ant has moved closer to the center of the wheel.
1. What is the position of the center of the wheel after the tire has rotated through an angle of t? 2. Use geometry to find expressions for xC− xA and for yC− yA.
3. On the basis of your answers to parts 1 and 2, what are the parametric equations representing the curtate cycloid?
Once the ant’s head clears, he realizes that the bicyclist has made a turn, and is now traveling away from his home. So he drops off the bicycle tire and looks around. Fortunately, there is a set of train tracks nearby, headed back in the right direction. So the ant heads over to the train tracks to wait. After a while, a train goes by, heading in the right direction, and he manages to jump up and just catch the edge of the train wheel (without getting squished!).
The ant is still worried about getting dizzy, but the train wheel is slippery and has no spokes to climb, so he decides to just hang on to the edge of the wheel and hope for the best. Now, train wheels have a flange to keep the wheel running on the tracks. So, in this case, since the ant is hanging on to the very edge of the flange, the distance from the center of the wheel to the ant is actually greater than the radius of the wheel (Figure 1.15). The setup here is essentially the same as when the ant climbed up the spoke on the bicycle wheel. We let
b denote the distance from the center of the wheel to the ant, and we let t represent the angle the tire has
rotated through. Additionally, we let C = (xC, yC) represent the position of the center of the wheel and
A = (xA, yA) represent the position of the ant (Figure 1.15).
When the distance from the center of the wheel to the ant is greater than the radius of the wheel, his path of motion is called a prolate cycloid. A graph of a prolate cycloid is shown in the figure.
Figure 1.15 (a) The ant is hanging onto the flange of the train wheel. (b) The new setup, now that the ant has jumped onto the train wheel. (c) The ant travels along a prolate cycloid.
4. Using the same approach you used in parts 1– 3, find the parametric equations for the path of motion of the ant.
5. What do you notice about your answer to part 3 and your answer to part 4?
Notice that the ant is actually traveling backward at times (the “loops” in the graph), even though the train continues to move forward. He is probably going to be really dizzy by the time he gets home!
1.1 EXERCISES
For the following exercises, sketch the curves below by eliminating the parameter t. Give the orientation of the curve.
1. x = t2+ 2t, y = t + 1 2. x = cos(t), y = sin(t), (0, 2π] 3. x = 2t + 4, y = t − 1
4. x = 3 − t, y = 2t − 3, 1.5 ≤ t ≤ 3
For the following exercises, eliminate the parameter and sketch the graphs.
5. x = 2t2, y = t4+ 1
For the following exercises, use technology (CAS or calculator) to sketch the parametric equations.
6. [T] x = t2+ t, y = t2− 1 7. [T] x = e−t, y = e2t− 1 8. [T] x = 3 cos t, y = 4 sin t 9. [T] x = sec t, y = cos t
For the following exercises, sketch the parametric equations by eliminating the parameter. Indicate any asymptotes of the graph.
10. x = et, y = e2t+ 1 11. x = 6 sin(2θ), y = 4 cos(2θ) 12. x = cos θ, y = 2 sin(2θ) 13. x = 3 − 2 cos θ, y = −5 + 3 sin θ 14. x = 4 + 2 cos θ, y = −1 + sin θ 15. x = sec t, y = tan t 16. x = ln(2t), y = t2 17. x = et, y = e2t 18. x = e−2t, y = e3t 19. x = t3, y = 3 ln t 20. x = 4 sec θ, y = 3 tan θ
For the following exercises, convert the parametric equations of a curve into rectangular form. No sketch is necessary. State the domain of the rectangular form. 21. x = t2− 1, y = t2 22. x = 1t + 1, y = t1 + t, t > −1 23. x = 4 cos θ, y = 3 sin θ, t ∈ (0, 2π] 24. x = cosh t, y = sinh t 25. x = 2t − 3, y = 6t − 7 26. x = t2, y = t3 27. x = 1 + cos t, y = 3 − sin t 28. x = t, y = 2t + 4 29. x = sec t, y = tan t, π ≤ t < 3π2 30. x = 2 cosh t, y = 4 sinh t 31. x = cos(2t), y = sin t 32. x = 4t + 3, y = 16t2− 9 33. x = t2, y = 2 ln t, t ≥ 1 34. x = t3, y = 3 ln t, t ≥ 1 35. x = tn, y = n ln t, t ≥ 1, where n is a natural number 36. x = ln(5t)y = ln(t2) where 1 ≤ t ≤ e 37. x = 2 sin(8t)y = 2 cos(8t) 38. x = tan ty = sec2t − 1
For the following exercises, the pairs of parametric equations represent lines, parabolas, circles, ellipses, or hyperbolas. Name the type of basic curve that each pair of
equations represents. 39. x = 3t + 4y = 5t − 2 40. x − 4 = 5ty + 2 = t 41. x = 2t + 1y = t2− 3 42. x = 3 cos ty = 3 sin t 43. x = 2 cos(3t)y = 2 sin(3t) 44. x = cosh ty = sinh t 45. x = 3 cos ty = 4 sin t 46. x = 2 cos(3t)y = 5 sin(3t) 47. x = 3 cosh(4t)y = 4 sinh(4t) 48. x = 2 cosh ty = 2 sinh t
49. Show that x = h + r cos θy = k + r sin θ represents the equation of a circle.
50. Use the equations in the preceding problem to find a set of parametric equations for a circle whose radius is 5 and whose center is (−2, 3).
For the following exercises, use a graphing utility to graph the curve represented by the parametric equations and identify the curve from its equation.
51. [T] x = θ + sin θy = 1 − cos θ
52. [T] x = 2t − 2 sin ty = 2 − 2 cos t
53. [T] x = t − 0.5 sin ty = 1 − 1.5 cos t
54. An airplane traveling horizontally at 100 m/s over flat ground at an elevation of 4000 meters must drop an emergency package on a target on the ground. The
trajectory of the package is given by
x = 100t, y = −4.9t2+ 4000, t ≥ 0 where the origin is the point on the ground directly beneath the plane at the moment of release. How many horizontal meters before the target should the package be released in order to hit the target?
55. The trajectory of a bullet is given by
x = v0(cos α) ty = v0(sin α) t − 12gt2 where
v0= 500 m/s, g = 9.8 = 9.8 m/s2, and
α = 30 degrees. When will the bullet hit the ground? How far from the gun will the bullet hit the ground?
56. [T] Use technology to sketch the curve represented by
x = sin(4t), y = sin(3t), 0 ≤ t ≤ 2π.
57. [T] Use technology to sketch
x = 2 tan(t), y = 3 sec(t), −π < t < π.
58. Sketch the curve known as an epitrochoid, which gives the path of a point on a circle of radius b as it rolls on the outside of a circle of radius a. The equations are
x = (a + b)cos t − c · cos⎡⎣(a + b)tb ⎤⎦ y = (a + b)sin t − c · sin⎡⎣(a + b)tb ⎤⎦.
Let a = 1, b = 2, c = 1.
59. [T] Use technology to sketch the spiral curve given by
x = t cos(t), y = t sin(t) from −2π ≤ t ≤ 2π.
60. [T] Use technology to graph the curve given by the
parametric equations
x = 2 cot(t), y = 1 − cos(2t), −π/2 ≤ t ≤ π/2. This
curve is known as the witch of Agnesi.
61. [T] Sketch the curve given by parametric equations
x = cosh(t)
1.2
|
Calculus of Parametric Curves
Learning Objectives
1.2.1 Determine derivatives and equations of tangents for parametric curves.
1.2.2 Find the area under a parametric curve.
1.2.3 Use the equation for arc length of a parametric curve.
1.2.4 Apply the formula for surface area to a volume generated by a parametric curve.
Now that we have introduced the concept of a parameterized curve, our next step is to learn how to work with this concept in the context of calculus. For example, if we know a parameterization of a given curve, is it possible to calculate the slope of a tangent line to the curve? How about the arc length of the curve? Or the area under the curve?
Another scenario: Suppose we would like to represent the location of a baseball after the ball leaves a pitcher’s hand. If the position of the baseball is represented by the plane curve ⎛
⎝x(t), y(t)⎞⎠, then we should be able to use calculus to find
the speed of the ball at any given time. Furthermore, we should be able to calculate just how far that ball has traveled as a function of time.
Derivatives of Parametric Equations
We start by asking how to calculate the slope of a line tangent to a parametric curve at a point. Consider the plane curve defined by the parametric equations
x(t) = 2t + 3, y(t) = 3t − 4, −2 ≤ t ≤ 3.
The graph of this curve appears inFigure 1.16. It is a line segment starting at (−1, −10) and ending at (9, 5).
Figure 1.16 Graph of the line segment described by the given parametric equations.
We can eliminate the parameter by first solving the equation x(t) = 2t + 3 for t:
x(t) = 2t + 3
x − 3 = 2t t = x − 32 .
Substituting this into y(t), we obtain
y(t) = 3t − 4
y = 3⎛⎝x − 32 ⎞⎠− 4
y = 3x2 −92 − 4 y = 3x2 −172 .
The slope of this line is given by dy
dx =32. Next we calculate x′ (t) and y′ (t). This gives x′ (t) = 2 and y′ (t) = 3. Notice
that dydx =dx/dt =dy/dt 32. This is no coincidence, as outlined in the following theorem.
Theorem 1.1: Derivative of Parametric Equations
Consider the plane curve defined by the parametric equations x = x(t) and y = y(t). Suppose that x′ (t) and y′ (t) exist, and assume that x′ (t) ≠ 0. Then the derivative dydx is given by
(1.1)
dy
dx =dy/dtdx/dt = y′ (t)x′ (t).
Proof
This theorem can be proven using the Chain Rule. In particular, assume that the parameter t can be eliminated, yielding a differentiable function y = F(x). Then y(t) = F(x(t)). Differentiating both sides of this equation using the Chain Rule yields y′ (t) = F′ (x(t))x′ (t), so F′⎛ ⎝x(t)⎞⎠= y′ (t) x′ (t). But F′⎛ ⎝x(t)⎞⎠= dy
dx, which proves the theorem.
□
Equation 1.1can be used to calculate derivatives of plane curves, as well as critical points. Recall that a critical point of a differentiable function y = f (x) is any point x = x0 such that either f ′ (x0) = 0 or f ′ (x0) does not exist.Equation 1.1gives a formula for the slope of a tangent line to a curve defined parametrically regardless of whether the curve can be described by a function y = f (x) or not.
Finding the Derivative of a Parametric Curve
Calculate the derivative dydx for each of the following parametrically defined plane curves, and locate any critical points on their respective graphs.
a. x(t) = t2− 3, y(t) = 2t − 1, −3 ≤ t ≤ 4
b. x(t) = 2t + 1, y(t) = t3− 3t + 4, −2 ≤ t ≤ 5 c. x(t) = 5 cos t, y(t) = 5 sin t, 0 ≤ t ≤ 2π
Solution
a. To applyEquation 1.1, first calculate x′ (t) and y′(t):
x′ (t) = 2t y′ (t) = 2.
Next substitute these into the equation:
dy dx = dy/dtdx/dt dy dx = 2t2 dy dx = 1t .
This derivative is undefined when t = 0. Calculating x(0) and y(0) gives x(0) = (0)2− 3 = −3 and
y(0) = 2(0) − 1 = −1, which corresponds to the point (−3, −1) on the graph. The graph of this curve is a parabola opening to the right, and the point (−3, −1) is its vertex as shown.
Figure 1.17 Graph of the parabola described by parametric equations in part a.
b. To applyEquation 1.1, first calculate x′ (t) and y′(t):
x′ (t) = 2 y′ (t) = 3t2− 3.
Next substitute these into the equation: dy dx =dy/dtdx/dt dy dx =3t 2− 3 2 .
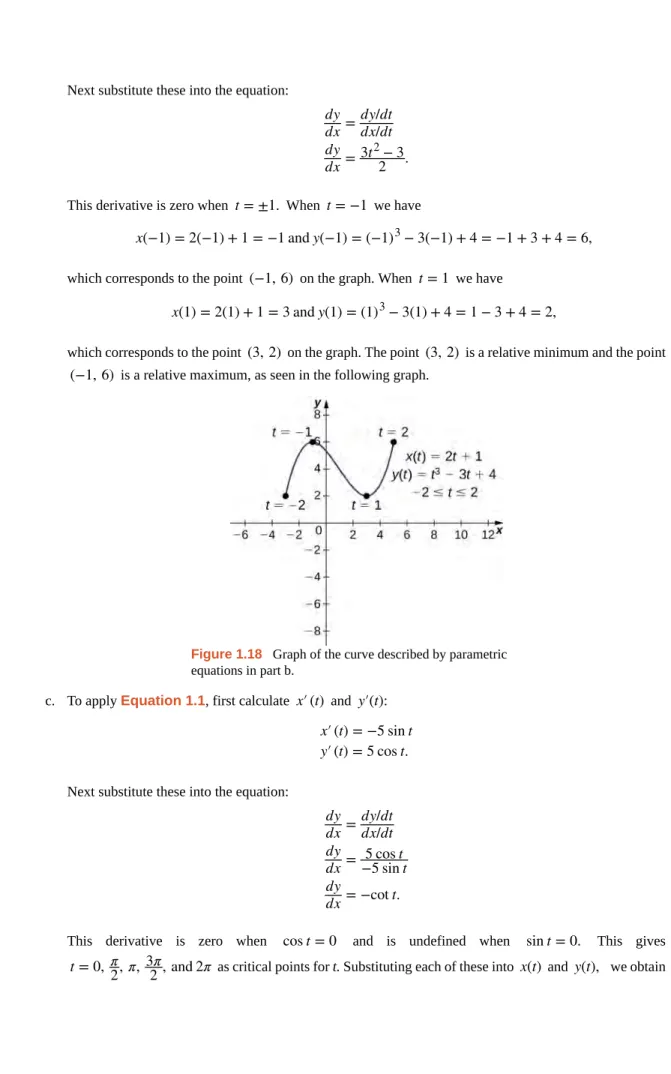
This derivative is zero when t = ±1. When t = −1 we have
x(−1) = 2(−1) + 1 = −1 and y(−1) = (−1)3− 3(−1) + 4 = −1 + 3 + 4 = 6,
which corresponds to the point (−1, 6) on the graph. When t = 1 we have
x(1) = 2(1) + 1 = 3 and y(1) = (1)3− 3(1) + 4 = 1 − 3 + 4 = 2,
which corresponds to the point (3, 2) on the graph. The point (3, 2) is a relative minimum and the point
(−1, 6) is a relative maximum, as seen in the following graph.
Figure 1.18 Graph of the curve described by parametric equations in part b.
c. To applyEquation 1.1, first calculate x′ (t) and y′(t):
x′ (t) = −5 sin t y′ (t) = 5 cos t.
Next substitute these into the equation:
dy dx = dy/dtdx/dt dy dx = −5 sin t5 cos t dy dx = −cot t.
This derivative is zero when cos t = 0 and is undefined when sin t = 0. This gives
1.4 t x(t) y(t) 0 5 0 π 2 0 5 π −5 0 3π 2 0 −5 2π 5 0
These points correspond to the sides, top, and bottom of the circle that is represented by the parametric equations (Figure 1.19). On the left and right edges of the circle, the derivative is undefined, and on the top and bottom, the derivative equals zero.
Figure 1.19 Graph of the curve described by parametric equations in part c.
Calculate the derivative dy/dx for the plane curve defined by the equations
x(t) = t2− 4t, y(t) = 2t3− 6t, −2 ≤ t ≤ 3
Example 1.5
Finding a Tangent Line
Find the equation of the tangent line to the curve defined by the equations
x(t) = t2− 3, y(t) = 2t − 1, −3 ≤ t ≤ 4 when t = 2.
Solution
First find the slope of the tangent line usingEquation 1.1, which means calculating x′ (t) and y′(t):
x′ (t) = 2t y′ (t) = 2.
Next substitute these into the equation:
dy dx =dx/dtdy/dt dy dx =2t2 dy dx =1t .
When t = 2, dydx = 12, so this is the slope of the tangent line. Calculating x(2) and y(2) gives
x(2) = (2)2− 3 = 1 and y(2) = 2(2) − 1 = 3,
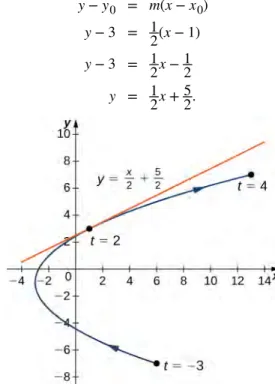
which corresponds to the point (1, 3) on the graph (Figure 1.20). Now use the point-slope form of the equation of a line to find the equation of the tangent line:
y − y0 = m(x − x0)
y − 3 = 12(x − 1) y − 3 = 12x − 12
y = 12x + 52.
Figure 1.20 Tangent line to the parabola described by the given parametric equations when t = 2.
1.5
1.6
Find the equation of the tangent line to the curve defined by the equations
x(t) = t2− 4t, y(t) = 2t3− 6t, −2 ≤ t ≤ 3 when t = 5.
Second-Order Derivatives
Our next goal is to see how to take the second derivative of a function defined parametrically. The second derivative of a function y = f (x) is defined to be the derivative of the first derivative; that is,
d2y dx2 = ddx
⎡ ⎣dydx⎤⎦.
Since dydx = dy/dtdx/dt, we can replace the y on both sides of this equation with dydx. This gives us
(1.2) d2y dx2 = ddx ⎛ ⎝dydx⎞⎠ = (d/dt) ⎛ ⎝dy/dx⎞⎠ dx/dt .
If we know dy/dx as a function of t, then this formula is straightforward to apply.
Example 1.6
Finding a Second Derivative
Calculate the second derivative d2y/dx2 for the plane curve defined by the parametric equations
x(t) = t2− 3, y(t) = 2t − 1, −3 ≤ t ≤ 4.
Solution
FromExample 1.4we know that dydx = 2t =2 1t . UsingEquation 1.2, we obtain
d2y
dx2 = (d/dt)
⎛ ⎝dy/dx⎞⎠
dx/dt = (d/dt)(1/t)2t = −t2t = −−2 2t13.
Calculate the second derivative d2y/dx2 for the plane curve defined by the equations
x(t) = t2− 4t, y(t) = 2t3− 6t, −2 ≤ t ≤ 3
and locate any critical points on its graph.
Integrals Involving Parametric Equations
Now that we have seen how to calculate the derivative of a plane curve, the next question is this: How do we find the area under a curve defined parametrically? Recall the cycloid defined by the equations x(t) = t − sin t, y(t) = 1 − cos t.
Figure 1.21 Graph of a cycloid with the arch over [0, 2π] highlighted.
To derive a formula for the area under the curve defined by the functions
x = x(t), y = y(t), a ≤ t ≤ b,
we assume that x(t) is differentiable and start with an equal partition of the interval a ≤ t ≤ b. Suppose
t0= a < t1< t2< ⋯ < tn= b and consider the following graph.
Figure 1.22 Approximating the area under a parametrically defined curve.
We use rectangles to approximate the area under the curve. The height of a typical rectangle in this parametrization is
y⎛
⎝x⎛⎝–t i⎞⎠⎞⎠for some value –t i in the ith subinterval, and the width can be calculated as x(ti) − x(ti − 1). Thus the area of the
ith rectangle is given by
Ai= y⎛
⎝x⎛⎝–ti⎞⎠⎞⎠⎛⎝x(ti) − x(ti − 1)⎞⎠.
Then a Riemann sum for the area is
An=
∑
i = 1 n
y⎛
⎝x⎛⎝–t i⎞⎠⎞⎠⎛⎝x(ti) − x(ti − 1)⎞⎠.
Multiplying and dividing each area by ti− ti − 1 gives
An=
∑
i = 1 n y⎛ ⎝x⎛⎝–t i⎞⎠⎠⎞⎛
⎝
x(tti) − x(ti − 1) i− ti − 1⎞
⎠
(ti− ti − 1) =∑
i = 1 n y⎛ ⎝x⎛⎝–t i⎞⎠⎞⎠⎛
⎝
x(ti) − x(tΔt i − 1)⎞
⎠
Δt.Taking the limit as n approaches infinity gives
A = limn → ∞An=
∫
a b1.7
This leads to the following theorem.
Theorem 1.2: Area under a Parametric Curve
Consider the non-self-intersecting plane curve defined by the parametric equations
x = x(t), y = y(t), a ≤ t ≤ b
and assume that x(t) is differentiable. The area under this curve is given by
(1.3)
A =
∫
aby(t)x′ (t) dt.Example 1.7
Finding the Area under a Parametric Curve
Find the area under the curve of the cycloid defined by the equations
x(t) = t − sin t, y(t) = 1 − cos t, 0 ≤ t ≤ 2π.
Solution
UsingEquation 1.3, we have
A =
∫
aby(t)x′ (t) dt =∫
0 2π (1 − cos t)(1 − cos t) dt =∫
0 2π (1 − 2 cos t + cos2t)dt =∫
0 2π⎛ ⎝1 − 2 cos t + 1 + cos 2t2 ⎞⎠dt =∫
0 2π⎛ ⎝32 − 2 cos t +cos 2t2 ⎞⎠dt = 3t2 − 2sint + sin24 t|
0 2π = 3π.Find the area under the curve of the hypocycloid defined by the equations
x(t) = 3 cos t + cos 3t, y(t) = 3 sin t − sin 3t, 0 ≤ t ≤ π.
Arc Length of a Parametric Curve
In addition to finding the area under a parametric curve, we sometimes need to find the arc length of a parametric curve. In the case of a line segment, arc length is the same as the distance between the endpoints. If a particle travels from point A to point B along a curve, then the distance that particle travels is the arc length. To develop a formula for arc length, we start with an approximation by line segments as shown in the following graph.
Figure 1.23 Approximation of a curve by line segments.
Given a plane curve defined by the functions x = x(t), y = y(t), a ≤ t ≤ b, we start by partitioning the interval [a, b] into n equal subintervals: t0= a < t1< t2< ⋯ < tn= b. The width of each subinterval is given by Δt = (b − a)/n. We
can calculate the length of each line segment:
d1= ⎛
⎝x(t1) − x(t0)⎞⎠2+⎛⎝y(t1) − y(t0)⎞⎠2
d2= ⎛
⎝x(t2) − x(t1)⎞⎠2+⎛⎝y(t2) − y(t1)⎞⎠2etc.
Then add these up. We let s denote the exact arc length and sn denote the approximation by n line segments:
(1.4) s ≈
∑
k = 1 n sk=∑
k = 1 n ⎛ ⎝x(tk) − x(tk − 1)⎞⎠2+⎛⎝y(tk) − y(tk − 1)⎞⎠2.If we assume that x(t) and y(t) are differentiable functions of t, then the Mean Value Theorem (Introduction to the Applications of Derivatives (http://cnx.org/content/m53602/latest/)) applies, so in each subinterval [tk − 1, tk] there exist t^k and t˜k such that
x(tk) − x(tk − 1) = x′⎛⎝^tk⎞⎠(tk− tk − 1) = x′⎛⎝^tk⎞⎠Δt
y(tk) − y(tk − 1) = y′⎛⎝t˜k⎞⎠(tk− tk − 1) = y′⎛⎝t˜k⎞⎠Δt.
ThereforeEquation 1.4becomes
s ≈
∑
k = 1 n sk =∑
k = 1 n ⎛ ⎝x′⎛⎝t^k⎞⎠Δt⎞⎠ 2 +⎛ ⎝y′⎛⎝t˜k⎞⎠Δt⎞⎠2 =∑
k = 1 n ⎛ ⎝x′⎛⎝t^k⎞⎠⎞⎠ 2 (Δt)2+⎛ ⎝y′⎛⎝t˜k⎞⎠⎞⎠2(Δt)2 =⎛ ⎝ ⎜∑
k = 1 n ⎛ ⎝x′⎛⎝t^k⎞⎠⎞⎠ 2 +⎛ ⎝y′⎛⎝t˜k⎞⎠⎞⎠2 ⎞ ⎠ ⎟Δt.This is a Riemann sum that approximates the arc length over a partition of the interval [a, b]. If we further assume that the derivatives are continuous and let the number of points in the partition increase without bound, the approximation approaches the exact arc length. This gives