HAL Id: hal-01960939
https://hal.sorbonne-universite.fr/hal-01960939
Submitted on 19 Dec 2018
HAL is a multi-disciplinary open access
archive for the deposit and dissemination of
sci-entific research documents, whether they are
pub-lished or not. The documents may come from
teaching and research institutions in France or
abroad, or from public or private research centers.
L’archive ouverte pluridisciplinaire HAL, est
destinée au dépôt et à la diffusion de documents
scientifiques de niveau recherche, publiés ou non,
émanant des établissements d’enseignement et de
recherche français ou étrangers, des laboratoires
publics ou privés.
Infrared Galaxies
Andreea O. Petric, Lee Armus, Nicolas Flagey, Pierre Guillard, Justin Howell,
Hanae Inami, Vassillis Charmandaris, Aaron Evans, Sabrina Stierwalt, Tanio
Diaz-Santos, et al.
To cite this version:
Andreea O. Petric, Lee Armus, Nicolas Flagey, Pierre Guillard, Justin Howell, et al.. Warm Molecular
Hydrogen in Nearby, Luminous Infrared Galaxies. Astronomical Journal, American Astronomical
Society, 2018, 156 (6), pp.295. �10.3847/1538-3881/aaca35�. �hal-01960939�
Draft version May 28, 2018
Typeset using LATEX twocolumn style in AASTeX62
Warm Molecular Hydrogen in Nearby, Luminous Infrared Galaxies
Andreea O. Petric,1, 2 Lee Armus,3 Nicolas Flagey,2 Pierre Guillard,4Justin Howell,3 Hanae Inami,5 Vassillis Charmandaris,6, 7 Aaron Evans,8, 9 Sabrina Stierwalt,8, 9 Tanio Diaz-Santos,3, 10 Nanyao Lu,11, 12 Henrik Spoon,13 Joe Mazzarella,3 Phil Appleton,3 Ben Chan,3 Jason Chu,1 Derek Hand,14George Privon,15
David Sanders,1 Jason Surace,3 Kevin Xu,3 and Yinghe Zhao3, 16, 17, 18
1Institute for Astronomy, 2680 Woodlawn Drive, Honolulu,HI, 96822,USA 2Canada-France-Hawaii Telescope, 65-1238 Mamalahoa Highway, Kamuela, HI, 96743, USA
3Infrared Processing & Analysis Center, MS 100-22, California Institute of Technology, Pasadena, CA, 91125, USA 4Institut d’Astrophysique de Paris, 96 bis boulevard Arago, 75014 Paris, France
5Universite de Lyon, 92 Rue Pasteur, 69007, Lyon, France 6Department of Physics, University of Crete, GR-71003 Heraklion, Greece
7IAASARS, National Observatory of Athens, GR-15236, Penteli, Greece 8Department of Astronomy, University of Virginia, Charlottesville, VA, 22903, USA 9National Radio Astronomy Observatory, 520 Edgemont Road, Charlottesville, VA, 22903, USA
10Nucleo de Astronomia de la Facultad de Ingenieria, Universitad Diego Portales, Av. Ejercito Libertador 441, Santiago, Chile 11National Astronomical Observatories, Chinese Academy of Sciences (CAS), Beijing 100012, China; nanyao.lu@gmail.com
12China-Chile Joint Center for Astronomy, Camino El Observatorio 1515, Las Condes, Santiago, Chile 13Department of Astronomy, Cornell University, 616A Space Science Building, Ithaca, NY, 14853, USA
14Department of Physics and Astronomy, University of Hawaii, 200 W. Kawili St., Hilo, HI 96720
15Instituto de Astrofisica, Facultad de Fisica, Pontificia Universitad Catolica de Chile, Casilla 306, Santiago 22, Chile 16Yunnan Observatories, CAS, Kumming 65011, China
17Key laboratory for the Structure and Evolution of Celestial Objects, CAS, Kumming 65011, China 18Purple Mountain Observatory, CAS, Nanjing, 210008, China
ABSTRACT
Mid-infrared molecular hydrogen (H2) emission is a powerful cooling agent in galaxy mergers and in radio galaxies; it is a potential key tracer of gas evolution and energy dissipation associated with mergers, star formation, and accretion onto supermassive black holes. We detect mid-IR H2 line emission in at least one rotational transition in 91% of the 214 Luminous Infrared Galaxies (LIRGs) observed with Spitzer as part of the Great Observatories All-sky LIRG Survey (GOALS). We use H2 excitation diagrams to estimate the range of masses and temperatures of warm molecular gas in these galaxies. We find that LIRGs in which the IR emission originates mostly from the Active Galactic Nuclei (AGN) have about 100K higher H2 mass-averaged excitation temperatures than LIRGs in which the IR emission originates mostly from star formation. Between 10 and 15% of LIRGs have H2 emission lines that are sufficiently broad to be resolved or partially resolved by the high resolution modules of Spitzer’s Infrared Spectrograph (IRS). Those sources tend to be mergers and contain AGN. This suggests that a significant fraction of the H2 line emission is powered by AGN activity through X-rays, cosmic rays, and turbulence. We find a statistically significant correlation between the kinetic energy in the H2gas and the H2to IR luminosity ratio. The sources with the largest warm gas kinetic energies are mergers. We speculate that mergers increase the production of bulk in-flows leading to observable broad H2 profiles and possibly denser environments.
1. INTRODUCTION
Molecular hydrogen (H2) is the material from which stars form and black holes grow. In turn, young mas-sive stars and active galactic nuclei (AGN) transfer en-ergy to the molecular hydrogen and change its physical conditions. In this paper we use several approaches to estimate if and how the molecular gas changes on kilo-parsec scales in response to changes in the gravitational
potential due to galaxy mergers and in response to AGN emission.
In interacting galaxies, large gas-flows move low-metallicity gas from the outer regions of the galaxy toward the center (e.g. Kewley et al. 2010). The time-scales for this process seem to be on the order of 1 Gyr: Rupke et al. (2010) find that in the approximate time between first and second passage in a merger, the
tral metallicity becomes diluted by low-metallicity gas flowing in from the metal-poor outskirts of the merging galaxies. Kinematic signatures in the warm molecular gas may indicate bulk flows on similar timescales.
The amount of interstellar medium (ISM) available for star formation determines a galaxy’s evolution. Be-cause star formation is enhanced in interacting galaxies (e.g. Patton et al. 2013), mergers may consume their gas supply at a higher rate than non-mergers (e.g Mi-hos & Hernquist 1996; Springel 2000; Hayward et al. 2011). However, observational studies of gas in post-mergers find them to have more neutral hydrogen than non-mergers (e.gEllison et al. 2015;Larson et al. 2016). While there are large variations of gas properties in interacting galaxies (e.g Haan et al. 2011a; Fern´andez et al. 2014), mergers may have more cold gas than non-mergers because of inflows from cooled ionized halo gas (Ellison et al. 2015; Braine & Combes 1993). If such inflows include a warm molecular phase it could take the form of asymmetric emission profiles or red-shifted components. One of our goals in this work is to comple-ment studies of atomic hydrogen in mergers, and trace the fate of the warm molecular gas component in the ISM of nearby star-forming galaxies.
Our investigation focuses on warm molecular gas as traced by H2 rotational emission lines (Table 1) in a sample of nearby, Luminous Infrared Galaxies (LIRGs). LIRGs are galaxies with L(8 − −1000µm) = LIR ≥ 1011L a subset of which have LIR ≥ 1012L and are called Ultraluminous Infrared Galaxies (ULIRGs: Sanders & Mirabel 1996). Because LIRGs can have a wide range of optical classifications and because they span the full range of galaxy interactions from non-merging spirals to late stage mergers they are well suited for the study of how AGN and mergers impact the ISM (Armus et al. 2009;Petric et al. 2011;Larson et al. 2016; Psychogyios et al. 2016; Stierwalt et al. 2013; Privon et al. 2015). Furthermore, LIRGs bridge the luminosity gap between nearby star-forming galaxies and quasars and so they may provide the link between the extreme objects we see at high redshift and typical nearby sys-tems.
The LIRGs we study here are part of the Great Ob-servatories All-sky LIRG Survey (GOALS) which tar-gets a representative sample of 202 systems in the local Universe (z ≤ 0.088) selected from the IRAS Revised Bright Galaxy Sample (Sanders et al. 2003). An outline of the GOALS project and a multi-wavelength analysis of the LIRG VV 340 are given in Armus et al.(2009). Results from the MIR spectroscopy of the GOALS sam-ple were presented in Evans et al. (2008), Inami et al. (2010), D´ıaz-Santos et al. (2010), D´ıaz-Santos et al.
(2011), D´ıaz-Santos et al. (2014), Petric et al. (2011), Mazzarella et al.(2012),Modica et al.(2012),Stierwalt et al.(2013), andStierwalt et al.(2014).
The connections between AGN, merger stage, and the state of the gas are complex. In a detailed, high-spectral resolution, Spitzer IRS, study of the GOALS LIRGS, Inami et al. (2013) found no correlation between fine-structure line ratios and the merger stage but found that emission lines from more highly ionized ions have broader line widths, e.g. Ne v] emission lines are broader than [Ne iii] lines, which in turn are broader than [Ne ii] lines. They also find five LIRGs whose shifted [Ne iii], [Ne v] lines suggest the presence of fast moving highly ionized gas that may be part of galactic bulk-flows. In this paper, we compare the line widths of the warm molecular gas with the contribution of the AGN to the mid-infrared (MIR) luminosity to test if the thermal en-ergy in the warm gas is contributed by the AGN.
In most LIRGs and ULIRGs, star formation domi-nates the heating of H2 (Stierwalt et al. 2014; Hill &
Zakamska 2014; Higdon et al. 2006). However, a frac-tion of LIRGs and even a larger fracfrac-tion of ULIRGs have more MIR H2 emission than what could be expected if the H2 emission originates in photo-dissociation re-gions. Stierwalt et al. (2014) use low resolution IRS data to study the H2 and dust properties of LIRGs and find that most nearby LIRGs have higher ratios of L(H2)/L(PAHs) than normal star-forming galaxies.
Stierwalt et al.(2014) show that this ratio increases with H2luminosity and that in around 10% of LIRGs, the H2 emission may be excited by shocks either from powerful starbursts or AGN. ULIRGs show on average three times more emission in the rotational transitions of molecular hydrogen than expected based on their star formation rates (Hill & Zakamska 2014). Hill & Zakamska(2014) also found a weak positive correlation between H2 emis-sion and the length of the tidal tails and a strong corre-lation between H2 and [Fe ii] suggesting that the excess H2 is produced by shocks.
Studies of warm molecular H2 kinematics may help disentangle the impact that gravitational interactions and AGN have on the interstellar medium. In this pa-per, we extract kinematic information from resolved H2 line profiles to test if mergers lead to bulk gas motions. We also estimate if and how the masses, temperatures and excitation conditions of H2 change with merger stage and with the AGN contribution to the LIRG’s IR luminosity. The paper is organized as follows. In sec-tion 2 we describe the IRS observasec-tions and reducsec-tion methods. Section 3 includes a presentation of the H2 flux measurements, a description of the method used to estimate the total warm H2masses and temperatures as
3 well as basic statistics of these quantities as a function
of merger stage, IR luminosity, and AGN contribution to the IR emission. In section 4 we discuss our findings and in section 5 we summarize our conclusions.
2. SAMPLE AND DATA
The GOALS sample properties and selection are de-scribed in detail in Armus et al.(2009). For this inves-tigation we use the spectra of 248 individual nuclei in 202 LIRG systems, observed in the high-resolution IRS modules (Short-High, and Long-High) and complemen-tary low-resolution (IRS Short-Low, Long-Low) spectra for 234 sources. The widths of the SL, SH, LL, LH slits (3.600, 4.700, 10.700, 11.100) correspond to 1.5, 2.0, 4.5, and 4.6 kpc respectively at a distance of 88 Mpc – the me-dian galaxy distance in our sample. The distances to the GOALS’s galaxies are between 17.5 and 387 Mpc. We obtained the IRS spectra in our own observing program (PI: Armus, PID 30323) for 158 LIRG systems, with the IRS spectra for the remaining 44 LIRG systems taken from the Spitzer archive. In all data from PID 30323, the IRS Staring Mode was employed, using “cluster tar-get” observations for those sources with well separated (≥ 10 arcsec) companions. Among the 202 LIRGs stud-ied, secondary nuclei were targeted only when the flux ratio of primary to secondary nucleus (as measured in the Spitzer MIPS 24 µm data) is less than or equal to five, in order to capture the spectra of the nuclei actively participating in the far-infrared emission of the system. A more detailed description of how the spectra, used for the analysis presented in this paper, were reduced is given in three previous papers: Petric et al. (2011); Inami et al.(2013);Stierwalt et al.(2013). The spectra were extracted with the SPICE1software, assuming that
the flux in the slit originates from a point source. The profile for the extraction is set automatically to match the PSF at different wavelengths. The PSF was de-termined by the IRS team from standard calibrators. Twenty eight systems were observed in spectral mapping mode. These data were assembled and cleaned to re-move noisy pixels. Nuclear spectra were then extracted with CUBISM (Smith et al. 2007a) using extraction re-gions of sizes equal to those of extraction rere-gions for point sources in the spectra taken in staring mode. A more detailed description of the spectra including the position of the IRS slits are given in Stierwalt et al. (2013), Inami et al. (2013), and the GOALS delivery documents2.
1 http://irsa.ipac.caltech.edu/data/SPITZER/docs/
datanalysys/tools/spice/
2https://irsa.ipac.caltech.edu/data/GOALS/overview.html
The GOALS sources were classified in 5 merger stages: (0) no obvious sign of a disturbance either in the IRAC or HST morphologies, or published evidence that the gas is not in dynamical equilibrium (i.e., undisturbed circu-lar orbits); (1) early stage, where the galaxies are within 1 arcmin of each other, but little or no morphological disturbance can be observed; (2) the galaxies exhibit bridges and tidal tails but they do not have a common envelope, and each optical disk is relatively intact; (3) the optical disks are completely destroyed but two nu-clei can be distinguished; (4) the two interacting nunu-clei are merged but structure in the disk indicates that the source has gone through a merger. The merger clas-sifications for LIRGs are published in Stierwalt et al. (2013), see also Fig. 10 inPetric et al.(2011). A subset of 65 LIRGs was re-evaluated by Larson et al. (2016). We acknowledge the pitfalls of morphological classifica-tions, and refer the reader to the more precise techniques requiring high sensitivity and high spatial and velocity resolution(Privon et al. 2013).
Here we seek to be consistent with previous merger-class investigations of the GOALS sample of LIRGs pre-sented in Larson et al. (2016); Stierwalt et al. (2013); Haan et al.(2011b) and we compress the merger stages into three categories: non mergers (nm) which are targets without obvious signs of morphological distur-bances; early-mergers (em) which are systems in which the interacting galaxies are within 1 arcmin of each other but show little or no morphological disturbance; and mergers (m) which are all the other stages of gravita-tional interactions.
3. RESULTS
In this section we will present: our measurements of emission line fluxes, and line-widths, how we identify resolved emission lines, how we estimate warm molecular H2 masses, temperatures, ortho to para ratios, and H2 excitation conditions.
3.1. Fluxes
To measure line fluxes and line-widths from our SH, LH and SL spectra we fit Gaussian functions to the atomic and molecular gas emission line profiles. We in-spect all the fits to ensure that spurious hot pixels were excluded. We did not use PAHFIT (Smith et al. 2007b) because it does not account for potential ice absorption. We also refer the reader toStierwalt et al. (2014) who present H2fluxes estimated from simultaneous fits of the dust and gas features and continuum in the low resolu-tion data after scaling the SL spectra to match the LL data. Here we chose to measure the H2 emission line fluxes the same way from the low and high resolution
spectra because the S0 line is not easily detected in the low resolution spectra, yet its measurement is important for determining warm molecular gas mass and temper-atures.
For each line flux measurement we average the fluxes estimated from the two IRS nods; to assess the flux er-rors we combine the uncertainties from the Gaussian fits in quadrature. We calculate upper limits from line free regions near the line of interest by estimating the total emission for a hypothetical line with: a width equal to the spectral resolution at that wavelength and a three σ intensity peak.
Figure1 shows the H2 S(0), S(1), S(2), S(3), [Fe II], [Ne II], [O IV] and [Si II] fluxes measured from IRS spectra. These plots show Nod 1 vs Nod 2 fluxes and Nod 1 fluxes versus the final flux for each of the detected lines. This figure illustrates that, for most of the sources, our estimates from each of the IRS node positions match well. For lines where the flux from the two nods differed by more than 3 × p(σF 12+ σF 22), where σF 1 and σF 2 represent the errors on the flux measured in Nod 1 and Nod 2 respectively, we choose results from the fit with the best overall signal to noise ration (SNR). In addition, we re-inspect visually the spectra to ensure the fit we use is better than the one we discard and to understand the reason for the difference between the two nods.
Table 2 gives the H2 rotational emission line fluxes and uncertainties, measured from the IRS high reso-lution spectra. Figure 2 shows histograms of the line fluxes and luminosities corresponding to the rotational transitions, S(0), S(1), and S(2). Table 3 gives detec-tion statistics for the H2 emission lines: percentages of detected sources, minimum, mean, median, maximum, and standard deviations of the detected fluxes and lumi-nosities. In particular, we find that the median H2S(0), S(1), and S(2) luminosities are 106.7, 107.1, and 106.8L
respectively. Appendix 1 describes how we combined fluxes from different modules.
3.2. Resolved Lines
The IRS high resolution modules are described in the official instrumental handbook3 as cross-dispersed
echelle spectrographs that provide a resolving power
R = λ/∆λ ∼ 600. The velocity resolution of the
high resolution modules is nominally c/R = 494 km/s between 4 and 18 µm and 503 km/s between 25 and 34.2 µm. Previous investigations of high-resolution line pro-files used measurements of the widths of standard IRS calibration targets (P Cygni, HD 190429, HD 174638)
3(Version 5.0, last modified December 12, 2012)
to assess that the uncertainty in the instrumental reso-lution is 59 km/s in SH and 63 km/s in LH (e.gDasyra et al. 2008;Guillard et al. 2012).
To take advantage of the large number of high resolu-tion, high signal-to-noise spectra of the GOALS targets, here we take a complementary approach by looking at the distribution of line widths of the H2 S(1) and S(0) lines in our sample of LIRGs. To determine the ex-pected distribution of widths for a sample of unresolved source we use two independent methods and compare our results. We include several derived line-width esti-mates that are smaller than the instrumental resolution, those are sources with poor sampling, and/or low signal to noise. We keep them here because they indicate the error budget in our overall measurements.
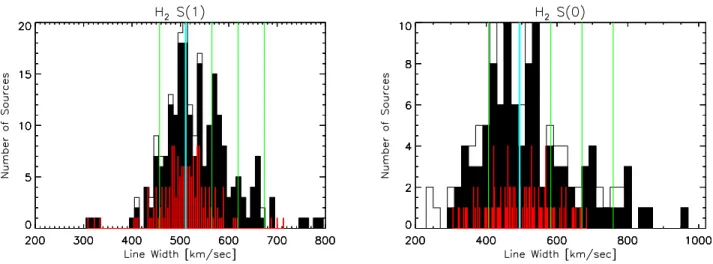
Method 1: We assume that, in the absence of re-solved sources, the distribution of H2line widths should be symmetric. Figure3 shows the histogram of the H2 S(1) and S(0) lines with 10 km/s bins. The distributions of derived line-widths show a tail of sources with larger line-widths, presumably representing the resolved and marginally resolved objects. We estimate the standard deviation and mode from measurements with a SNR of three or better.
We find that the H2 S(1) distribution has a mode of 511 km/s (RES1 thereafter), and a weighted mean of 540 km/s. Using the mode and the measurements of lines lower than the mode, we obtain a standard deviation of 56 km/s for the unresolved sources that we claim is purely of instrumental origin (σinst = 56 km/s). The value for this standard deviation is almost identical to the uncertainty quoted byDasyra et al.(2008). We look at three classes of sources: clearly resolved, marginally resolved and not resolved.
Writing: FWHM − σFWHM ≥ RES1 + n ∗ σinst, where FWHM is the measured Full Width at Half Maximum, we find three sources with n = 3 and six with n = 2. We refer to these sources as being clearly resolved. Eigh-teen nuclei have marginally resolved H2 S(1) emission with n = 1. Those eighteen marginally resolved sources would have been considered clearly resolved in earlier studies (e.gDasyra et al. 2008;Guillard et al. 2012). We present the measured properties of all these 27 sources with FWHM−σFWHM≥ 567 kms/sec in Table ??. Note that these sources are not resolved at a 1σ statistical sig-nificance level but higher, because we look at both the distribution of possible widths and the error associated with each measurement.
Method 2: In the second approach we derive the distribution of possible measurements for an unresolved source by looking at both the measured H2 line-widths (FWHM) and the errors associated with those
individ-5
Figure 1. H2 (S0), H2 (S1), H2 (S2), [Ne ii], [O iv] and [Si ii] fluxes measured from IRS spectra modules SH and LH. As described in the text each fit was inspected by hand and the continuum adjusted for bad pixels in the two nods associated with each SH or LH observation. These plots show in black the measured Nod 1 vs Nod 2 fluxes and in red Nod 1 fluxes versus the final flux for each of the detected lines.
ual measurements. Figure 4 shows the distribution of derived H2S(1) FWHM, each represented as a gaussian centered on the measured H2 line-width and a width equal to the estimated error on the measurement. Each gaussian is normalized to an area of 1. Adding up all the individual gaussian distributions gives the most proba-ble line-width measurement. Adding up all the individ-ual gaussian distribution of sources with measured H2 FWHM smaller than this value gives the probability dis-tribution of possible measurements of H2 line-width for an unresolved source. Using this probability distribu-tion and the error on each measurement for the sources we marked as marginally resolved or resolved from the previous technique, we compute the likelihood it is ac-tually unresolved. We find that the sources we marked as marginally resolved and resolved have a probability between 2 × 10⁻⁶ (for NGC 6240) and 0.1 (for VV250) to be unresolved with a median value of 0.01.
The S(0) line width distribution was more difficult to characterize because of larger error bars on the es-timated line-widths. We found different modes when we binned the line-widths distribution using bin sizes of 10, 15, 20 and 25 km/sec. The modes we find range be-tween 421 and 545 km/sec, with an average value of 494 km/sec. The weighted mean of the un-binned distribu-tion of line-widths is also 494 km/sec. We thus used the weighted mean of 494 km/sec as the most likely value for a measurement of an unresolved source. The associated dispersion is 62 km/sec. We find eight galaxies that have marginally resolved S(0) lines: NGC 0828, ESO 255-IG007, ESO 507-G070, IRAS 13052-5711, NGC 5257, CGCG 142-034, NGC 6240 and MCG +04-18-002. The measured S(1) FWHM of these source range between 603 and 781 km/s, with median of 653 km/s, while their S(0) FWHMs range between 611 and 835 km/s with a median of 785 km/s.
3.3. Excitation Diagrams, Masses and Temperatures of Molecular H2
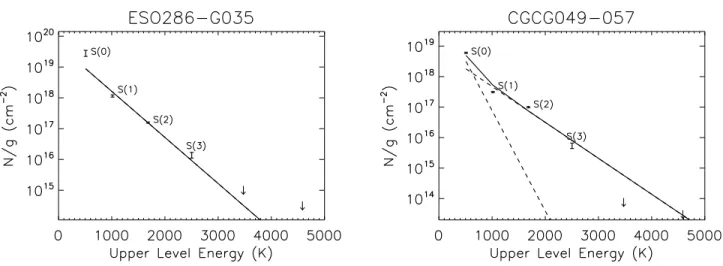
Figure 5 presents the excitation diagrams for the sources where we detected at least two of the rotational transitions in the IRS SH, LH, or SL spectra. An ex-citation diagram is a plot of the column density in the upper level of each transition (Nu), normalized by its statistical weight (gu) as a function of the temperature Tu associated with the upper level energy Eu. We in-spect visually all the excitation diagrams to determine if more than one temperature component is needed to model the data. For most sources, two temperature fits are not well constrained, i.e. the masses and tempera-tures we derive are not the results from a fit, instead they are estimates of four unknown parameters from
four emission line fluxes; therefore we cannot provide comparisons of χ2 as a function of the number of tem-perature components. We are cognizant of the limita-tions of this approach but it allows us to qualitatively and consistently compare with other samples of galax-ies analyzed in a similar fashion. There are no obvious systemic errors in this method that would erroneously lead to trends between the warm molecular gas proper-ties and the target’s morphologies (mergers versus non-mergers) or AGN contribution to the IR emission from their host galaxy.
Errors on the estimated warm H2masses and temper-atures come from: (1) measurement errors and (2) the assumption that we can describe the data with a sim-ple distribution of one or two temperature components. When we add the H2emission line flux uncertainties in quadrature we find mass estimates errors on the order of 10-15%. We assess the second source of error by using three methods to estimate warm H2masses and temper-atures and comparing the results: (1) we use only the S(1) and S(3) lines, as it was done in Hill & Zakamska (2014), (2) we fit the excitation diagrams with detected lines only, and (3) for excitation diagrams where S(0) is not detected, we use the S(0) upper limits as if they were detections and derive an upper limit on the total mass. We find that adding the S(0) line to the excita-tion diagram fit has the largest impact: the estimated masses become 1.5 larger when we include S(0) mea-surements. Because LL data often lack the sensitivity to detect the S(0) line, estimates of warm molecular gas masses based on lower resolution IRS data may be sys-tematically lower than the true values (Roussel et al. 2007;Hill & Zakamska 2014).
To compute warm molecular gas masses and temper-atures we use the same method as Ogle et al. (2010), Higdon et al (2006), and Roussel et al. (2007). We as-sume that the gas is in local thermodynamic equilibrium (LTE). The relation between the observed transitions of the H2 rotational levels and the total column density NT OT are given by:
Nu = gu NT OT exp[−Eu/(kT )]/Z(T ), (1) where Z(T ) is the partition function for the Jth state given by Z(T ) = X J exp(−EJ/kT.) (2) T = Eu2 − Eu1 k × ln(Nu1/Nu2× gu2/gu1) (3) where Nu is the column density in the upper level of each transition, gu its statistical weight, and Eu its en-ergy. The Eu/k associated with S(0), S(1), S(2) and
7
Figure 2. Histograms of measured fluxes (left) and luminosities (right) for the H2molecular gas corresponding to the following
rotational transitions, S(0) S(1), and S(2) The fluxes are given in log[ W/m−2] and the luminosities in log of solar units. Solid histogram present our detections. Dashed histograms show the upper limits, and the red vertical lines indicate the median luminosities.
S(3) as well as the statistical weights for the lines are given in Table 1. The column density Nu is related to the measured flux F emitted in a transition:
Nu= F
hνA×
4π
Ω (4)
where A is the Einstein coefficient giving the probability for spontaneous emission, hν is the transition energy and Ω is the beam solid angle. The statistical weight is a function of the rotational number J , and the spin number I, given by:
gu = (2I + 1)(2J + 1 ). (5)
The mass can be determined from NT OT with the source size derived from the size of the spectral extrac-tion region: 4.7” × 4.7” at the distance of each source (e.g. 2 kpc for a source at a redshift of 0.02) .
We estimate that the molecular H2 gas has mass-averaged effective temperatures between 92 and 650 K, and the sums of the individual mass components are between 106 and 109 M
. The derived values are esti-mates because the gas may have a distribution of tem-peratures and may originate from regions with different physical properties within the few kpc region probed by our spectra. However, such estimates are useful because they provide comparisons with similar analysis done on normal galaxies and ULIRGs. This analysis provides a practical way to characterize the true underlying gas temperatures. With the exception of two sources for which we find the coldest temperatures at 92 K and 97 K, the coldest components are above 100 K. The LIRGs IRAS 19542+1110 and ESO 339-G011 are the only two sources with total warm molecular gas masses greater than 1×10⁹M
.
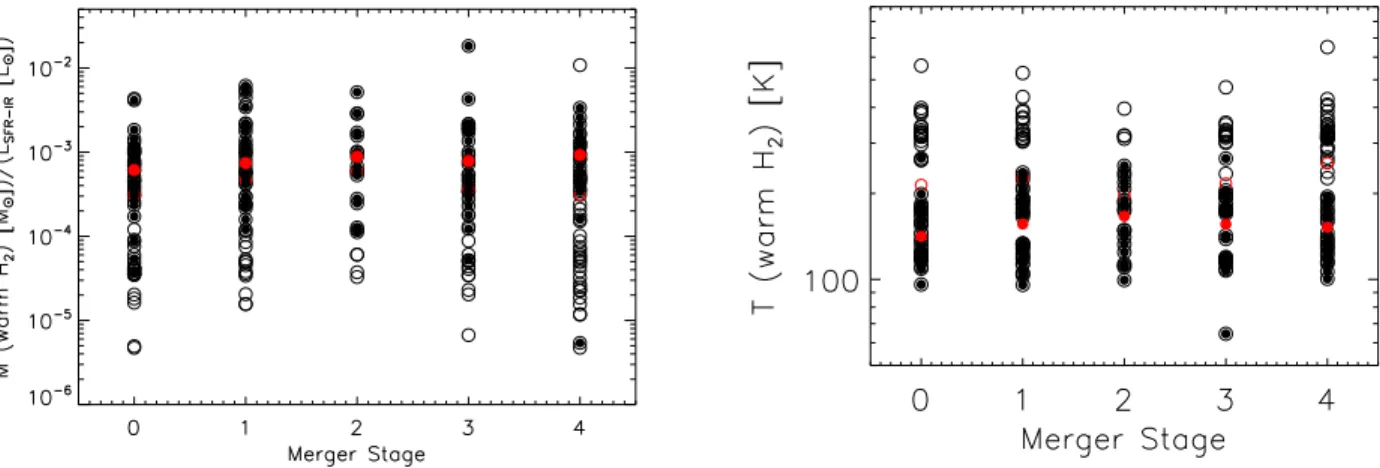
The estimated masses and temperatures of the warm molecular gas emitting in the MIR are presented in Ta-ble ??. The median temperature for sources that are well fit by one temperature component is ∼300 K. The median of the total masses is log M = 7.2 ± 0.5. Fig-ure6shows the distribution of total gas masses normal-ized by LIR and temperatures (mass - averaged tem-peratures for sources where we required at least two temperatures to fit the observed rotational lines) as a function of merger stage.
Out of the 214 nuclei for which we determine excita-tion diagrams, 103 require two temperature components. The average masses of warm molecular gas for objects in the non-interacting (n), early-mergers (em), and late stage mergers (m) are 8.3, 8.9, and 12.5 × 10⁷ M
respectively. The average temperatures of warm molec-ular gas we derive for sources in each of these respective interaction stages are 242, 243, and 277 K respectively.
3.4. Ortho to Para Ratios
To understand the impact that AGN and gravitational interactions have on the warm molecular gas we also look at the relative strengths of emission from states with odd total angular momentum to emission from states with even angular momentum (ortho to para ratios: OPR, appendix B). The H2molecule consists of two covalently bound hydrogen atoms. Because its center of mass is the same as that of its electrical charges it does not have a permanent dipole moment. Therefore H2cannot transi-tion from its ortho state (i.e. odd total angular momen-tum number J) to its para state (i.e even J). The value of the OPR is related to the history of the molecular cloud. If the gas is in local thermodynamic equilibrium (LTE), a Boltzman distribution describes the popula-tions at each energy level, and the OPR is a known function of temperature. At typical 300 K tempera-tures, the OPR is 3. Measuring OPRs that are lower than 3 may suggest that the gas is not in LTE or that the gas is thermalized at a temperature lower than 300 K (seeFlagey et al. 2013, for a similar discussion about H2O OPR). The thermalization time for H2 is of the order of 5000 years so the OPR traces the temperature of the matter with which the H2 has last thermalized beyond that time. Other interpretations for measuring OPRs that are different than 3 are related to extinction and/or the presences of multiple components along the line of sight (Flagey et al. 2013;Roussel et al. 2007, and ref. within). FollowingRoussel et al.(2007) we first de-termined which sources have non-LTE OPRs using the apparent excitation temperatures derived from the S(0), S(1), S(2) and S(3) lines. More details about how the OPRs were estimated are provided in Appendix 1 and Figure7shows several illustrative examples.
We find 30 LIRGs with OPR values that appear in-compatible with LTE conditions. Among these sources are Arp 220, NGC 3690, and NGC 0992. To test if we observe OPRs incompatible with LTE because of dust we assume that the amount of extinction is pro-portional to the silicate strength measured byStierwalt et al.(2013) using the method described inSpoon et al. (2007). The silicate strength at 9.7 µm is defined as: log(f9.7µm/C9.7µm) where f9.7µm is the flux measured at 9.7µm and C9.7µm is the continuum flux in the ab-sence of the absorption feature (see:Stierwalt et al. 2013; Spoon et al. 2007). The silicates strength of Arp 220 is one of the highest in the GOALS sample and NGC 3690 has a silicate strength of -1.65 ± 0.02 which is relatively high for LIRGs though not one of the highest ( Stier-walt et al. 2013). Extinction might be the reason why we observe an OPR incompatible with LTE in those two LIRGs. NGC 0992, however, does not appear to
9
Figure 3. Histograms for H2 S(1) (left) and H2 S(0) (right) F W HM measured in the high resolution IRS modules (using
bins of 10 km/s). In red we show our model for the distribution of possible measurements if none of the sources were resolved. (See text for details.) The standard deviation of this distribution, shown in red, is 56 km/s for the H2 S(1) transitions. The
mode and σinst of the S(0) distribution of FWHMs are 515 km/s and 103 km/s. The mode is marked in cyan, and the mode
+ 1, 2, and 3 σinst and mode - 1× σinst are labeled in green. The black solid histograms show only those widths with errors
be heavily obscured: Stierwalt et al.(2013) report a sili-cate strength of 0.05 ± 0.04 for this source. It thus seems that at least in the case of NGC 0992, either the silicate absorption does not originate in the same region as the warm H2 or, as is the case for several normal galaxies, the gas is not yet thermalized (Roussel et al. 2007). This could mean (1) that we are observing this galaxy at a peculiar moment in its evolution, which would be sur-prising given the low critical densities of H2 rotational transitions or (2) that given the large size of our beam we are recovering emission from regions with heterogenous physical conditions, with gas at different temperatures.
3.5. H2 Excitation Conditions
We seek to determine if the detected warm H2 gas is emitted primarily in photon-dominated regions (PDRs). MIR rotational lines are rapidly thermalized and hence they provide few diagnostics with which to determine the excitations mechanisms. However some conjectures can be made by comparing the emission of the warm H2 gas and that from other MIR coolants known to origi-nate in PDRs such as [Si II] and PAH emission ( Kauf-man et al. 2006; Cluver et al. 2010).
About 80% of the LIRGs nuclei in GOALS have MIR colors (using continuum fluxes measured in the IRAC 3.6, 4.5, 5.8 and 8 µm bands and 15/5.5 µm fluxes) that are consistent with a PDR origin for the observed MIR dust continuum (Petric et al. 2011). Since molecular gas and dust are closely connected we also compare the warm molecular emission properties with PDR models. We use the PDR models ofKaufman et al. (2006) who calculate the [Si ii] and H2S(0), S(1), S(2) and S(3) pure rotational line emission arising from PDRs in massive star-forming regions.
Kaufman et al. (2006) computed simultaneous solu-tions for the chemistry, radiative transfer, and thermal balance in PDRs and assumed that in the outer layers the PDR contains singly ionized carbon, silicon and iron with a temperature greater than 100 K. The observed [Si ii] emission at 35 µm is thought to come from this outer layer of PDR. The rotational H2transitions (seen in MIR) and the ro-vibrational H2lines (seen in NIR) are thought to come from a deeper layer where the H I /H2 transition is supposed to occur. The resultant emission is a function of the PDR density n and of the incident FUV ( 6.0 eV ≤ hν ≤ 13.6 eV) flux. The FUV inci-dent radiation is described in terms of G0 : 1.6 × 10⁻³ ergs cm−2, value comparable to estimates of the local interstellar field in the Milky Way.
Figure8shows the combinations of G0 and density n possible for the observed [Si ii] and H2 flux ratios. We find that our measurements can best be modeled by a
PDR/HII model with log(G0) values between 2.3 and 2.8 and log(n) between 4.1 and 4.6. In Figure8we test for systematic differences between: AGN-dominated sources and non-AGN dominated sources, mergers and isolated galaxies, targets with resolved H2emission and those without. We find that AGN-dominated sources appear to have a wider range of possible G0 and den-sity n conditions, similar to the work of Lambrides et al. (2018 submitted) who analyze a sample of 2200 active galaxies observed by Spitzer IRS and find that AGN-dominated galaxies have a wider range of dust-grain properties.
For two sources, III Zw 35 and NGC 1961, the S(1) to [Si ii] ratios are higher than what can be expected from the PDR models. Those sources are not detected in [O iv] suggesting that if any AGN were present, its MIR emission does not contribute to the overall MIR luminosity of the galaxy because either it is obscured or the AGN is MIR-faint compared to MIR emission from star-forming regions. III Zw 35 was characterized as a LINER by Carrillo et al. (1999) on the basis of the Veilleux & Osterbrock (1987) classification. Based on its detection in the 2-10 keV X-ray band with Chandra at a level of 7 ± 2 × 10⁻¹⁵ erg/s/cm2, and X-ray hard-ness it was characterized as a Compton-thick source by Gonz´alez-Mart´ın et al. (2009). Similarly NGC 1961 is part of theCarrillo et al.(1999) LINER catalogue, and was detected with the Einstein X-ray observatory in the 0.2-4.0 keV band at a level of 7 ± 3 × 10⁻¹³ erg/s/cm2 (Fabbiano et al. 1992). The X-ray detections of these LINER galaxies suggest that an XDR model might be more suitable to the data here Meijerink et al.(2007), and that the sources may be heavily obscured. Both objects are among a small percentage (4%) of LIRGs where we detect the H2 S(5) lines and their excitation diagrams suggest that the warm molecular gas is not well described by a single temperature.
4. DISCUSSION
Nearby LIRGs appear to have higher H2/PAH flux ra-tios than normal star-forming galaxies (Stierwalt et al. 2014). Stierwalt et al.(2014) use simultaneous fits to the dust and gas emission and continuum features in the low resolution IRS data to determine that around 10% of LIRGs have H2 emission that is not consistent with PDR models and so could be instead excited by shocks from powerful starbursts or AGN. They also find that LH2/LPAHs ratios are positively correlated to LH2 and
are not correlated with the silicate optical strengths, un-like in ULIRGs (Zakamska 2010). Stierwalt et al.(2014) explain this difference between LIRGs and ULIRGs by suggesting that the excitation mechanisms of warm H2
11
Figure 4. The distribution of derived H2 line F W HM (obtained from fitting each line with a Gaussian) each represented as a
(grey) gaussian centered on the measured H2line-width and a width equal to the estimated error on the measured H2line-width;
the peak of each gaussian is set to normalize its area to 1. Adding up all the individual gaussian distributions gives gives the most probable line-width measurement for the LIRGs in our sample and is represented as the red solid-line curve. The solid-line black Gaussian gives the probability distribution of possible measurements of H2 line-width for an unresolved source and was
obtained by adding up all the probability distribution for the 94 unresolved sources shown as blue, dotted Gaussian curves. We used this probability distribution and the error on each measurement to compute the likelihood a source is unresolved. The derived estimates that appear lower than the instrumental resolution are sources with poor sampling, and/or low signal to noise. We keep them here because they indicate the error budget in our measurements.
Figure 5. Excitation diagrams. The electronic version and appendix C contain all the excitation diagrams. Here we only show 2 examples of sources well fit by 1 and 2 temperature components.
outside photo-dissociation regions, i.e. shocks and AGN are less common in LIRGs than they are in ULIRGs. Here we use data at higher spectral resolution to (1) in-vestigate the kinematics of the warm H2, (2) estimate H2 masses and temperatures, and (3) use [Si ii] and OPR analysis to look at the gas excitation conditions. We discuss theoretical predictions that (1) mergers lead to inflows of gas toward the center and (2) AGN impact the distribution of central molecular gas, through outflows, shocks, and an abundance of cosmic rays.
To compare our measurements of LIRGs to those of normal galaxies and ULIRGs, mergers to non-mergers, and pure starbursts to AGN dominated sources, we per-form statistical tests that rely on both detections and upper limits to determine the probability that two sam-ples are drawn from the same population. The inter-action stages we use for this analysis are derived from those used inPetric et al. (2011), and re-analyzed with help from the work ofStierwalt et al.(2013) andLarson et al.(2016) (but see alsoPetty et al.(2014);Haan et al. (2011a)). We use three broad categories: non-mergers, mergers, and early-mergers. We call a LIRG AGN dom-inated if its 6.2 PAH equivalent width is less than 0.27 and the high ionization [Ne v] is detected or the ratio of [O iv] /[Ne ii] is larger than 1.75 (Armus et al. 2007; Veilleux et al. 2009; Petric et al. 2011; Stierwalt et al. 2013).
We used the Astronomy SURVival analysis (ASURV) statistical package (Feigelson & Nelson 1985;Isobe et al. 1986). When we compare flux ratios or fluxes with upper-limits we present the average probability that the two samples are drawn from the same population us-ing the followus-ing 5 non-parametric tests: (1) the Gehan Generalized Wilcoxon Test using permutation variance, (2) Gehan’s generalized Wilcoxon test using
hypergeo-metric variance, (3) Logrank test, (4) Peto & Peto Gen-eralized Wilcoxon Test and (5) Peto & Prentice Gener-alized Wilcoxon Test. When we compare kinematics or dust gas masses we use the Kolmogorov-Smirnov (KS) statistical test. The numbers we provide are: how dif-ferent two samples are based on their cumulative distri-butions and the statistical significance of their difference based on the probability that they are drawn from the same population.
We compare our fluxes and luminosities with those of normal galaxies and ULIRGs. Comparisons using the ratios of S(0) to IR and S (1) to IR are shown in table 5. We find that the most significant differences are be-tween normal (nearby, non-merging, galaxies discussed in Roussel et al. 2007) and LIRGs, as well as between LIRGs and ULIRGs (Higdon et al. 2006). The sources investigated by Roussel et al. (2007) are at closer dis-tances and contain fewer sources where the AGN dom-inates the IR emission than the LIRGs in our sample. Because the normal galaxies presented inRoussel et al. (2007) are closer than the GOALS LIRGs, and because fewer sources in the Roussel et al. (2007) sample are mergers, the IRS spectra probe regions of different sizes and that may experience different processes.
4.1. Kinematics as a function of interaction stage, and the AGN contribution to the LIR
One of the goals of this work is to estimate if we can identify the kinematic signatures that gravitational in-teractions and AGN leave on the ISM on kpc scales. To do this we separated the sources in two groups: 194 LIRGs with unresolved H2 lines and 27 sources with resolved and marginally resolved H2 lines (See section 3.1.2) to determine if they are resolved simply because of geometry, or if they have different H2properties. While
13
Figure 6. H2 masses normalized by the LIR (left) and temperatures (right) versus merger stage. Filled circles use S(0)
Figure 7. Temperatures as a function of OPR, the thickness of the lines represent the errors associated with the determination of temperature. Here we provide several examples representative of the observed range of properties.
15
Figure 8. Grayscales showing the most probable region of the (n, G0) space for top: LIRGs with AGN producing more than
50% of the MIR emission versus LIRGs in which processes associated with star formation contribute to most of the observed MIR, middle: LIRGs showing signs of gravitational interactions versus those without and bottom: LIRGs with relatively broad H2 velocity profiles. These estimates are based on their combined S1/S0, S1/S2, and S1/SiII ratios and on the models of
LIRGs with resolved H2 lines appear to have more and hotter gas the results are not highly statistically signifi-cant. Table7summarizes the statistics presented here. To test if the H2 line broadening may come from ro-tation of a highly inclined massive galaxy, we visually inspect the 27 sources with resolved and marginally re-solved H2 line profiles to see how many appear highly inclined. However, because most sources with broader profiles are mergers and we lack higher resolution spatial and kinematic information, we cannot properly deter-mine the inclination of the inner few kpc probed by the IRS spectra. ESO353-G020, UGC03351, ESO507-G070, and NGC 7771 could have broader profiles because of rotation: their profile widths are consistent with what we would expect for a spiral of inclination of more than 30◦, and a mass to light ratio of order 3.8.
Differences between the H2S(1) to [Si ii] flux ratios of resolved and not-resolved sources would indicate differ-ences in excitation conditions either because of different radiation fields strengths, spectral shapes or overall den-sities. The marginally resolved sources appear to have above average H2 luminosities relative to the 6.2 µm PAH emission and to the [Si ii] emission. Our small sample of resolved sources makes it difficult to extract statistically significant conclusions. However we provide this analysis for completeness.
Guillard et al. (2012) find resolved H2 lines in radio galaxies,Dasyra & Combes(2011) find them in optically selected AGN, and Ogle et al. (2012) find them in z∼ 2 radio galaxies. Here we wish to test if the AGN at the cores of LIRGs also impact their surrounding ISM. From our sample of LIRGs with broad H2 lines, only two sources show detectable [Ne v] at 14.3 µm emission. However, these objects show low [Ne v] /[Ne ii] ratios of 0.08 and 0.05, with an average AGN contribution to the total IR luminosity (∼ 8 − 1000µm) of 13% which is the same as the mean of the entire sample of LIRGs (Petric et al. 2011). The S(1) line-widths we measure for LIRGs are lower than those observed in powerful radio galaxies or ULIRGs.
Supermassive black holes at the centers of spheroidal galaxies can supply more energy to the galaxy than the binding energy of the galaxy, even when they grow slowly and have a low feedback efficiency (Hopkins et al. 2006). In simulations, AGN in gas rich mergers produce molecular gas outflows; when the outflows have compo-nents on the direction of our line of sight, they can be ob-served as kinematic features such as broad and/or asym-metric emission-line profiles (Narayanan et al. 2006). Assuming that the viewing geometries of ULIRGs and LIRGs are not statistically different we would expect that the fraction of ULIRGs with AGN and broad H2
lines should be similar to that of LIRGs, yet we find rela-tively fewer LIRGs with broad H2profile. Fewer LIRGs than ULIRGs have AGN that contribute significantly to their host IR, so our observation could be low number statistics or suggest that the feedback efficiency is higher in ULIRGs than it is in LIRGs.
Mergers are also known to enhance the H2 emission (e.g.Peterson et al. 2012;Guillard et al. 2009,2012), and about 40% of LIRGs are mergers. However it may be that H2 emission shocked by the tidal interactions, like that observed in the bridge of the early stage merger the Taffy Galaxies (Peterson et al. 2012), was not captured in our nuclear MIR spectroscopic observations which were focused on the LIRGs nuclei and not the diffuse extended IR emission. The eight galaxies with broad S(0) and S(1) emission profiles appear to be interacting. This may be consistent with shocks associated with tidal interactions being an energetically significant source of exciting the molecular gas. For all LIRGs with resolved and marginally resolved H2 S(1) lines we approximate the kinetic energy (Ekin) of H2 as 3/2 MH2σ
2
H2 where
MH2 is the mass of warm H2gas (section 3.2) and σH2 is
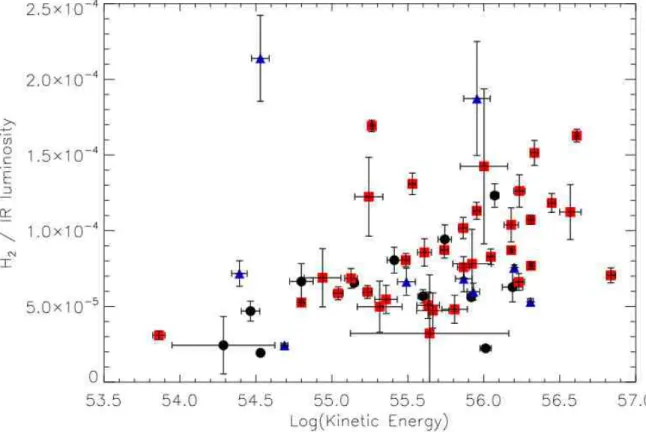
the velocity dispersion (section 3.1.2). We find a statis-tically significant correlation (i.e. probability that they are not correlated is 0.04) between the kinetic energy in the H2gas and the ratio of L(H2S(1)) to the LIR(Figure
9). While the observed L(H2S(1)) to the LIR ratios are compatible with H2excitation by UV pumping, we may see evidence for collisional excitation at kinetic energies greater than 1055 ergs.
The sources with the largest warm gas kinetic ener-gies are mergers. A possible explanation for our find-ings is that mergers increase the production of bulk in-flows leading to observable broad H2 profiles and pos-sibly denser environments and larger masses of warm molecular gas in the central regions of advanced stage mergers than in non-mergers. Outflows associated with the central region can also explain some of the broader profiles. Using the continuum source sizes from D´ıaz-Santos et al. (2011) and stellar masses of 1011 M
we estimate escape velocities for the gas that range from ∼ 300 to ∼ 1000 km/s. The combination of merger tidal interactions, star formation and AGN activity in those sources may dramatically affect the overall state of the molecular gas by pushing a fraction of it out of the LIRG. We speculate that while outflows may be im-portant, bulk molecular gas inflows may also be present (e.g. Yamashita et al. 2017); those inflows move suffi-cient gas to the center to fuel star formation and AGN accretion which lead to turbulence and heating of the molecular gas to 100-1000K, i.e. the warm gas observed
17
Figure 9. The estimated kinetic energy in the warm H2 gas correlates well with the ratio of LH2S(1) to LIRfor non-mergers
in the MIR. Both inflows and outflows generate turbu-lence and heat of the molecular gas (Beir˜ao et al. 2015). One way to put our investigation of H2 in LIRGs in the context of the study of how AGN and gravitational interactions impact the ISM is to compare it with studies of neutral hydrogen. Gravitational interactions do not appear to significantly affect the neutral gas to stellar mass ratios in galaxies throughout the merger sequence and post-mergers may on average be more gas rich than isolated galaxies (e.g.Ellison et al. 2015). However, in-teractions may be responsible for the cooling of halo-gas and lead to central build up of molecular gas (e.g.Braine & Combes 1993). Our finding that in some advanced mergers the kinetic energy of the warm molecular gas in the central few kpcs is correlated to the ratio of H2to IR luminosities is consistent with this scenario. Advanced mergers tend to host more AGN (e.gPetric et al. 2011; Veilleux et al. 2009) and the ratio of H2 to PAH lumi-nosity increases with H2luminosity in LIRGs (Stierwalt
et al. 2014) and in ULIRGs (Hill & Zakamska 2014). Inami et al.(2013) found five nearby LIRGs with asym-metric [Ne III] and [Ne V] emission lines. We do not find any asymmetric H2resolved profiles, or with signif-icant central velocity shifts but this may be due to the comparatively lower signal to noise of the H2lines. Spa-tially resolved NIR spectroscopic studies (e.g Medling et al. 2015; Rupke et al. 2010) are required to confirm that the the broader MIR profiles are associated with inflow of cooled halo gas.
4.2. Masses and Temperatures as a function of interaction stage, and the AGN contribution to
the LIR
Petric et al. (2011) found there are relatively more AGN dominated sources among late-stage mergers than star formation dominated sources, compared to non-interacting LIRGs. While we did not find any statis-tically significant differences between the H2 masses of mergers and non-mergers, late-stage mergers have the highest warm molecular H2 masses and temperatures. However the difference decreases when we normalize the H2 masses by the IR luminosities, making it difficult to extract strong conclusions from this finding.
When we only use the 128 fits with S(0) detections we (1) no longer find that late mergers have the high-est masses, but we still find that the advanced mergers show higher mass-averaged temperatures and (2) find that AGN-dominated sources have about 100K higher mass-averaged temperatures than star formation domi-nated LIRGs. KS tests do not indicate a statistically sig-nificant difference between the LIR/MH2 ratios of
merg-ers and those of non-mergmerg-ers.
The median warm molecular gas mass for sources with an AGN contribution greater than 50% of the total IR luminosity is 2.3 ×10⁷M
, and for sources where an AGN contributes less than 10% to the total IR lumi-nosity it is a few times higher at 1.2 ×10⁸M
. The KS statistical difference between them is 0.3 and the prob-ability that they are drawn from the same population is 2%. The mean and median ratios of LIR to MH2 for
AGN dominated sources are 1.2 and 0.6 ×10⁴ L /M , and those for starburst dominated sources are 1.8 and 0.3 ×10⁴L
/M , with a KS statistic difference between them of 0.17 and a probability that they are the same population of 38%. The average and median temper-atures for AGN dominated sources are 313 and 296 K while those of SB dominated galaxies are 203 and 177 K respectively. The KS statistic differences between the two distributions of temperatures is the largest for any comparison done in the sample, 0.446, with a probabil-ity of effectively 0 that they are drawn from the same populations.
Statistical differences between the warm gas proper-ties of AGN dominated LIRGs and star formation dom-inated LIRGs are more significant than the differences between mergers and non-mergers and as significant as those between LIRGs and ULIRGs, and between LIRGs and normal-galaxies (table7).
4.3. H2 excitation conditions as a function of interaction stage, and the AGN contribution to
the LIR
In Figure10we compare the H2 S(1) emission versus the [Si ii] emission, both normalized by the LIR lumi-nosity. This comparison is important because H2 and [Si ii] are both tracers of the warm interstellar medium but their relative intensities vary as a function of the radiation field intensity and the metallicity (Kaufman et al. 2006).
The correlation between the H2/IR and [Si ii]/IR lu-minosity ratios (Figure 10) suggests that those cool-ing lines have a common origin for the majority of the sources but that advanced stage mergers may have more diverse H2 heating mechanisms. While we do not find statistically significant differences between the [Si ii] to H2 S(1) emission line ratios in mergers from those in non-mergers, mergers have a lower median [Si ii] to H2 S(1) emission line ratios (9 versus 12) though the disper-sion is large (5 for non-mergers and early stage mergers and 8 for mergers) (Figure11).
These results confirm those of Peterson et al. (2012) who point out that while mergers can enhance the to-tal H2 emission, the observed H2 properties are highly dependent on the collision geometry and on the initial
19
Figure 10. Comparison between the ratios of H2 S(1) emission to the IR luminosity versus the ratios of [Si II] to the IR
luminosity for non-mergers (black), early stage mergers (blue) and advanced mergers (red). Sources with resolved and marginally resolved S(1) lines are shown as (green) crosses. Sources with a significant AGN contribution to the total IR luminosity are shown as (magenta) stars.
Figure 11. Histograms of [Si II] to H2 S(1) emission line ratios for: (left) non-mergers, (center) early-stage mergers, and (right)
mergers. The standard deviation of the distribution of [Si II] to H2 S(1) line emission ratios is two times larger for mergers than
it is for early-stage mergers and non-mergers. The median [Si II] to H2 S(1) emission line ratios are ∼ 12 for non-mergers and
conditions of the mergers. It is thus not surprising that we do not find strong trends with interaction stage or the IR emission.
5. SUMMARY AND CONCLUSIONS
We present measurements of the rotational transitions of molecular hydrogen observed in a MIR spectroscopic survey of 202 LIRG nuclei with Spitzer IRS. We detect H2 emission in at least one rotational transition in 91% of the sources, S(1) being the most commonly detected transition. The ratio of H2 S(0)+S(1)+S(2) luminos-ity to the IR luminosluminos-ity ranges between 2.3 ×10⁻⁶ and 0.014.
We perform a statistical analysis of the S(0) and S(1) lines and their ratios to the IR luminosity, including upper-limits, to investigate if there are systematic differ-ences between the H2properties of LIRGs in our sample, normal galaxies as measured by Roussel et al. (2007), and ULIRGs as measured byHigdon et al. (2006). We find that the probability that LIRGs and normal galax-ies are drawn from the same population is null while the probability that LIRGs and ULIRGs are drawn from the same population is 16%. We compare in a simi-lar statistical fashion the H2 S(0), S(1), and H2 [S(1)+ S(2)]/LIR for merging versus non-merging LIRGs and for AGN-dominated LIRGs versus star formation dom-inated LIRGs. We find probabilities of 39% and 30%, respectively, that those samples of galaxies are drawn from the same population.
We compare the ratios of the H2lines to the [Si II] line in the context of the theoretical models of PDR/HII regions of Kaufman et al. (2006). Our measurements can be modeled by FUV radiation field values between 102.0 and 102.8 and hydrogen nucleus densities n be-tween 103.5 and 104.5 cm−3.
For 78 sources where we detect at least 4 transitions with high SNR, we investigate if the temperatures esti-mated from the S(0), S(1), S(2) and S(3) lines are consis-tent with an ortho to para ratio expected for thermalized gas. For half of the sources the observed S(0) to S(3) lines suggest that the gas is either non-thermalized or that we are observing emission from regions at different temperatures.
We compute excitation diagrams and use them to es-timate the masses and temperatures of warm molecu-lar gas in 214 LIRG nuclei in the GOALS sample. We find that the masses of warm gas in advanced mergers are slightly larger than those of non-interacting systems, and that the statistical differences between the warm gas properties of AGN dominated sources and non AGN dominated sources are more significant than the dif-ferences between mergers and non-mergers. AGN may
power a fraction of the H2indirectly through dynamical perturbations which may be responsible for both exten-sive shocks in the ISM and an increased rate of accre-tion onto the supermassive black hole. One way to look for the connection between dynamical perturbations and the warm H2 gas is to look for sign of kinematic pecu-liarities. In Petrus et al. (in prep.) we use data from the Gemini Near Infrared Spectrograph to show that such peculiarities are common among LIRGs with excess H2 emission.
We find that between 10 to 15% of LIRGs have re-solved or marginally rere-solved S(0) and/or S(1) lines and that those sources tend to be mergers and have a slightly higher fraction of AGN dominated sources among them. As was pointed out in Peterson et al. (2012), while mergers can have a significant enhancing effect on the total H2luminosity emitted, the observed H2properties are highly dependent on the collision geometry and on the initial conditions of the mergers. Those sources with resolved lines also tend to have slightly higher H2 /IR luminosity ratios suggesting either higher G0 or higher densities. We find a correlation between the kinetic en-ergy in the warm molecular gas and the intrinsic H2line widths.
These data, in conjunction with the findings of Elli-son et al. (2015) and Yamashita et al. (2017), suggest that the velocity broadening observed in some H2 pro-files may be due to inflow of halo gas that feeds central star formation and the central supermassive black hole which in turn produce outflows that impart kinetic en-ergy to the central molecular gas. Alternatively inflows of gas from the galaxies’s disk may stimulate star forma-tion and AGN activity which heat the warm molecular gas to sufficiently high temperatures to be detected via MIR H2 lines.
Both interpretations are consistent with the narra-tive of quasar formation that starts with two interacting gas rich galaxies, passes through an obscured, reddened QSO and ends with an optically luminous QSOs. Those optically luminous QSOs can still have large ISM reser-voirs (e.gPetric et al. 2015) if as proposed byBraine & Combes(1993), as galaxies merge, hot gas from the halo cools and forms fresh molecular gas on dust grains.
Acknowledgments: This work is based primarily on observations made with the Spitzer Space Telescope, which is operated by the Jet Propulsion Laboratory, California Institute of Technology under NASA contract 1407. We have made use of the NASA/IPAC Extra-galactic Database (NED) which is operated by the Jet Propulsion Laboratory, California Institute of Technol-ogy, under contract with NASA. Support for this re-search was provided by NASA through an award issued
21 by JPL/Caltech. VC would like to acknowledge
par-tial support from the EU FP7 Grant PIRSES-GA-2012-316788. AP thanks T. Geballe for comments
improv-ing the clarity of the paper. NL acknowledge support by the NSFC grant #11673028 and National Key R&D Program of China grant #2017YFA0402704.
REFERENCES
Armus, L., Charmandaris, V., Bernard-Salas, J., et al. 2007, ApJ, 656, 148
Armus, L., Mazzarella, J. M., Evans, A. S., et al. 2009, PASP, 121, 559
Beir˜ao, P., Armus, L., Lehnert, M. D., et al. 2015, MNRAS, 451, 2640
Black, J. H., & Dalgarno, A. 1976, ApJ, 203, 132 Braine, J., & Combes, F. 1993, A&A, 269, 7
Carrillo, R., Masegosa, J., Dultzin-Hacyan, D., & Ordo˜nez, R. 1999, RMxAA, 35, 187
Cluver, M. E., Appleton, P. N., Boulanger, F., et al. 2010, ApJ, 710, 248
Dasyra, K. M., & Combes, F. 2011, A&A, 533, L10 Dasyra, K. M., Ho, L. C., Armus, L., et al. 2008, ApJL,
674, L9
D´ıaz-Santos, T., Charmandaris, V., Armus, L., et al. 2010, ApJ, 723, 993
—. 2011, ApJ, 741, 32
D´ıaz-Santos, T., Armus, L., Charmandaris, V., et al. 2014, ApJL, 788, L17
Ellison, S. L., Fertig, D., Rosenberg, J. L., et al. 2015, MNRAS, 448, 221
Evans, A. S., Vavilkin, T., Pizagno, J., et al. 2008, ApJL, 675, L69
Fabbiano, G., Kim, D.-W., & Trinchieri, G. 1992, ApJS, 80, 531
Feigelson, E. D., & Nelson, P. I. 1985, ApJ, 293, 192 Fern´andez, X., Petric, A. O., Schweizer, F., & van Gorkom,
J. H. 2014, AJ, 147, 74
Flagey, N., Goldsmith, P. F., Lis, D. C., et al. 2013, ApJ, 762, 11
Gonz´alez-Mart´ın, O., Masegosa, J., M´arquez, I., Guainazzi, M., & Jim´enez-Bail´on, E. 2009, A&A, 506, 1107
Guillard, P., Boulanger, F., Pineau Des Forˆets, G., & Appleton, P. N. 2009, A&A, 502, 515
Guillard, P., Boulanger, F., Pineau des Forˆets, G., et al. 2012, ApJ, 749, 158
Haan, S., Armus, L., Laine, S., et al. 2011a, ApJS, 197, 27 Haan, S., Surace, J. A., Armus, L., et al. 2011b, AJ, 141,
100
Hayward, C. C., Kereˇs, D., Jonsson, P., et al. 2011, ApJ, 743, 159
Higdon, S. J. U., Armus, L., Higdon, J. L., Soifer, B. T., & Spoon, H. W. W. 2006, ApJ, 648, 323
Hill, M. J., & Zakamska, N. L. 2014, MNRAS, 439, 2701 Hopkins, P. F., Hernquist, L., Cox, T. J., et al. 2006, ApJS,
163, 1
Huber, K., P., & Hertzberg, G. 1979, Constants of Diatomic Molecules (Van Nostrand, New York)
Inami, H., Armus, L., Surace, J. A., et al. 2010, AJ, 140, 63 Inami, H., Armus, L., Charmandaris, V., et al. 2013, ApJ,
777, 156
Isobe, T., Feigelson, E. D., & Nelson, P. I. 1986, ApJ, 306, 490
Kaufman, M. J., Wolfire, M. G., & Hollenbach, D. J. 2006, ApJ, 644, 283
Kewley, L. J., Rupke, D., Zahid, H. J., Geller, M. J., & Barton, E. J. 2010, ApJL, 721, L48
Larson, K. L., Sanders, D. B., Barnes, J. E., et al. 2016, ApJ, 825, 128
Mazzarella, J. M., Iwasawa, K., Vavilkin, T., et al. 2012, AJ, 144, 125
Medling, A. M., U, V., Rich, J. A., et al. 2015, MNRAS, 448, 2301
Meijerink, R., Spaans, M., & Israel, F. P. 2007, A&A, 461, 793
Mihos, J. C., & Hernquist, L. 1996, ApJ, 464, 641
Modica, F., Vavilkin, T., Evans, A. S., et al. 2012, AJ, 143, 16
Narayanan, D., Cox, T. J., Robertson, B., et al. 2006, ApJL, 642, L107
Ogle, P., Boulanger, F., Guillard, P., et al. 2010, ApJ, 724, 1193
Ogle, P., Davies, J. E., Appleton, P. N., et al. 2012, ApJ, 751, 13
Patton, D. R., Torrey, P., Ellison, S. L., Mendel, J. T., & Scudder, J. M. 2013, MNRAS, 433, L59
Peterson, B. W., Appleton, P. N., Helou, G., et al. 2012, ApJ, 751, 11
Petric, A. O., Ho, L. C., Flagey, N. J. M., & Scoville, N. Z. 2015, ApJS, 219, 22
Petric, A. O., Armus, L., Howell, J., et al. 2011, ApJ, 730, 28
Petty, S. M., Armus, L., Charmandaris, V., et al. 2014, AJ, 148, 111
Privon, G. C., Barnes, J. E., Evans, A. S., et al. 2013, ApJ, 771, 120
Privon, G. C., Herrero-Illana, R., Evans, A. S., et al. 2015, ApJ, 814, 39
Psychogyios, A., Charmandaris, V., Diaz-Santos, T., et al. 2016, A&A, 591, A1
Roussel, H., Helou, G., Hollenbach, D. J., et al. 2007, ApJ, 669, 959
Rupke, D. S. N., Kewley, L. J., & Barnes, J. E. 2010, ApJL, 710, L156
Sanders, D. B., Mazzarella, J. M., Kim, D.-C., Surace, J. A., & Soifer, B. T. 2003, AJ, 126, 1607
Sanders, D. B., & Mirabel, I. F. 1996, ARA&A, 34, 749 Smith, J. D. T., Armus, L., Dale, D. A., et al. 2007a,
PASP, 119, 1133
Smith, J. D. T., Draine, B. T., Dale, D. A., et al. 2007b, ApJ, 656, 770
Spoon, H. W. W., Marshall, J. A., Houck, J. R., et al. 2007, ApJL, 654, L49
Springel, V. 2000, MNRAS, 312, 859
Stierwalt, S., Armus, L., Surace, J. A., et al. 2013, ApJS, 206, 1
Stierwalt, S., Armus, L., Charmandaris, V., et al. 2014, ApJ, 790, 124
Veilleux, S., & Osterbrock, D. E. 1987, ApJS, 63, 295 Veilleux, S., Rupke, D. S. N., Kim, D.-C., et al. 2009,
ApJS, 182, 628
Yamashita, T., Komugi, S., Matsuhara, H., et al. 2017, ApJ, 844, 96
23
Table 1. H2 Rotational Transitionsa
Notationb Transitionc Rest λµmd Eu/k [K]e A [10−7s−1]f g (J)g
S(0) J = 2 - 0 28.219 510 0.00029 5 S(1) J = 3 - 1 17.035 1015 0.00476 21 S(2) J = 4 - 2 12.279 1682 0.0276 9 S(3) J = 5 - 3 9.665 2504 0.0984 33 S(4) J = 6 - 4 8.025 3474 0.264 13 S(5) J = 7 - 5 6.910 4586 0.588 45 S(6) J = 8 - 6 6.109 5829 1.14 17 S(7) J = 9 - 7 5.511 7197 2.00 57 aRoussel et al.(2007)
b Short notation of H2transition
c The quantum numbers associated with the upper and lower energy levels, the tran-sition from the upper to lower level results in the emission of the observed line listed in Column 1
d Rest wavelength for transition given in column 1
e The rotational upper energies from (Roussel et al. 2007;Huber & Hertzberg 1979;
Black & Dalgarno 1976)
f Transition probabilities from (Roussel et al. 2007;Black & Dalgarno 1976) g The statistical weight for the transition given in column 1.
![Figure 1. H2 (S0), H2 (S1), H2 (S2), [Ne ii ], [O iv ] and [Si ii ] fluxes measured from IRS spectra modules SH and LH](https://thumb-eu.123doks.com/thumbv2/123doknet/14800597.606033/6.918.87.822.375.717/figure-ne-si-fluxes-measured-irs-spectra-modules.webp)
![Figure 2. Histograms of measured fluxes (left) and luminosities (right) for the H 2 molecular gas corresponding to the following rotational transitions, S(0) S(1), and S(2) The fluxes are given in log[ W/m −2 ] and the luminosities in log of solar units](https://thumb-eu.123doks.com/thumbv2/123doknet/14800597.606033/8.918.107.825.126.945/histograms-luminosities-molecular-corresponding-following-rotational-transitions-luminosities.webp)


![Figure 11. Histograms of [Si II ] to H 2 S(1) emission line ratios for: (left) non-mergers, (center) early-stage mergers, and (right) mergers](https://thumb-eu.123doks.com/thumbv2/123doknet/14800597.606033/20.918.104.831.785.965/figure-histograms-emission-ratios-mergers-center-mergers-mergers.webp)
