*Correspondence: Pascal Bovet, Biopôle 2, University Institute of Social and Preventive Medicine, University Hospital of Canton of Vaud, Route de la Corniche 10, 1010 Lausanne, Switzerland, Phone: +41 21 314 7272, E-Mail: [email protected]; and Seychelles Hospital, Ministry of Health, Victoria, Republic of Seychelles. http://orcid.org/0000-0002-0242-4259 Florine Stauffer: Institute of Social and Preventive Medicine, University Hospital of Lausanne, Lausanne, Switzerland Bharathi Viswanathan: Unit for Prevention and Control of Cardiovascular Diseases, Ministry of Health, Victoria, Republic of Seychelles
Maygane Jean and Prosper Kinabo: Clinical Laboratory, Seychelles Hospital, Ministry of Health, Victoria, Republic of Seychelles
Florine Stauffer, Bharathi Viswanathan, Maygane Jean, Prosper Kinabo and Pascal Bovet*
Comparison between capillary glucose measured
with a Contour glucometer and plasma glucose in
a population survey
DOI 10.1515/labmed-2015-0089
Received October 13, 2015; accepted January 29, 2016; previously published online March 9, 2016
Abstract
Background: Capillary glucose (CG) measured with point-of-care glucometers can provide useful approximation of plasma glucose (PG) in selected circumstances but the validity of measurements has been adequately assessed only for a few glucometers.
Methods: We assessed the difference between CG meas-ured with a glucometer (Contour Ascensia, Bayer) and PG measured with a standard laboratory method in partici-pants to a population-based cardiovascular survey in the Seychelles (sample size 1227).
Results: CG correlated well with PG (r = 0.94; p < 0.001). The overall difference between PG and CG was –0.55 mmol/L for PG < 4.0 mmol/L (n = 19; 95% CI –0.92; –0.18); 0.14 mmol/L for PG 4.0–4.9 (n = 344; 95% CI 0.08–0.20) and increased according to PG up to 1.64 mmol/L for PG > 9.0 mmol/L (n = 68; 95% CI 1.36; 1.91). The prevalence of diabetes in the study sample was 29% lower with CG than with PG (8.6% vs. 12.1%) but this bias could be cor-rected by analytical re-calibration.
Conclusions: CG underestimated PG, although the bias was small among persons with low glycemia. This sys-tematic difference may bear little significance when the purpose is to simply monitor blood glucose but has large impact on prevalence estimates at the population level if CG values are not adequately calibrated.
Keywords: Africa; capillary glucose; diabetes; epidemiol-ogy; plasma glucose; point-of-care testing; Seychelles.
Introduction
It is estimated that 382 million people had diabetes in 2013, with a vast majority of them living in low- and mid-dle-income countries, and the prevalence is expected to further rise in parallel with the increasing prevalence of obesity worldwide [1–3], including in Seychelles [4]. Dia-betes is a main cause of cardiovascular disease, kidney failure, blindness, and other severe diseases [3, 5, 6]. Early treatment of diabetes can prevent or delay complications [2, 7–9], which emphasizes the need for early diagnosis and management of diabetes and pre-diabetes.
Fasting plasma glucose (PG) ≥ 7.0 mmol/L (126 mg/dL), when confirmed, is a sufficient criterion for the diagnosis of diabetes [10, 11]. Lower levels of fasting blood glucose also increase the risk of several diseases [12]. Two cutoff values for pre-diabetes status are generally considered: fasting PG between 5.6 and 6.9 mmol/L for the American Diabetes association (ADA) [10] and between 6.1 and 6.9 mmol/L for the World Health Organization (WHO) and the International Diabetes Federation (IDF) [2, 11].
Cutoffs for the diagnosis of diabetes and pre-diabetes are based on fasting PG, which requires blood drawing. However, blood glucose can also be measured on capillary blood using point of care glucometers; these instruments revolutionized the treatment and management of diabe-tes as they can be used in any setting, they are easy to operate, and they provide immediate results [3]. Measure-ments of capillary glucose (CG) with glucometers are used for blood glucose monitoring at home or in the hospital among persons known to have diabetes [13, 14]. However, more studies are necessary to examine the validity of CG to predict diabetes, particularly the newer models which are smaller, faster and possibly better calibrated. There is a need to assess whether these glucometers could be used for screening purposes or in epidemiological surveys [15–17], particularly in resource limited settings.
Glucose measured on whole blood is 11% lower than glucose measured on venous plasma [11]. This is why the glucose cut off to define diabetes has been advised to be lower when measured on whole blood (6.1 mmol/L), for example with point of care glucometers, than when meas-ured on plasma (7.0 mmol/L) [18]. However, most current glucometers, including the Contour Ascensia used in this study, automatically adjust glucose results from capil-lary whole blood to equivalent PG values by means of an electronic algorithm built in the glucometer. Therefore, CG readings with modern glucometers are expected to be equal to PG values. However, the automatic calibration by glucometers remains a challenge as accuracy must apply throughout the entire range of glycemia. Accuracy of this calibration cannot be implied from a particular glu-cometer to another model as calibration is a proprietary inbuilt process in the glucometer. Therefore, every differ-ent brand and model of glucometer should be assessed separately. Furthermore, it remains useful to evaluate the accuracy of calibration of a particular glucometer in the different populations in which the glucometer is used [19], as factors influencing glycemia may differ across popula-tions, e.g. the prevalence of anemia in the population. Apart from this technical difference, CG may differ from venous glucose according to nutritional or other factors [11, 19].
Some epidemiological studies have used glucome-ters to assess diabetes in low resource settings because of convenience and low cost [20–24]. When facing limited resources, the argument can be made that it is better to assess diabetes status using a glucometer than not measuring glucose at all [23]. However, not all of these studies have adjusted their findings on diabe-tes prevalence to the bias between CG and PG and/or conducted validation studies within these surveys in order to possibly recalibrate their results according to standard PG measurements. Because assessing diabe-tes using CG measured with glucometers may be useful in some situations (particularly in low resources coun-tries), there is a need for manufacturers to continuously improve the calibration of their glucometers and for investigators to assess the accuracy of glucometers they are using [17].
In this study, we compared CG measured with the Contour glucometer (Bayer) with PG measured with a standard laboratory method in the participants to a pop-ulation-based cardiovascular survey in the Seychelles who underwent both measurements at the same time. We examined the differences in the prevalence of diabetes and pre-diabetes based on measurements with CG and PG, including after analytical recalibration of CG to PG.
Materials and methods
Data came from a national population-based cardiovascular sur-vey conducted in the Seychelles in October–December 2013 and in February 2014 (Seychelles Heart Survey IV). Methods and overall results were previously described [25]. The survey was conducted on a sex and age random sample of the whole population aged 25–64 and was attended by 1240 participants (participation rate: 73%). Eligible participants were invited to attend a study center between 6:30 and 10:00 am on a given date and they were requested to be fasting when they attended. Within 10–30 min after arrival to the study center, venous blood and capillary blood was collected within an interval of 2 min. Measurement on CG was done immediately with an Ascensia Contour glucometer (Bayer Consumer Care, Basel, Switzerland). Venous blood was collected using standard 2.5 mL tubes containing sodium fluoride and potassium oxalate to prevent glucolysis (BD, Plymouth, UK) and glucose was measured at the laboratory of the main hospital of Seychelles within 2–3 h of blood collection with an automatic analyzer ( Konelab 30i, Thermo, Vanta, Finland) with reagents from the same company. The procedure used glucose oxydase (GOD) and a modified Trinder color reaction cata-lyzed by the enzyme peroxydase (POD). The imprecision (CV) for the GOD-POD glucose assay using a Konelab analyzer varies according to the mean glucose level but is CV < 3% overall according to the notice of the manufacturer. The Ascensia Contour glucometer measures glu-cose levels using gluglu-cose dehydrogenase (GDH) flavin dinucleotide (FAD) chemistry, with no interference from maltose or galactose. The CV of the Contour glucometer is < 5% according to the notice of the manufacturer. Glucose measurements were available for both PG and CG in 1227 participants from a total of 1240 participants and analyses in this study are therefore limited to these 1227 participants.
Our research met the ethical guidelines, including adherence to the legal requirements of the study country.
We examined the difference between PG and CG according to different PG categories. We analytically removed the overall bias between CG and PG by transforming CG values into “corrected” CG values (cCG) using the linear regression equation CG = 0.83 PG+0.51. We estimated the prevalence of diabetes based on PG and CG before and after analytical re-calibration of the glucometer results. We examined the sensitivity, specificity, positive predictive value and negative predictive value of CG to predict PG, without and with ana-lytical recalibration, assuming that PG was the gold standard. We computed the discordance rate (DR) between the estimated preva-lence of diabetes or pre-diabetes based on either PG or CG measure-ments. DR is an indicator of diagnosis misclassification: it represents the sums of positive and negative discordance values in percent (i.e. the probability of discordant decisions between PG and CG). As this is a validity study comparing blood glucose measured along two dif-ferent methods, prevalence estimates were calculated in the current sample and are not weighted for the distribution of the actual popu-lation or for some other standard popupopu-lation distribution. Statistical analysis was performed with Stata 11.2.
Results
Figure 1 shows the association between PG and CG meas-urements; the correlation coefficient between CG and PG was high (r = 0.94; p < 0.001). Overall, CG underestimated
PG (i.e. 5.41±1.92 mmol/L vs. 5.91±2.18 mmol/L, respec-tively), but it can be seen that the difference between PG and CG underestimates increases with increasing PG values.
Figure 2 shows the systematic difference (i.e. the bias) between PG and CG according to PG. It can be seen that there is large variability in the differences between CG and PG between individuals at any level of PG, and that the systematic difference between PG and FG is minimal at low PG values but increases monotonically along higher PG values.
Figure 1: Relation between plasma glucose and capillary glucose, and linear trend.
Figure 2: Difference between plasma glucose and capillary glucose according to plasma glucose and linear trend.
Table 1: Difference between plasma glucose (PG) and capillary glucose CG) and discordance rate according to categories of plasma glucose. Plasma glucose, mmol/L n Difference, PG minus CG 95% CI Discordance rate, DR Total sample 1227 0.50 0.46; 0.54 4.0 < 4.0 19 –0.55 –0.92; –0.18 0 4.0–4.9 344 0.14 0.08; 0.20 0 5.0–5.9 545 0.51 0.47; 0.55 0 6.0–6.9 170 0.69 0.59; 0.78 1.8 7.0–7.9 46 0.67 0.42; 0.92 76.1 8.0–8.9 35 1.17 0.80; 1.54 31.4 ≥ 9.0 68 1.64 1.36; 1.91 0
Table 1 quantifies the mean difference between PG and CG according to selected PG categories. The dif-ference is negative at PG values lower than 4 mmol/L, minimal at PG of 4-5 mmol/L, and increasingly large at higher PG values. Overall, CG was lower than PG by 0.50±0.75 mmol/L (95%CI: 0.46 to 0.54), i.e. CG was 8.5% lower than PG. Table 1 also shows that the discordance rate was 4% overall but increased around the cutoff point for diabetes diagnosis (i.e. DR 76% for PG = 7–8 mmol/L).
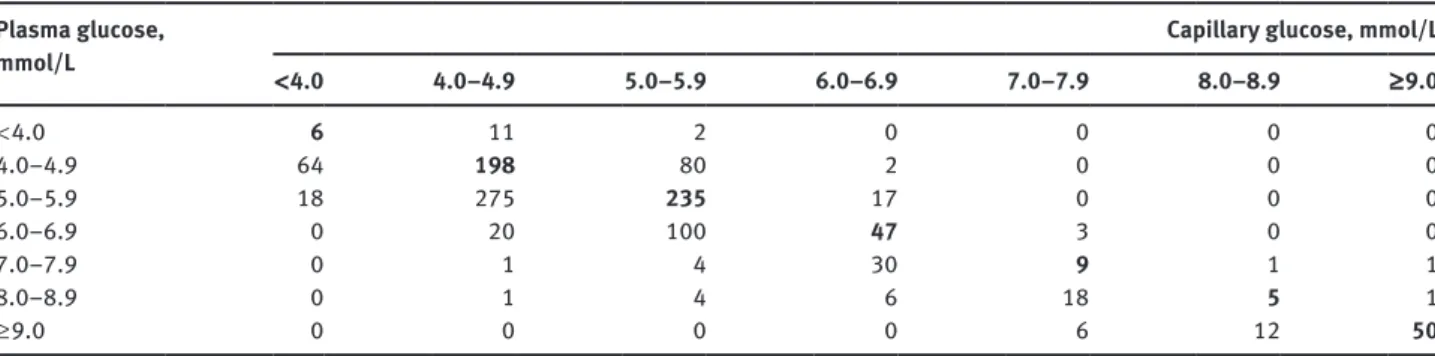
Table 2 shows the concordance between categories of PG and CG. The kappa statistic was fair (κ = 0.79 before and κ = 0.80 after analytical recalibration of CG). The Table also emphasizes the large variability between CG and PG, i.e. a substantial number of persons had high CG and low PG, and vice versa.
Table 3 shows the impact arising from the system-atic difference between the two methods. The prevalence of diabetes (i.e. glucose ≥ 7.0 mmol/L) in the sample of participants was lower by 29% based on CG, i.e. 8.6% (95% CI: 7.1–10.2) with CG and 12.1% (95% CI: 10.3–14.0) with PG. When using the cut-off of ≥ 6.1 mmol/L to define diabetes on whole blood as suggested by the WHO in 1999 [16], the prevalence of diabetes was 16.2% (95% CI: 14.2–18.3), i.e. 34% higher than with PG. When consid-ering pre-diabetes according to the ADA (i.e. FPG ≥ 5.6) the prevalence based on CG was 36% lower than based on PG. Upon analytic re-calibration of CG to PG using linear regression, the prevalence of diabetes was similar with calibrated CG (cCG) and PG. Since CG underesti-mates PG overall, the positive predictive value (PPV) of CG ≥ 7.0 mmol/L to identify PG ≥ 7.0 mmol/L was high (97.2%), but PPV decreased to 80.5% upon analytical recalibration. The negative predictive value of low CG to identify low PG was fairly high ( > 95%) for both CG and cCG, largely because the prevalence of diabetes is low in this healthy population sample.
Table 2: Concordance between categories of capillary glucose and plasma glucose. Plasma glucose,
mmol/L < 4.0 4.0–4.9 5.0–5.9 6.0–6.9 7.0–7.9 Capillary glucose, mmol/L 8.0–8.9 ≥ 9.0
< 4.0 6 11 2 0 0 0 0 4.0–4.9 64 198 80 2 0 0 0 5.0–5.9 18 275 235 17 0 0 0 6.0–6.9 0 20 100 47 3 0 0 7.0–7.9 0 1 4 30 9 1 1 8.0–8.9 0 1 4 6 18 5 1 ≥ 9.0 0 0 0 0 6 12 50
Table 3: Prevalence of elevated blood glucose and validity indices of capillary glucose to predict elevated readings, assuming that plasma glucose is the gold standard, before and after recalibration using a linear regression.
≥ 7.0 mmol/LDiabetes, Impaired fasting glucose or diabetes, ≥ 5.6 mmol/L Plasma
glucose Capillary glucose Calibrated CGa
Plasma
glucose Capillary glucose Calibrated CGa
Prevalence, % 12.1 8.6 13.0 40.4 26.0 43.4
95%CI, % 10.3; 14.0 7.0; 10.2 11.1; 14.8 37.7; 43.2 23.5; 28.5 40.6; 46.1
Discordance rate, % 4.0 4.2 21.1 23.0
Sensitivity, % 69.1 85.9 56.0 75.2
Specificity, % 99.7 97.1 94.0 78.2
Positive predictive value, % 97.2 80.5 87.0 70.1
Negative predictive value, % 95.9 98.0 76.0 82.3
aRe-calibration was obtained by transforming each measurement of CG with a linear function obtained from linear regression.
3.7% 8.4%
0.2%
10.4%
2.5% 1.7%
Without calibration With calibration
Figure 3: Prevalence of glucose ≥ 7 mmol/L in the study sample based on plasma glucose (blue circle) or capillary glucose (red circle), without and with analytical calibration of capillary glucose to plasma values.
Figure 3 shows the concordance between the preva-lence of diabetes based on PG, CG and cCG. The overall prevalence of diabetes was similar with cCG and PG, but a substantial proportion of persons identified as diabetic based on cCG were not identified as diabetic based on PG (i.e. there was a substantial number of false positive cases of diabetes identified with cCG, assuming that PG is the gold standard).
Discussion
We found that the difference between CG and PG was minimal at low blood glucose levels but increased monot-onically according to increasing glucose values. With an overall bias between PG and CG of 8.5% (0.50 mmol/L), the glucometer used in our study does not comply with the Laboratory Medicine Practice Guidelines from the National Academy of Clinical Biochemistry of the Ameri-can Association for Clinical Chemistry, which recommend that the bias of an instrument should be lower than 2.2% to be suitable for the diagnosis of diabetes [16]. This sys-tematic difference between CG and PG, which is clinically not large, may bear little significance when the purpose is to monitor blood glucose in diabetic patients. However, the difference has large impact when the purpose is to diagnose diabetes or to assess the prevalence of diabetes in the population.
Other studies on different glucometers have generally reached similar conclusions as our study. A study made in 2003 on eight different glucometers found that the bias between CG and PG varied between 0.14% and 16.9% [26].
Two recent studies have been made on glucomenters in 2012 and 2014 in which the Contour glucometer did not fulfill the new accuracy performance criteria of the new ISO15197 guideline [27, 28]. Factors related to the lack of accuracy of glucometers include a low hematocrit, inter-ferences with other substances [7], nutritional state of the patient, or inaccurate calibration of the glucometer to convert a CG value to an equivalent PG reading. Other patients’ characteristics can also play a role. For example CG may be lower than PG in a fasting patient but CG may be higher than PG in non-fasting patients [11, 19]. It is also known that there is a bigger difference between arterial blood glucose and venous blood glucose when the blood glucose is high as when the blood glucose is low. This explains why the bias increases according to increasing glucose values. Blood glucose deducted from conversion from CG to equivalent value of PG, or vice-versa, has been typically associated with a bias of at least 0.5 mmol/L [19, 29]. It could however, be argued that algorithms of calibra-tion of glucometers could be further improved to provide readings that actually are equal, or closer, to plasma values along the whole range of blood glucose in most populations.
In this study, the discordance rate to classify persons as having glucose ≥ 7.0 mmol/L (diabetes) or not, using either CG or PG, is < 5%, meaning that more than 95% of all subjects in our population-based sample are con-cordantly classified. This fairly low discordance rate is largely explained by the facts that only a small number of persons have glucose ≥ 7.0 mmol/L (around 10%) and a substantial proportion of participants have low PG, i.e. a range where there was only little bias between FG and PG. However, and as expected, the discordance rate is greater when the glucose cutoff to discriminate between high and low glucose is lowered (e.g. blood glucose ≥ 5.6 mmol/L, which defines prediabetes according to the ADA) and more persons subsequently fall into the upper glucose category. Validity indicators such as the discordance rate, the posi-tive predicposi-tive value or the negaposi-tive predicposi-tive value all depend on the prevalence of the condition being screened so that findings in our study may not be automatically generalized to other populations. However, our findings suggest that a low CG value has a high negative predictive value to exclude the presence of diabetes; a high CG value has a high positive predictive value to identify diabetes, but intermediate CG values should be rechecked on PG with a standard laboratory method.
WHO guidelines in 1999 advised to use a cutoff of 6.1 mmol/L when assessing diabetes based on whole blood glucose [18]. At this time, glucometers, which measure glucose on whole blood, were not adjusted to display
glucose readings that are equivalent to PG values. Our results show that the prevalence of diabetes was largely overestimated using this whole blood cutoff of 6.1 mmol/L with the Contour Ascensia, but largely underestimated using the PG cutoff of 7.0 mmol/L with the same glucom-eter. Current glucometers are expected to provide whole blood CG readings that are adjusted to PG equivalents. Yet, we found that neither the 7.0 mmol/L cut off nor the 6.1 mmol/L cut off accurately assessed the prevalence of diabetes in our population. However, in view of the pos-sibility that diabetes may be assessed with glucometers in some resource limited settings, guidelines on the use of glucometers to assess diabetes in selected situations should be updated.
It has been proposed that CG measured with a glu-cometer may be useful to assess the prevalence of diabe-tes in populations in particular situations, e.g. in resource limited settings [15, 16]. However, the substantial system-atic difference between CG and PG at blood glucose levels close to the cutoff values for the diagnosis of diabetes resulted in a large bias in estimating the prevalence in our study sample (8.6% with CG vs. 12.8% with PG). This underlines the need to analytically re-calibrate results yielded with glucometers used for this epidemiological purpose. A few strategies have been proposed to over-come the challenge of systematic differences between CG and equivalent PG. First some new glucometers can measure a person’s hematocrit and adjust glucose read-ings accordingly so that the bias between PG and FG may be avoided [30]. Second, the bias between PG and CG can be assessed in a sub-sample of the population in which the prevalence of diabetes is being assessed, and CG values can then be analytically recalibrated to PG readings [19]. Third if no calibration of CG to PG is per-formed, a two-step strategy can be used to identify dia-betic persons by performing CG in all participants and re-check blood glucose in those individuals who have CG in the intermediate range (e.g. 6–7 mmol/L) using PG and a standard laboratory method [31].
Irrespective of a bias between CG and PG, we found important variability between readings with CG and PG at the individual level: substantial numbers of persons had high glucose values with CG but low values with PG, and vice versa. Variability in glucose readings can arise from both CG and PG measurements. Because we used only one glucose measurement in each individual with either method, we cannot assess the magnitude of the variability in glucose readings with either method. Of note, variabil-ity of CG and PG measurements at the individual level does not bias the point estimates of mean glucose or prevalence of diabetes in the whole population, but it does widen the
95% confidence intervals around these point estimates. Variability in glucose measurements implies that meas-urements (CG or PG) should be measured on several dif-ferent occasions in a same individual when results need to be accurate at the individual level (e.g. when assessing the presence of diabetes in a particular individual).
There are several limitations to this study. First, we did not repeat measurements of CG and PG and we were therefore unable to assess the variability in glucose read-ings with either method. However, variability at the indi-vidual level does not alter point estimates of mean levels or prevalence in the population. Second, when comput-ing validity indices (e.g. the predictive value of high CG to identify high PG), we assumed that the laboratory method (PG) was the gold standard. However, the laboratory method is also subject to variability and bias. Although quality control on PG was performed every day in our clin-ical laboratory, we did not cross check our PG values in this study with measurements made in an established ref-erence laboratory. Third, tubes used to collect plasma for glucose measurement had sodium fluoride and potassium oxalate added as a glycolysis inhibitor. However, sodium fluoride and potassium oxalate fully prevent glycolysis only after 2–3 h. This may lead to some underestimation of venous PG. Fourth some participants may not have been fasting which can influence the relation between FG and CG [19]. Fifth, our goal was to compare CG and PG, and the impact of the bias between CG and PG on the preva-lence estimate of diabetes in the population, but not to assess the true prevalence of diabetes in the population. The definite diagnosis of diabetes should rely on unbiased glucose measurement, repeat blood glucose measure-ments, and may also include criteria that we did not use in this study, such as oral glucose tolerance test (OGTT) or
HbA1c [32]. Sixth, we could not adjust results to different
factors that may influence CG or PG, such as hematocrit or blood levels of proteins, maltose or immunoglobulins. On the other hand, strong points of our study are the large sample size, the population based nature of the sample, the standard methods used, and the fact that we assessed the difference between CG and PG in different categories of blood glucose.
Conclusions
Our findings generally support current recommendations on the use of point of care glucometers. The fairly good cor-relation between CG and PG supports the use of simple,
quick and inexpensive measurement of CG with a glucome-ter when the purpose is to monitor blood glucose in patients known to have diabetes or in other specific situations where approximate values are sufficiently informative. However, the use of PG and standard laboratory methods remains essential when the purpose is to identify diabetes or pre-diabetes. While low CG values strongly suggest the absence of diabetes and high CG values strongly suggest the presence of diabetes, intermediate CG values need to be re-checked with PG and standard laboratory methods. From an epidemiological perspective, any systematic dif-ference between CG and PG will result in a biased point estimate of the prevalence of diabetes in the population. Therefore, glucometers used in epidemiological surveys should be calibrated accordingly (e.g. by measuring CG and PG in a sub-sample of the survey participants and adjusting CG to be equal to PG values) or using alternate strategies (e.g. recheck glucose with PG in persons who have intermediate CG values). More generally, there is a need for more comprehensive information from manufac-turers on the validity of glucometers. Further sufficiently powered studies need to be conducted in different popu-lations to assess the validity of glucometers available in the market. In view of better performance of current than past glucometers, guidelines on the significance of glucose readings with glucometers should be updated.
Acknowledgments: Grateful thanks are expressed to the survey officers, to all the participants to the survey, and to the Ministry of Health of the Republic of Seychelles for continued support to epidemiological research.
Author contributions: F.S. analyzed and led the writing of the paper; P.B. designed the study and assisted with data analysis and writing of the paper; B.V., M.J. and P.B. assisted in the conduct of the study and critically reviewed the man-uscript. All authors approved submission of the paper. Research funding: Partial funding to the survey came from the Ministry of Health, Seychelles; the University Institute of Social and Preventive Medicine, Lausanne, Switzerland; the World Health Organization (AFRO); and from unconditional grants from the Seychelles Trading Company (STC Ltd) and Seychelles Petroleum (SEYPEC, Ltd).
Employment or leadership: None declared. Honorarium: None declared.
Competing interests: The funding organizations played no role in the study design; in the collection, analysis, and interpretation of data; in the writing of the report; or in the decision to submit the report for publication.
References
1. Guariguata L, Whiting DR, Hambleton I, Beagley J, Linnenkamp U, Shaw JE. Global estimates of diabetes prevalence for 2013 and projections for 2035. Diabetes Res Clin Pract 2014;103:137–49. 2. Nolan CJ, Damm P, Prentki M. Type 2 diabetes across
genera-tions: from pathophysiology to prevention and management. Lancet 2011;378:169–81.
3. Nathan DM. Diabetes: advances in diagnosis and treatment. J Am Med Assoc 2015;314:1052.
4. Bovet P, Romain S, Shamlaye C, Mendis S, Darioli R, Riesen W, et al. Divergent fifteen-year trends in traditional and cardiomet-abolic risk factors of cardiovascular diseases in the Seychelles. Cardiovasc Diabetol 2009;8:34.
5. Isomaa B, Almgren P, Tuomi T, Forsen B, Lahti K, Nissen M, et al. Cardiovascular morbidity and mortality associated with the metabolic syndrome. Diabetes Care 2001;24:683–9.
6. Stratmann B, Tschoepe D. Atherogenesis and atherothrombosis – focus on diabetes mellitus. Best Pract Res Clin Endocrinol Metab 2009;23:291–303.
7. American Diabetes Association. Standards of Medical Care in Diabetes–2014. Diabetes Care. 2014;37(Suppl 1):S14–80. 8. Griffin SJ, Borch-Johnsen K, Davies MJ, Khunti K, Rutten GE,
Sandbæk A, et al. Effect of early intensive multifactorial therapy on 5-year cardiovascular outcomes in individuals with type 2 diabetes detected by screening (ADDITION-Europe): a cluster-randomised trial. Lancet 2011;378:156–67.
9. Intensive blood glucose control and vascular outcomes in patients with type 2 diabetes. N Engl J Med 2008;358:2560–72. 10. American Diabetes Association. Diagnosis and classification of
diabetes mellitus. Diabetes Care 2014;37(Suppl 1):S81–90. 11. WHO. Definition and diagnosis of diabetes mellitus and
intermediate hyperglycemia Report of a WHO/IDF Consultation [Internet]. WHO, Geneva; 2006. Available from: http://www. who.int/diabetes/publications/Definition002520and002520di-agnosis002520of002520diabetes_new.pdf.
12. Pankow JS, Kwan DK, Duncan BB, Schmidt MI, Couper DJ, Golden S, et al. Cardiometabolic risk in impaired fasting glucose and impaired glucose tolerance the atherosclerosis risk in com-munities study. Diabetes Care 2007;30:325–31.
13. Harrison B, Markes R, Bradley P, Ismail IA. A comparison of sta-tistical techniques to evaluate the performance of the glucom-eter Elite® blood glucose meter. Clin Biochem 1996;29:521–7. 14. Innanen VT, Kelly CM, Kenshole AB. Hypoglycemia is effectively
evaluated at the bedside by the Ames glucometer Elite®. Clin Biochem 1996;29:279–81.
15. Plebani M. Does POCT reduce the risk of error in laboratory testing? Clin Chim Acta 2009;404:59–64.
16. Sacks DB, Arnold M, Bakris GL, Bruns DE, Horvath AR, Kirkman MS, et al. Guidelines and recommendations for labora-tory analysis in the diagnosis and management of diabetes mellitus. Diabetes Care 2011;34:e61–99.
17. Klonoff DC, Prahalad P. Performance of cleared blood glucose monitors. J Diabetes Sci Technol 2015;9:895–910.
18. Alberti KG, Zimmet PZ, WHO Consultation. Definition, diag-nosis and classification of diabetes mellitus and its
com-plications. Part 1: diagnosis and classification of diabetes mellitus. Provisional report of a WHO Consultation. Diabet Med 1998;15:539–53.
19. Colagiuri S, Sandbaek A, Carstensen B, Christensen J, Glumer C, Lauritzen T, et al. Comparability of venous and capillary glucose measurements in blood. Diabet Med J Br Diabet Assoc 2003;20:953–6.
20. WHO|STEPS Country Reports [Internet]. WHO. [cited 2014 Sep 26]. Available from: http://www.who.int/chp/steps/reports/ en/.
21. WHO. Karibati NCD risk factors STEPS Report [Internet]. 2009 [cited 2014 Sep 26]. Available from: http://www.who.int/chp/ steps/kiribati_STEPS_report_2004-6.pdf.
22. Innanen VT, Campos FB. Point-of-care glucose testing: cost sav-ings and ease of use with the Ames Glucometer Elite. Clin Chem 1995;41:1537–8.
23. Ritchie GE, Kengne AP, Joshi R, Chow C, Neal B, Patel A, et al. Comparison of near-patient capillary glucose measurement and a risk assessment questionnaire in screening for type 2 diabetes in a high-risk population in Rural India. Diabetes Care 2011;34:44–9.
24. Grech M, Chaney D. Screening for type 2 diabetes and pre-diabetes in general practice: A descriptive study of Maltese practices. Prim Care Diabetes 2014;8:224–30.
25. Bovet P, Viswanathan B, Louange M, Gedeon J. National Survey of Noncommunicable Diseases in Seychelles 2013-2014 (Sey-chelles Heart Study IV): main findings. [Internet]. Ministry of Health, Victoria, Seychelles; 2015. Available from: http://serval. unil.ch/003Fid003Dserval:BIB_1233D41F200A.
26. Solnica B, Naskalski JW, Sieradzki J. Analytical performance of glucometers used for routine glucose self-monitoring of dia-betic patients. Clin Chim Acta 2003;331:29–35.
27. Pfützner A, Hengesbach C, Demircik F, Schipper C, Forst T, Musholt PB. Performance of blood glucose meters in compli-ance with current and future clinical ISO15197 accuracy criteria. Curr Med Res Opin 2014;30:185–90.
28. Tack C, Pohlmeier H, Behnke T, Schmid V, Grenningloh M, Forst T, et al. Accuracy evaluation of five blood glucose monitoring systems obtained from the pharmacy: a European multicenter study with 453 subjects. Diabetes Technol Ther 2012;14:330–7.
29. Carstensen B, Lindström J, Sundvall J, Borch-Johnsen K, Tuomilehto J, The DPS Study Group. Measurement of blood glucose: comparison between different types of specimens. Ann Clin Biochem 2008;45:140–8.
30. Rao LV, Jakubiak F, Sidwell JS, Winkelman JW, Snyder ML. Accuracy evaluation of a new glucometer with automated hematocrit measurement and correction. Clin Chim Acta 2005;356:178–83.
31. Dillon AE, Menard MK, Rust P, Newman RB, VanDorsten JP. Glu-cometer analysis of one-hour glucose challenge samples. Am J Obstet Gynecol 1997;177:1120–3.
32. Is fasting glucose sufficient to define diabetes? Epidemiologi-cal data from 20 European studies. The DECODE-study group. European Diabetes Epidemiology Group. Diabetes Epidemiol-ogy: Collaborative analysis of Diagnostic Criteria in Europe. Diabetologia 1999;42:647–54.