DOI 10.1007/s00122-013-2240-4 OrIGInAl PAPer
High‑resolution analysis of a QTL for resistance to Stagonospora
nodorum glume blotch in wheat reveals presence of two distinct
resistance loci in the target interval
Margarita Shatalina · Monika Messmer ·
Catherine Feuillet · Fabio Mascher · Etienne Paux · Frédéric Choulet · Thomas Wicker · Beat Keller
received: 11 July 2013 / Accepted: 19 november 2013 / Published online: 4 December 2013 © Springer-Verlag Berlin Heidelberg 2013
disease resistance as well as for plant height; additionally, we observed a high environmental influence on the trait. Our analysis detected a strong negative correlation of SnG resistance and plant height. Further analysis of the tar-get region identified two linked loci associated with SnG resistance. One of them was also associated with plant height, revealing an effect of QSng.sfr-3BS on plant height that was hidden in the rIl population. This result demon-strates an unexpectedly high genetic complexity of resist-ance controlled by QSng.sfr-3BS and shows the importresist-ance of the study of QTl in mendelized form in nIls.
Introduction
Bread wheat (Triticum aestivum l.) is globally one of the most important crops in terms of cultivated area and food source. In 2010, FAO reported a production of approxi-mately 654 million tons of wheat worldwide (FAO stat
2010). Phaeosphaeria nodorum (e. Müller) Hedjaroude (anamorph Stagonospora nodorum (Berk.) Castellani and Germano) is a necrotrophic fungus which infects both wheat glumes, causing Stagonospora nodorum glume blotch (SnG), and leaves, causing Stagonospora nodorum leaf blotch (Snl). SnG and Snl lead to substantial yield losses in many wheat-growing areas, including europe, north America and Australia (Duczek et al. 1999; Halama
2002; Oliver et al. 2012). It was shown that the infection progress highly depends on the environmental conditions. For example, the analysis of the large dataset from rotham-sted Broadbalk experiment archive, which included the records from 1844 to 2003, suggested that fluctuations in S.
nodorum epidemics depend on the amount of rainfall, tem-perature and SO2 emissions (Shaw et al. 2008). The
impor-tance of wetness (relative humidity and precipitations) and
Abstract Stagonospora nodorum glume blotch (SnG),
caused by the necrotrophic fungus Stagonospora
nodo-rum, is one of the economically important diseases of bread wheat (Triticum aestivum l.). resistance to SnG is known to be quantitative and previous studies of a recombinant inbred line (rIl) population identified a major quantitative trait locus (QTl) for resistance to SnG on the short arm of chromosome 3B. To localize this QTl (QSng.sfr-3BS) with high resolution, we constructed a genetic map for the QTl target region using information from sequenced flow-sorted chromosomes 3B of the two parental cultivars ‘Arina’ and ‘Forno’, the physical map of chromosome 3B of cultivar ‘Chinese Spring’ and BAC-clone sequences. The mapping population of near-isogenic lines (nIl) was evaluated for SnG resistance in field infection tests. nIls segregated for
Communicated by S. Dreisigacker.
Electronic supplementary material The online version of this article (doi:10.1007/s00122-013-2240-4) contains supplementary material, which is available to authorized users.
M. Shatalina · T. Wicker · B. Keller (*) Institute of Plant Biology, University of Zurich, Zollikerstrasse 107, 8008 Zurich, Switzerland e-mail: [email protected]
M. Messmer
research Institute of Organic Agriculture, 5070 Frick, Switzerland
C. Feuillet · e. Paux · F. Choulet
InrA, Genetics, Diversity and ecophysiology of Cereals, 63100 Clermont Ferrand, France
F. Mascher
research Station Agroscope Changins-Wädenswil ACW, 1260 nyon, Switzerland
temperature for the SnG progress were demonstrated in field and growth chamber experiments (Wolf and Francl
2000; Shah and Bergstrom 2002).
resistance to SnG and Snl in bread wheat has been shown to be genetically distinct (laubscher et al. 1966; Broennimann 1975; nelson and Gates 1982; Fried and Meister 1987; Bostwick et al. 1993; Van Ginkel and raja-ram 1999; Wicki et al. 1999). To date, only quantitative resistance to SnG has been reported. It has been identi-fied in several wheat populations independently (Schnur-busch et al. 2003; Aguilar et al. 2005). Schnurbusch et al. (2003) performed a QTl mapping study on a population of 240 recombinant inbred lines (rIl) developed from a cross of cultivars ‘Arina’ and ‘Forno’. This study identified two important QTls providing resistance to SnG: a major QTl, QSng.sfr-3BS, was detected on the short arm of chro-mosome 3B and explained 31.2 % of the phenotypic vari-ance for the disease resistvari-ance within the population. The second QTl QSng.sfr-4BL, explaining 19.1 % of pheno-typic variance, was found on the long arm of chromosome 4B. Both detected QTls were not co-localized with any QTls for plant height. Additionally, an association map-ping study on 44 wheat cultivars of different origin showed a significant association between the genetic marker sun2 from the QSng.sfr-3BS region and the resistance to SnG (Tommasini et al. 2007).
It has been shown that plant height is often associated with resistance to splashed dispersed fungal pathogens (eriksen et al. 2003; Draeger et al. 2007; Srinivasachary et al. 2009). Shorter plants show increased susceptibility and taller plants tend to be more resistant. There are several explanations of this negative correlation. First, in the case of a natural infection, since it progresses from the bottom to the top of the plant, taller plants get an advantage of hav-ing larger distance between the leaves (Mesterhazy 1995). Second, it was suggested that microclimate conditions for infection development on tall plants are often less favorable in comparison to the short plants (Scott et al. 1985). Third, the genes influencing plant height and disease resistance might be genetically linked (Gervais et al. 2003; Schnur-busch et al. 2003). Besides plant height, SnG resistance was shown to be associated with morphological traits such as flowering time (Broennimann et al. 1973; Scott et al.
1982; Van Ginkel and rajaram 1999; Wicki et al. 1999) or the wax layer of glumes (Wicki et al. 1999; Aguilar et al.
2005).
Genetic mapping in bread wheat is challenging as wheat has a large (17 Gb), hexaploid and highly repetitive (80– 90 %) genome (Bennett and Smith 1976; Hollister and Gaut 2009; Wanjugi et al. 2009). Furthermore, low level of polymorphism between elite wheat cultivars (Bryan et al.
1999) hinders the development of genetic markers. recent advances in wheat genomics, such as reducing complexity
by sorting individual chromosome arms using flow cytome-try, building chromosome-specific BAC libraries and physi-cal maps, partial genome sequencing, and adopting diploid relatives as models for characterization of the genome, contributed to the easier and faster identification of poly-morphisms. In addition, they revealed that, at a high-res-olution level, synteny breaks, inversions and interspersed non-syntenic genes are frequent (Choulet et al. 2010), thus highlighting the limitations of using model genomes for map-based cloning in wheat. The isolation of target genes from wheat chromosome 3B benefits from the availabil-ity of a physical map (Paux et al. 2008; rustenholz et al.
2011) that was developed using fingerprints from a bacte-rial artificial chromosomes (BAC) library of the wheat lan-drace ‘Chinese Spring’. More than 4,000 markers includ-ing simple sequence repeats (SSr) and insertion site based polymorphisms (ISBP) markers derived from BAC-end sequences have been anchored to the 3B physical map and can now be used in various mapping projects. In addition, the anchoring of numerous genes (rustenholz et al. 2011) on the physical map enables to use the synteny between the regions in wheat chromosome 3B and corresponding regions on rice (Oryza sativa l.) chromosome 1 (The Inter-national rice Genome Sequencing Project 2005).
Here, we report on the evaluation of a mapping popula-tion of near-isogenic lines for SnG resistance in the field which revealed a segregation for both disease resistance and plant height. Our analysis detected a negative correla-tion between SnG resistance and plant height. Two genetic regions associated with SnG resistance were found in the previously identified target region. One of them was associ-ated with both, plant height and SnG resistance, suggesting that the same QTl controls both traits.
Materials and methods
Plant material
The mapping population was developed from a cross between the cultivars ‘Arina’ and ‘Forno’, two Swiss win-ter bread wheat cultivars with contrasting SnG phenotypes: ‘Arina’ shows high levels of resistance to S. nodorum glume blotch (SnG) and is a tall variety (120 cm) whereas ‘Forno’ is highly susceptible to SnG and is shorter (105 cm).
F1 progeny of this cross was selfed and back-crossed to the susceptible parent ‘Forno’ twice. The resulting BC2 plants were tested using markers barc133 and gwm389, flanking the target interval of QSng.sfr-3BS (Schnurbusch et al. 2003; Tommasini et al. 2007), and markers barc75 and
sun2 located within the interval. Additionally, BC2 plants were also selected for the presence of the ‘Forno’ allele of the second QTl region on chromosome 4B with the marker
gwm251. The selected BC2 line was back-crossed again to ‘Forno’ and the resulting BC3F2 plants were screened for recombinants in the target interval between the flanking markers. The selected BC3F2 plants were repeatedly selfed and multiplied in the greenhouse to obtain near-isogenic lines (nIls). BC3F5 and BC3F6 plants of these nIls were used in the field tests.
Construction of the genetic map
We mapped in the nIl population microsatellite markers
gwm1034, barc75 and sun2 which were previously mapped in a population of recombinant inbred lines from a cross of ‘Arina’ × ‘Forno’ (Tommasini et al. 2007). Genetic mark-ers (SSr, ISBP) from the 3B physical map were amplified according to the conditions published by Paux et al. (2008). Additionally, new SSr markers were developed based on the sequence information from ctg344 (Choulet et al. 2010) which is located in the QTl interval. PCr products from SSr markers were analyzed on an ABI 3730 sequencer (Applied Biosystems, USA). Microsatellite data was ana-lyzed with the GeneMapper 4.0 software for polymor-phisms (Applied Biosystems, USA). ISBP markers were detected using both gel-electrophoresis and high-resolution melting curve analysis (HrM) on a CFX96™ real Time PCr System (Bio-rad laboratories, Hercules, USA). Six BAC clones (TaaCsp3BFhA_0035M17, TaaCsp3BFhA_ 0112H11, TaaCsp3BFhA_0078F20, TaaCsp3BFhA_0027A18, TaaCsp3BFhA_0163M03, TaaCsp3BFhA_0091M22) were ordered from InrA CnrGV (Toulouse, France) and were sequenced with 454 Titanium technology by GATC (Kon-stanz, Germany). newly developed BAC sequence-based InDel and CAPS markers were amplified and analyzed by gel electrophoresis (Table S1). Flow-sorted chromosomes 3B of Arina and Forno were prepared and sequenced as described in Shatalina et al. (2013). new SnP and InDel markers derived from the sequence analysis were amplified using the following cycling conditions: 10 s denaturation at 95º, annealing during 30 s at 61º and 30 s extension at 72º, for 35 cycles. The samples were initially denaturated for 3 min and the cycling was followed by an extension step of 7 min. We used gel electrophoresis to detect the amplified fragments for genotyping. SnP marker swm01810bd was detected using HrM on a CFX96™ real Time PCr Sys-tem (Bio-rad laboratories, Hercules, USA).
Disease phenotyping
Field trials with the nIl population were conducted in 2011 and 2012 at three different locations in Switzer-land: Agroscope reckenholz-Tänikon research Sta-tion, near Zurich (environment reckenholz); Agroscope
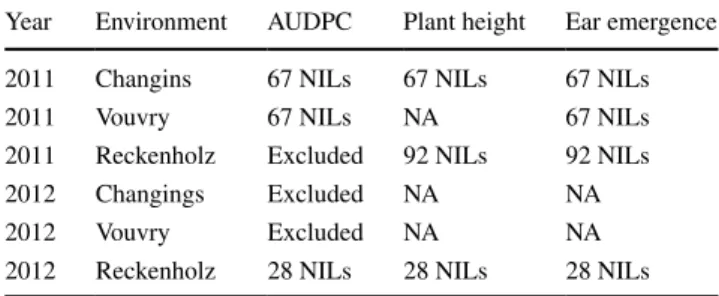
Changins-Wädenswil research Station, close to nyon (environment Changins); Vouvry in canton Valais, near lake Geneva (environment Vouvry). In Zurich, the trial was located at 443 m above sea level on loamy soils with an average precipitation of 1,000 mm and an aver-age temperature of 7.9 °C. The Vouvry site is situated at about 381 m above sea level on loamy sandy soils with an average precipitation of 881 mm and an average tem-perature of 8.7 °C. The Changins site is located at 430 m above sea level on well-drained brown soil (calcaric cambisol) with an average precipitation of 654 mm and a mean temperature of 9.5 °C. each nIl was tested in randomized 5-row plots in two replications in every envi-ronment. In 2011, 92 homozygous nIls were tested in reckenholz and, because of the insufficient number of seeds from some nIls, only 67 lines were evaluated for resistance to SnG in Changins and Vouvry environments (Table 1). In 2012, due to the limited resources, a sub-set of 28 nIls was tested in all three locations. Artifi-cial infection was done using a motor sprayer. The infec-tion cocktail contained a mixture of S. nodorum isolates from the collection of Agroscope Changins-Wädenswil. Plants were infected twice: a first infection was made at the stage before the emergence of spikes with 5 mil-lion spores/ml in 300 l water/ha; and a second infection was made at the flowering stage with 1 million spores/ ml in 300 l water/ha. Disease severity was scored accord-ing to the Broennimann scale (Broennimann 1968). This method allows scoring the percentage of infected glume area and has a scale of 0, 5, 10, 25, 50, 75 and 100 %. For each environment disease development and sever-ity was scored at least four times during its progress. Final scores were transformed to Area Under the Disease Progress Curve (AUDPC) as described in Jeger and Vil-janen-rollinson (2001). Plant height (cm) was measured in environments reckenholz and Changins in 2011 and reckenholz-2012 for both replications of nIls. Time to ear emergence was counted as number of days after the January, 1 of corresponding year.
Table 1 Field assessments of SnG resistance and plant height in the nIl mapping population
nA, not assessed
Year environment AUDPC Plant height ear emergence
2011 Changins 67 nIls 67 nIls 67 nIls
2011 Vouvry 67 nIls nA 67 nIls
2011 reckenholz excluded 92 nIls 92 nIls
2012 Changings excluded nA nA
2012 Vouvry excluded nA nA
Statistical analysis of the phenotypic assessments
Broad-sense heritability of the traits was estimated accord-ing to Hallauer and Miranda Fo (1981):
where σg2 genotypic variance, σ e
2 environmental variance, σ2ge variance of genotype/environment interaction, e number
of environments, r number of replicas.
The variances were estimated from the mixed linear model:
where Y is a vector of phenotypic observations, β is a vector of fixed genotype effects, u is a vector of random environmental effects, v a vector of random effects from interaction of genotype and environment and ε vector of residual errors. X, Z and T are coefficients of corresponding fixed and random effects. Mixed linear model was analyzed using JMP 9.0 software (SAS institute, Cary, USA).
Single marker analysis (SMA) was conducted in the r environment for statistical computing (r development core team 2013) using functions ‘lme’ and ‘lmer’ following the mixed linear model:
Y is a vector of phenotypic data (SnG resistance or plant height), β is a vector of fixed marker effects, u is a vector of random environmental effects, v a vector of random effects from interaction of marker and environment and ε vector of residual errors. X, Z and T are coefficients of correspond-ing fixed and random effects. Followcorrespond-ing the guidelines for model optimization (Crawley 2007), we eliminated the non-significant marker × environment interaction from the model for both AUDPC and plant height. The calculation was done using the reduced model:
Plant height was included as a fixed cofactor in the gen-eral linear model (‘glm’ function in the r environment) to test its effect on AUDPC:
Y is a vector of phenotypic data (SnG resistance), β is a vector of fixed marker effects, u is a vector of fixed effects from plant height and ε vector of residual errors. X and Z are coefficients of corresponding fixed and random effects.
Calculations of Spearman rank correlation coefficient (r) for the traits between different environments and repli-cas were done using JMP 9.0 (SAS institute, Cary, USA). Percentage of explained variance for environment and plant height was estimated using function ‘ICC1’ of package
h2= σg2/ σe2/re + σge2/e + σg2
Y = Xβ + Zu + Tv + ε
Y = Xβ + Zu + Tv + ε.
Y = Xβ + Zu + ε.
Y = Xβ + Zu + ε.
‘multilevel’ in the r environment for statistical analysis. t tests were conducted in r.
Results
High-resolution mapping of the QSng.sfr-3BS target region supported by the 3B physical map and whole chromosome sequencing
Schnurbusch et al. (2003) identified QSng.sfr-3BS as the major QTl for resistance to SnG in the wheat cultivar ‘Arina’. This QTl is located in the telomeric part of chro-mosome 3B in the interval flanked by the SSr markers
gwm389 and barc133. To further characterize this target interval and the QTl, we developed a high-resolution map-ping population consisting of nIls derived from a cross between the susceptible cultivar ‘Forno’ as recurrent par-ent and the resistant cultivar ‘Arina’ as donor. Among 1,320 nIls (BC3F2), we selected 145 lines showing recombina-tion between the flanking markers of the target interval. ninety-two of them were homozygous for the flanking markers. The size of the target region for the QSng.sfr-3B in our nIl population was 11 cM.
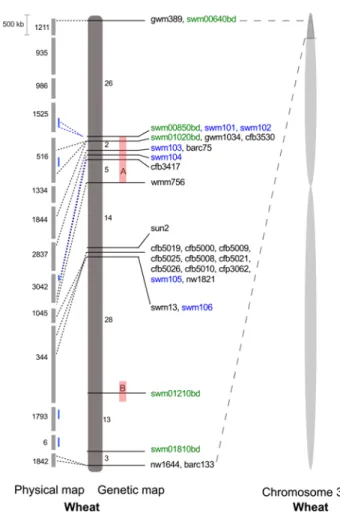
Several approaches were used to construct a high-den-sity genetic map in the target interval. In a first step, we mapped markers gwm1034, barc75 and sun2 from the pre-vious map of the ‘Arina’ × ‘Forno’ rIl population (Pail-lard et al. 2003; Tommasini et al. 2007). We also used the availability of the chromosome 3B physical map for culti-var ‘Chinese Spring’ (Paux et al. 2008) which allowed us to estimate the physical size of the region of interest as well as to map additional markers developed for anchoring the physical map. According to the physical map, the 11 cM target interval spanned a region of approximately 10 Mbp on chromosome 3B (Fig. 1). We mapped a set of SSr and ISBP markers, originally derived by Paux et al. (2008) for the anchoring of the physical map of chromosome 3B. Unfortunately, a vast majority of the tested ISBP mark-ers from the physical map were not polymorphic in the ‘Arina’ × ‘Forno’ nIl population. From a total of 33 tested markers only cfp3062 was polymorphic and was success-fully added to the map. In addition, two new SSr markers (swm105, swm106) were designed based on the sequence information from the sequenced physical contig 344 of chromosome 3B (Choulet et al. 2010). These markers were polymorphic and genetically mapped to our target interval.
We sequenced five BAC clones from the physical contigs of the target region on chromosome 3B (TaaCsp3BFhA_0112H11 from ctg3042, TaaCsp3BFhA_0078F20 from ctg1525, TaaCsp3BFhA_0027A18 from ctg516, TaaCsp3BFhA_ 0163M03 from ctg6 and TaaCsp3BFhA_0091M22 from ctg1793). These BAC clones were selected based on their
position on the physical map to cover the large gaps on the genetic map (blue lines, Fig. 1). The BAC sequences were used in two approaches for developing new markers. First, we designed primers to amplify the regions containing microsat-ellites to develop SSr markers. Second, non-repetitive regions up- and downstream of the coding sequences were amplified from both parents to develop insertion–deletion (InDel) and cleaved amplified polymorphic sequences (CAPS) markers.
Three new InDel markers (swm101, swm102, swm103) and one CAPS marker (swm104) were obtained by this approach.
To further increase marker density, we sequenced flow-sorted chromosomes 3B of both parental cultivars and this sequence information was used to design single nucleotide polymorphism (SnP) and InDel markers as described in Shatalina et al. (2013). We selected only contigs contain-ing genes which corresponded to the Brachypodium
dis-tachyon homologs from the region Bd2g00010-Bd2g02000 of chromosome 2, showing synteny with the target region of wheat chromosome 3B. InDel and SnP markers were based on small 2–3 bp polymorphisms in intergenic and coding regions of sequences between the two cultivars as well as on the presence and absence of gene fragments. As a result, five new markers (swm00640 bp, swm00850bd,
swm01020bd, swm01210bd and swm01820bd) were identi-fied and integrated in the genetic map. After integration of all newly developed markers, a total number of 31 genetic markers were mapped to the QTl target interval. The two largest regions of the map not covered by markers corre-sponded to 26 and 28 recombinants in the nIl population. nIl population segregated for plant height and SnG resistance
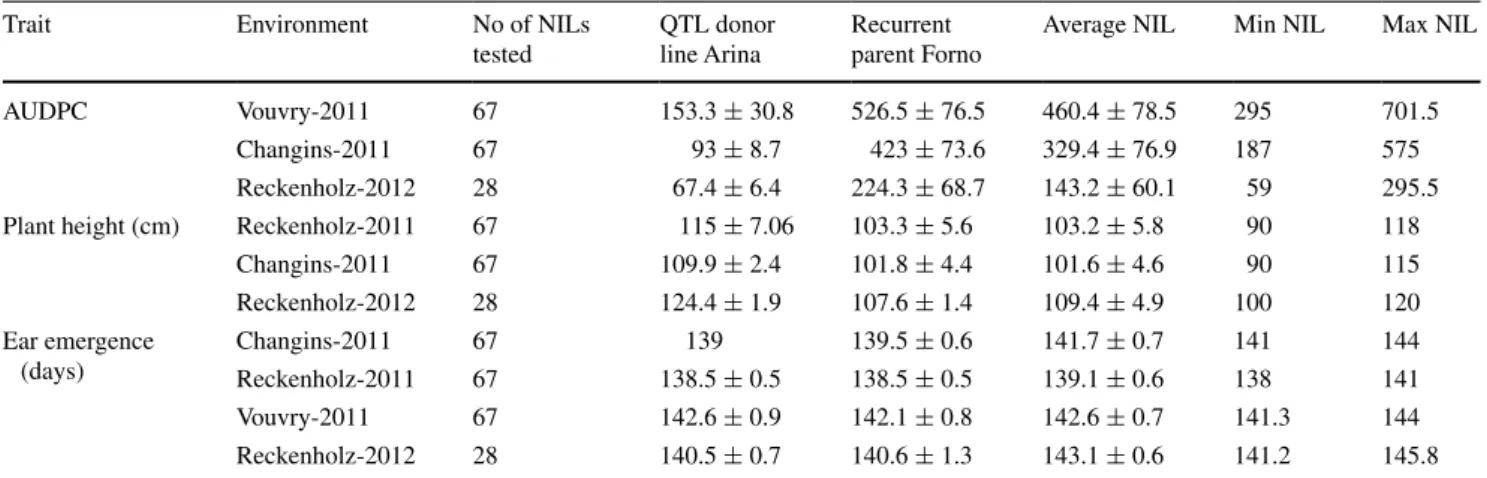
The nIl population was tested for resistance to Stagonos-pora nodorum glume blotch (SnG) under field conditions during the years 2011 and 2012 at three locations in Swit-zerland: reckenholz, Changins and Vouvry (Table 1). We estimated the infection quality based on good differentia-tion of the disease scores of the parental cultivars. In 2011, the infection developed well on the field sites in Vouvry and Changins (average AUDPC scores of ‘Forno’ were 526.5- and 423 compared to ‘Arina’ 153.3 and 93, respectively), whereas in 2012 the reckenholz environment supported a good infection (Table 2). Three other datasets (reckenholz 2011, Vouvry 2012 and Changins 2012) were excluded from the analysis due to the insufficient development of the infection. Therefore, we included in the analysis only the phenotypic data of 67 nIls from the environments Chang-ins and Vouvry for the infection tests in 2011 and data of 28 nIls from reckenholz in 2012 (Table 1; Fig. 2).
To test whether the SnG resistance phenotypes were reproducible under different field conditions, we calcu-lated the Spearman correlation coefficient (r) between the replications of the same genotypes within the individual field site as well as correlation between the different fields (Table S2). The correlation of the AUDPC values between the nIl replications within individual environments var-ied from 0.47 (Changins-2011) to 0.81 (reckenholz-2012) and between the environments from 0.56 (correlation between Changins-2011 and Vouvry-2011) to 0.84—cor-relation between reckenholz-2012 and Changins-2011.
Fig. 1 Comparative analysis of the target region for Qsng.sfr-3BS on the genetic map of the nIl population and the physical map of wheat chromosome 3B. The genetic map of the fine-mapping nIl popula-tion (92 lines) of ‘Arina’ × ‘Forno’ (in dark gray) is shown: num-bers represent the number of identified recombinants between given markers, in blue-markers developed based on the sequence analysis of BAC-clones and a partial sequence of ctg344, in green-markers developed from SnPs and InDels identified between sequences up- and downstream of coding regions in sequenced flow-sorted chromo-somes 3B of Arina and Forno; numbers in the “green” marker names correspond to the numbers of B. distachyon gene homologs. Physical map of wheat cv. ‘Chinese Spring’: light gray bars represent physical contigs with their numbers on the left side, short blue bars represent sequenced BAC-clones from corresponding physical contigs. The red bars A represent the interval significantly associated with both SnG resistance and plant height, B the interval associated with SnG resist-ance. Wheat chromosome 3B is shown in light gray with the target interval indicated in darker gray shade
Moderate to high correlation of the SnG resistance scores indicated their reproducibility across the environments. Due to the continuous distribution of AUDPC values, the nIls could not be grouped into two contrasting disease response classes (resistant or susceptible). This observation suggested that the disease response in the nIl population has to be analyzed as a quantitative trait and not as a single Mendelian gene. We also analyzed time to ear emergence
and its correlation with plant susceptibility (Tables 1,
2). The calculated Spearman rank correlation coefficient showed weak (in one environment) or no significant corre-lation (several environments) between the traits (Table S2).
In addition to a segregating disease response, we observed a segregation for plant height in our high-resolution mapping population. While several lines were taller than the recur-rent parecur-rent of the nIls (cultivar ‘Forno’), and more similar
Fig. 2 Graphical genotypes of the 67 and 28 nIls tested in the field. The genetic map shown on the right is based on a total of 92 nIls. In blue-‘Arina’ allele, in red-‘Forno’ allele. The dark colored blue and red bars with the green asterisks indicate the 28 nIls tested in field trials in 2012. Red bars on the genetic map are indicating the intervals associated with SnG resistance (b) and SnG resistance and plant height (a)
Table 2 Plant height and AUDPC values of parental lines ‘Arina’ and ‘Forno’ and fine-mapping nIl population
The last three columns show average, minimum and maximum values of the corresponding trait in the nIl population
Trait environment no of nIls
tested
QTl donor line Arina
recurrent parent Forno
Average nIl Min nIl Max nIl
AUDPC Vouvry-2011 67 153.3 ± 30.8 526.5 ± 76.5 460.4 ± 78.5 295 701.5
Changins-2011 67 93 ± 8.7 423 ± 73.6 329.4 ± 76.9 187 575
reckenholz-2012 28 67.4 ± 6.4 224.3 ± 68.7 143.2 ± 60.1 59 295.5
Plant height (cm) reckenholz-2011 67 115 ± 7.06 103.3 ± 5.6 103.2 ± 5.8 90 118
Changins-2011 67 109.9 ± 2.4 101.8 ± 4.4 101.6 ± 4.6 90 115 reckenholz-2012 28 124.4 ± 1.9 107.6 ± 1.4 109.4 ± 4.9 100 120 ear emergence (days) Changins-2011 67 139 139.5 ± 0.6 141.7 ± 0.7 141 144 reckenholz-2011 67 138.5 ± 0.5 138.5 ± 0.5 139.1 ± 0.6 138 141 Vouvry-2011 67 142.6 ± 0.9 142.1 ± 0.8 142.6 ± 0.7 141.3 144 reckenholz-2012 28 140.5 ± 0.7 140.6 ± 1.3 143.1 ± 0.6 141.2 145.8
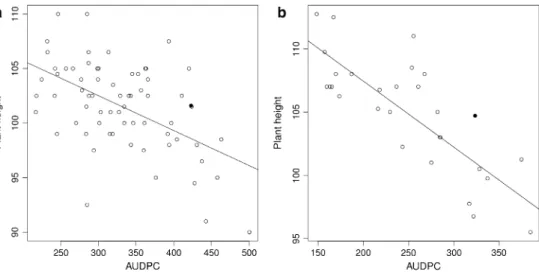
to SnG-QTl donor cultivar ‘Arina’, some nIls were even shorter than cultivar ‘Forno’. Overall, the tested lines showed a distribution of plant height from 90 to 120 cm (Table 2). The rank correlation (r) of plant height and resistance to SnG ranged from −0.53 (average AUDPC and average plant height in Changins 2011) to −0.78 (average AUDPC and plant height in reckenholz 2012) and revealed a negative correlation between these two traits (Table S2). This trend is depicted on the plot of SnG resistance (AUDPC value) against plant height of 67 nIls (Fig. 3a), and becomes more pronounced in the combined dataset of 28 nIls from reck-enholz-2012, Changins-2011 and Vouvry-2011 (Fig. 3b). The rank correlation of plant height between the environ-ments varied from a moderate correlation of 0.36 in 67 nIls to a high correlation of 0.77 in 28 nIls (Table S2). Broad-sense heritability of SnG resistance was 0.71 for 67 nIls tested in 2011 in two environments—Changins and Vouvry. Heritability of plant height was 0.63 for 67 nIls, tested in Changins-2011 and reckenholz-2011.
Single marker analysis (SMA) defines regions associated with SnG resistance and plant height
To localize Qsng.sfr-3BS on the genetic map, we applied single marker analysis (using mixed linear model) to the two datasets (67 nIls and the subset of 28 nIls, Table 3). We included the phenotypic data from Changins-2011 and Vouvry-2011 for the analysis of 67 nIls. The SMA of this dataset detected no significant association between the AUDPC value for SnG and any of genetic markers from the target region. Analysis of the subset of 28 nIls was done using the combined data from Changins-2011, Vouvry-2011 and reckenholz-2012. It identified an asso-ciation between AUDPC and the interval swm00850bd–
wmm756 (region A, Fig. 1). According to the physical map of chromosome 3B (Fig. 1), region A has a size of 4.5 Mb (6 physical contigs).
Since the nIl population segregated for plant height, we checked whether plant height is associated with any of the markers in the target region of QSng.sfr-3BS. Simi-larly to the SMA of AUDPC, we analyzed two datasets of 67 and 28 nIls. For the analysis of 67 nIls, we included the data from Changins-2011 and reckenholz-2011. Analy-sis of mixed linear model detected a significant association between the trait and the genetic interval swm00850bd–
wmm756 (region A, Fig. 1), with the most significant
F-value for the marker wmm756 (Table 3). The analysis of 28 nIls included the data from reckenholz-2012 and 2011, and Changins-2011 and revealed associations of plant height with the genetic interval gwm389–wmm756, as well as with the marker nw1644 which co-segregates with the proximal flanking marker barc133. We consider the associa-tion of barc133 to be an artifact, because of the selecassocia-tion of the BC3F2 plants for recombination between the proximal markers gwm389 and barc133, the mapping population con-sisted only of lines recombining in the target region. There-fore, the parental alleles for barc133 were exactly opposite to the parental alleles of gwm389 in all recombinants. Thus, as there is a lower AUDPC score of the ‘Arina’ allele for marker gwm389, there has also to be a lower AUDPC value for the ‘Forno’ allele at marker barc133.
Since plant height correlated with disease resistance, the next step was to conduct SMA of disease resistance using plant height as a cofactor in the analysis. Two datasets were analyzed: 67 nIls with the phenotypic data from Chang-ins-2011 and 28 nIls with the data from ChangChang-ins-2011 and reckenholz-2012, where both AUDPC and plant height were measured (Table 4). Surprisingly, SMA for 67 nIls detected one significant association of SnG resistance with the marker swm01210bd, which was not detected before in SMA of AUDPC without plant height as a cofactor. Thus, SMA indicates the presence of potentially two intervals associated with resistance to SnG within the target region for QSng.sfr-3BS (regions A and B, Fig. 1).
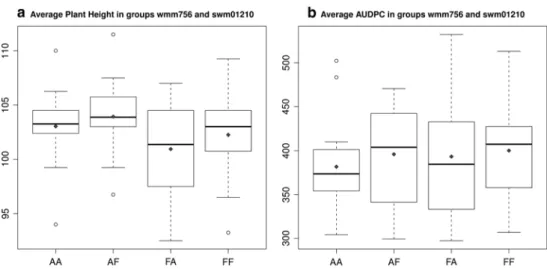
Fig. 3 Average values of plant height and AUDPC score of 67 nIls (a) and 28 nIls (b). Average values were calculated from one environment for 67 nIls and two environments for 28 nIls. Black dots represent average value of recurrent par-ent (cultivar Forno)
The analysis of 28 nIls detected no significant asso-ciation between disease resistance and any of the mark-ers in the QTl target region; however, the genetic interval
swm00850bd–nw1821 had t values close to significance (Table 4). For both datasets (28 and 67 nIls) plant height as a fixed cofactor in the model was highly significant. The calculated percentage of the total variance of SnG AUDPC explained by plant height was 34.5 % for 67 nIls. There-fore, plant height and disease resistance to SnG for the region A might have the same genetic basis.
Two genetically distinct regions are contributing to SnG resistance in nIls
Single marker analysis indicated the presence of two loci associated with SnG resistance. We wanted to study if additional analysis could further substantiate this finding. Therefore, we analyzed the distributions of the average
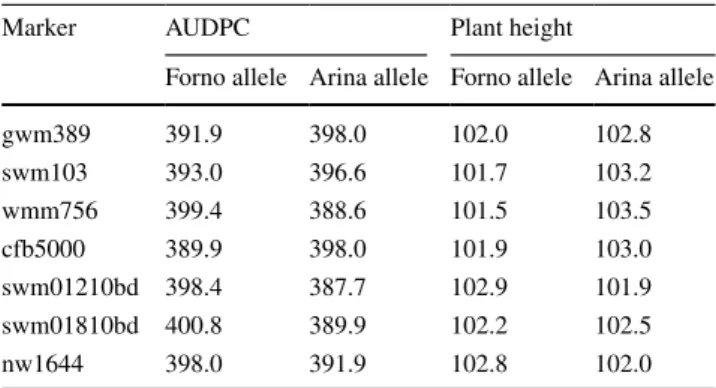
AUDPC and plant height of two environments for 67 nIls in the two allele classes for individual markers (Table 5). Marker wmm756 showed the largest height difference of 2 cm for ‘Arina’ and ‘Forno’ classes as expected from the SMA described above. Similarly, the allele classes for AUDPC values revealed largest differences for mark-ers wmm756, swm01210bd and swm01810bd. The ‘Arina’ class had the lowest AUDPC values for marker wmm756 from the region A and marker swm01210bd from region B, which corresponded to the resistance loci identified by SMA.
next, we divided the 67 nIls into four groups based on their genotype for the markers wmm756 and swm01210bd to test the hypothesis of two independent SnG loci (Fig. 4). The distributions of the phenotypic values of the four groups AA-‘Arina’ alleles for the two markers
wmm756 and swm01210bd, AF-‘Arina’ for wmm756 and ‘Forno’ for swm01210bd, FA-‘Forno’ wmm756 and ‘Arina’
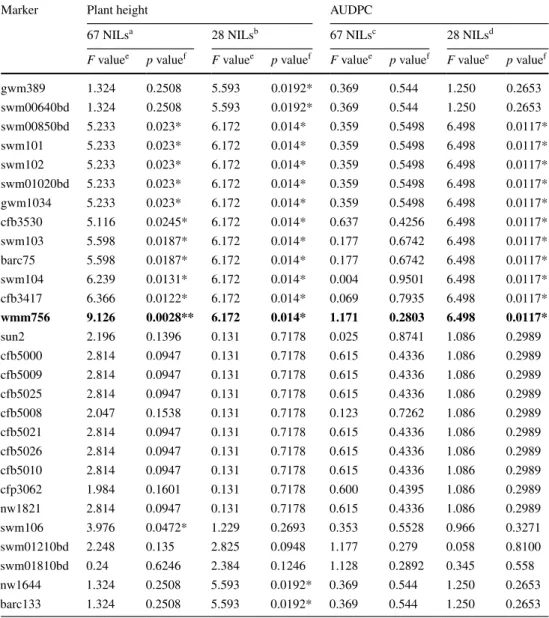
Table 3 Single marker analysis of SnG resistance and plant height
The most significant marker wmm756 is indicated in bold a SMA (mixed linear model) of the 67 nIls with two replications from 2 environments (Changins-2011 and reckenholz-2011) b SMA (mixed linear model) of the 28 nIls with two replications from 3 environments (Changins-2011, reckenholz-2011 and reckenholz-2012) c SMA (mixed linear model) of the 67 nIls with two replications from 2 environments (Changins-2011 and Vouvry-2011)
d SMA (mixed linear model) of the 28 nIls with two rep-lications from 3 environments (Changins-2011, Vouvry-2011 and reckenholz-2012)
e F value of the given marker effect
f Significance thresholds of the given marker effect * p < 0.05, ** p < 0.01, *** p < 0.001
Marker Plant height AUDPC
67 nIlsa 28 nIlsb 67 nIlsc 28 nIlsd
F valuee p valuef F valuee p valuef F valuee p valuef F valuee p valuef
gwm389 1.324 0.2508 5.593 0.0192* 0.369 0.544 1.250 0.2653 swm00640bd 1.324 0.2508 5.593 0.0192* 0.369 0.544 1.250 0.2653 swm00850bd 5.233 0.023* 6.172 0.014* 0.359 0.5498 6.498 0.0117* swm101 5.233 0.023* 6.172 0.014* 0.359 0.5498 6.498 0.0117* swm102 5.233 0.023* 6.172 0.014* 0.359 0.5498 6.498 0.0117* swm01020bd 5.233 0.023* 6.172 0.014* 0.359 0.5498 6.498 0.0117* gwm1034 5.233 0.023* 6.172 0.014* 0.359 0.5498 6.498 0.0117* cfb3530 5.116 0.0245* 6.172 0.014* 0.637 0.4256 6.498 0.0117* swm103 5.598 0.0187* 6.172 0.014* 0.177 0.6742 6.498 0.0117* barc75 5.598 0.0187* 6.172 0.014* 0.177 0.6742 6.498 0.0117* swm104 6.239 0.0131* 6.172 0.014* 0.004 0.9501 6.498 0.0117* cfb3417 6.366 0.0122* 6.172 0.014* 0.069 0.7935 6.498 0.0117* wmm756 9.126 0.0028** 6.172 0.014* 1.171 0.2803 6.498 0.0117* sun2 2.196 0.1396 0.131 0.7178 0.025 0.8741 1.086 0.2989 cfb5000 2.814 0.0947 0.131 0.7178 0.615 0.4336 1.086 0.2989 cfb5009 2.814 0.0947 0.131 0.7178 0.615 0.4336 1.086 0.2989 cfb5025 2.814 0.0947 0.131 0.7178 0.615 0.4336 1.086 0.2989 cfb5008 2.047 0.1538 0.131 0.7178 0.123 0.7262 1.086 0.2989 cfb5021 2.814 0.0947 0.131 0.7178 0.615 0.4336 1.086 0.2989 cfb5026 2.814 0.0947 0.131 0.7178 0.615 0.4336 1.086 0.2989 cfb5010 2.814 0.0947 0.131 0.7178 0.615 0.4336 1.086 0.2989 cfp3062 1.984 0.1601 0.131 0.7178 0.600 0.4395 1.086 0.2989 nw1821 2.814 0.0947 0.131 0.7178 0.615 0.4336 1.086 0.2989 swm106 3.976 0.0472* 1.229 0.2693 0.353 0.5528 0.966 0.3271 swm01210bd 2.248 0.135 2.825 0.0948 1.177 0.279 0.058 0.8100 swm01810bd 0.24 0.6246 2.384 0.1246 1.128 0.2892 0.345 0.558 nw1644 1.324 0.2508 5.593 0.0192* 0.369 0.544 1.250 0.2653 barc133 1.324 0.2508 5.593 0.0192* 0.369 0.544 1.250 0.2653
swm01210bd and FF-‘Forno’ for both markers are shown in Fig. 4. A t test did not detect significant differences between the groups, but when considering the group means there was a clear trend. The average values from the two environments Changins-2011 and reckenholz-2011 for plant height showed that the AA and AF groups were taller (Fig. 4a). A smaller size of boxes and whiskers on the plot for the AA and AF groups in comparison to the FA and FF groups also indicated that plant height values were distrib-uted within a smaller range in the first two groups with the
‘Arina’ allele of marker wmm756, whereas in the absence of wmm756 ‘Arina’ allele plant height might be more strongly influenced by environmental factors.
In agreement with the hypothesis of two resistance loci present in the target region, the average AUDPC values of 67 nIls from the two environments Changins-2011 and Vouvry-2011 were lowest for the AA group (Fig. 4b). The short length of the upper whisker for the AA group sug-gested that except for the two outliers, this group showed a clear tendency for a stronger resistance as the AUDPC values fall into the same range of low values. In contrast, the FF group showed the highest AUDPC of both median and mean values among all genotypic groups. The sizes of boxes and whiskers for the AF, FA and FF groups were larger than for the AA group, which indicated a wider dis-tribution of the AUDPC values in these groups. The wider distribution of the AUDPC in the groups with no (FF) or only one resistance locus (AF and FA) suggested that the presence of two resistance loci (group AA) indeed resulted in strongest resistance. The AF, FA and FF groups might be more influenced by other genetic components and envi-ronmental factors. Thus, we conclude that there were two resistance loci in the target interval and the presence of both loci provided the strongest resistance response. The region A resistance locus was associated with both plant height and SnG resistance. The effect of the resistance locus B linked to swm01210bd seemed to be larger than the effect of the resistance locus A linked to wmm756.
Discussion
Field infection tests of a nIl population revealed a quanti-tative distribution for both SnG resistance and plant height. The two traits were reproducible between different tested environments and showed a moderate to high correlation. Further analysis of the target region identified two loci: region A (swm00850bd – wmm756) and B (swm01210bd),
Table 4 Single marker analysis of SnG resistance with plant height as a cofactor
The significant marker swm01210bd is indicated in bold
a SMA (mixed linear model) of the 67 nIls with two replications from Changins-2011
b SMA (mixed linear model) of the 28 nIls with two replications from 2 environments (Changins-2011 and reckenholz-2012)
c t-value of the given marker effect
d Significance thresholds of the given marker effect * p < 0.05, ** p < 0.01, *** p < 0.001
Marker AUDPC AUDPC
67 nIla 28 nIlb
t-valuec p-valued t-valuec p-valued
gwm389 −0.519 0.605 0.886 0.378 swm00640bd −0.519 0.605 0.886 0.378 swm00850bd 0.007 0.995 1.960 0.0526 swm101 0.007 0.995 1.960 0.0526 swm01020bd 0.007 0.995 1.960 0.0526 gwm1034 0.007 0.995 1.960 0.0526 cfb3530 0.020 0.984 1.960 0.0526 swm103 0.180 0.858 1.960 0.0526 barc75 0.180 0.858 1.960 0.0526 swm104 0.431 0.667 1.960 0.0526 cfb3417 0.168 0.867 1.960 0.0526 wmm756 −0.119 0.905 1.960 0.0526 sun2 −0.171 0.865 1.978 0.0504 cfb5000 0.273 0.786 1.978 0.0504 cfb5009 0.273 0.786 1.978 0.0504 cfb5025 0.273 0.786 1.978 0.0504 cfb5008 0.328 0.743 1.978 0.0504 cfb5021 0.273 0.786 1.978 0.0504 cfb5026 0.273 0.786 1.978 0.0504 cfb5010 0.273 0.786 1.978 0.0504 cfp3062 0.419 0.676 1.978 0.0504 nw1821 0.273 0.786 1.978 0.0504 swm106 −0.183 0.855 1.160 0.249 swm01210bd 2.334 0.0212* 0.911 0.364 swm01810bd 0.074 0.941 −0.803 0.424 nw1644 0.519 0.605 −0.886 0.378 barc133 0.519 0.605 −0.886 0.378
Table 5 Plant height and AUDPC for 67 nIls (average of two envi-ronments) divided into ‘Arina’ and ‘Forno’ classes for each of the markers (average value of the class is shown)
Marker AUDPC Plant height
Forno allele Arina allele Forno allele Arina allele
gwm389 391.9 398.0 102.0 102.8 swm103 393.0 396.6 101.7 103.2 wmm756 399.4 388.6 101.5 103.5 cfb5000 389.9 398.0 101.9 103.0 swm01210bd 398.4 387.7 102.9 101.9 swm01810bd 400.8 389.9 102.2 102.5 nw1644 398.0 391.9 102.8 102.0
associated with SnG resistance. region A was also associ-ated with plant height.
Fine mapping of the target interval for SnG QTl in the ‘Arina’ × ‘Forno’ nIl population
The physical map of chromosome 3B allowed us to improve the genetic map for the target interval of
QSng.sfr-3BS by integrating recently developed markers as well as by establishing additional new markers. In contrast to the results in other populations, we detected a very low level of polymorphism in ISBP markers in our nIl popula-tion (Paux et al. 2010). In fact, ISBP markers are based on differences in the insertion sites of (retro)transposons and since our nIl population is derived from a cross of two Swiss winter varieties, there might be less diversity in these repeat junctions than in populations derived from wide crosses, like ‘Chinese Spring’ × ‘renan’, ‘Courtot’ × ‘Chinese Spring’ or ITMI populations, which were used for mapping of ISBPs to anchor the physical map of chromo-some 3B. Another problem was the presence of gaps in the genetic map (regions not covered with genetic markers), which could not be predicted or explained by the physi-cal map or synteny with B. distachyon. Those gaps might be recombination hot spots (Faris et al. 2000; Akhunov et al. 2003) or large chromosomal insertions specific to the ‘Arina’ × ‘Forno’ population. A larger number of mapped markers will be needed to further test the “hot spot”-hypothesis. recently developed genomic resources such as physical maps can be helpful for high-resolution mapping purposes, but individual differences between the paren-tal lines and the cultivars used for the construction of the
physical map have to be considered. Sequenced flow-sorted chromosome 3B of the parental lines for the nIl popula-tion was a successful approach to increase the marker den-sity. Single nucleotide polymorphism markers derived from sequences of the particular parental cultivars combined with the synteny information are very specific and enabled us to target selected regions. Synteny with B. distachyon allowed us to predict the possible position and to choose the potential markers specifically for the critical parts of the genetic map. Both resources, the physical map and the sequence information from ‘Arina’ and ‘Forno’, might be extremely valuable for the identification of candidate genes when the target interval is further narrowed.
SnG resistance is strongly influenced by environmental conditions
Successful development of artificially induced SnG infec-tion was difficult to obtain, as it depends strongly on envi-ronmental conditions such as temperature and humid-ity (eyal et al. 1987; De Wolf and Francl 2000; Shah and Bergstrom 2002). In agreement with these earlier observa-tions, among six conducted field infection tests (2 years, 3 environments) only three trials had optimal conditions for disease development, while three trials showed insuf-ficient disease development and, therefore, had to be dis-carded from the analysis. The trials with successful infec-tion also showed a significant impact of environmental factors (58.6 % of the variance) on the disease development resulting in continuous distribution of AUPDC. The range of correlation coefficients of AUDPC values (0.47–0.81) between and within individual environments indicated on
Fig. 4 Box-plots of the average AUDPC and plant height of 67 nIls in four genotypic groups. 67 nIls were divided into four groups based on genotypes of two markers (wmm756 and swm01210bd). AA ‘Arina’ allele for wmm756 and ‘Arina’ allele for swm01210bd, AF ‘Arina’ wmm756 and ‘Forno’ swm01210bd, FA ‘Forno’ wmm756 and
‘Arina’ swm01210bd and FF both markers have ‘Forno’ allele. The black line is a median of each group and black diamond-shaped dot is a group mean. a Average plant height score among 2 environments; b average AUDPC score. The whiskers depict the minimum and maxi-mum values
the one hand, presence of the proposed QTl in the selected nIls, and on the other hand, a strong influence of environ-mental factors on SnG resistance. reproducibility of the results was demonstrated by the correlation between three environments (0.56–0.84) and heritability of the trait (0.71 for 67 nIls). These results are very similar to the results observed previously in the ‘Arina’ × ‘Forno’ rIl popula-tion: correlation of SnG resistance between environments varied from 0.59–0.84 and heritability of the trait was 0.80 (Schnurbusch et al. 2003). These results from phenotyping show that our data are reliable, but too variable for clearly assigning a genotype to a “resistant” or “susceptible” class. Future experiments to obtain resistance data should possi-bly be done at a larger number of field sites and over sev-eral years to get data of sufficient quality for high-resolu-tion mapping and ultimately for cloning of the resistance gene(s).
Is the SnG resistance QTl linked to wmm756 a plant height QTl?
In addition to the segregation for SnG resistance, we observed segregation for plant height in our nIl popula-tion. This segregation was reproducible and heritable, and SnG resistance and plant height showed a moderate to high negative correlation in all tested environments. A cor-relation between plant height and resistance to SnG was previously shown under field conditions suggesting dis-ease escape for the tall plants (Broennimann et al. 1973; Scott et al. 1982; Van Ginkel and rajaram 1999; Wicki et al. 1999). Association of plant height and SnG resist-ance was also identified in the previous QTl study on the rIl population of ‘Arina’ × ‘Forno’ (Schnurbusch et al.
2003) and the rIl population of ‘Forno’ × ‘Oberkul-mer’ (Aguilar et al. 2005). However, Schnurbusch et al. (2003) did not detect any QTl for plant height in the tar-get region for QSng.sfr-3BS. Several QTls for plant height were detected on chromosomes 5Bl, 5Al, 7BS, 3Bl and 2Al on the genetic map of ‘Arina’ × ‘Forno’ rIls. The
QSng.sfr-3BS interval did not show any significant asso-ciation with other traits such as plant height or flowering time (Schnurbusch et al. 2003). The fact that we detected a region associated with plant height in the nIl population which was not detected in rIls before might be explained by epistatic effects of other, stronger plant height QTls in the rIl ‘Arina’ × ‘Forno’ population or two nearby QTls with opposite allele effects. looking at the mean (Table 5) and median (Fig. 4) of marker classes, the “Arina” allele of region A (wmm756), increases plant height by 2 cm, while the marker classes of “Arina” allele of region B (swm01210) slightly decreases plant height by 1 cm. Pre-viously, Rht5—a gene modifying plant height was mapped to the same deletion bin on chromosome 3B linked to the
marker barc102 (ellis et al. 2005). Therefore, we cannot exclude that the gene underlying the plant height locus in the target region is Rht5.
Segregation for plant height and its correlation with SnG resistance in our nIl population was unexpected; we used artificial infection after spike emergence in the field and did not rely on natural infections. Artificial infection by spraying plants from above should have decreased the disease escape due to plant height, because in these condi-tions tall and short plants received equal amount of spores directly to the spikes in contrast to natural infection which usually is spreading from infected ground debris from the lower leaves to the ears by rain splashes. nevertheless, tall and short plants could also differ in microclimate condi-tions of the spikes which are known to be important for disease development (Scott et al. 1985). Measuring of addi-tional phenotypic traits such as spike morphology or dis-tance between spikes and flag leaves in future field trials might help to clarify whether plant height per se is influ-encing SnG resistance or if any other minor features of the tested nIls contribute to the disease escape.
Further evidence for the correlation of plant height and SnG resistance was found by including plant height as a factor in general linear model analysis which significantly influenced the SMA results. Furthermore, the previously detected significance for the genetic markers from the inter-val swm00850bd–wmm756 (region A, Fig. 1) became less pronounced, indicating that a large part of the variance was explained by plant height. The correlation of plant height and SnG resistance could have several explanations. SnG resistance in region A could be a gene controlling plant height or it might contain both a resistance gene as well as a plant height gene within a gene cluster, which would explain a co-segregation of the traits. However, the most likely explanation is that the region A controls plant height and results in a change of microclimate at the spike level, with SnG resistance improvement as a pleiotropic effect of the plant height gene.
Two genetically distinct SnG resistance loci are present in the QSng.sfr-3BS target interval
The absence of any influence from the genetic background in a nIl population theoretically allows to “Mendelize” the trait of interest and to divide the phenotypic response of the fine-mapping population in two contrasting classes— “resistant” and “susceptible” (Keurentjes et al. 2007; Pea et al. 2009). QSng.sfr-3B did not manifest itself as Men-delian trait in our nIl population and was scored quanti-tatively. The identification of two resistance loci in the
QSng.sfr-3BS target interval as well as the strong environ-mental influence possibly explains the observed quantita-tive response to S. nodorum infection. The two loci were
detected by SMA: marker wmm756 (region A) and marker
swm01210bd (region B) were both significantly associ-ated with disease resistance. The hypothesis of two seg-regating QTl in the target region would explain why the explained variation of SnG detected by SMA was not as great (Table 5) as expected based on the QTl analysis of the rIls of Arina x Forno (explaining more than 30 % of the variation for SnG; Schnurbusch et al. 2003), although the nIls in our study were on average much more resist-ant than the recurrent parent Forno (Table 2; Fig. 3). The analysis of genotypic groups, taking into account the allelic composition of both markers for region A and B, supported this hypothesis. However, no statistically significant differ-ences were found between the four marker classes. This absence of significant differences could be due to the rela-tively low number of nIls in the four genotypic groups as well as the high environmental dependence of the resist-ance trait. Since the nIl population was developed based on the hypothesis of one QTl localized in the target inter-val, the number of recombinants was clearly not sufficient for the unexpected need to identify two genetically distinct loci. To separate the effects of two loci and isolate each of them in the ‘Forno’ genetic background, the number of nIls has to be at least doubled in comparison to the 67 lines analyzed in our study. Additionally, some variation among the nIls for both plant height and AUDPC which probably was caused by the remaining 6.25 % genetic background from ‘Arina’ might also have influenced the results of the analysis.
Tightly linked QTls controlling the same trait have previously been described for other quantitative traits. In tomato, two QTls Brix9-2-5 and PW9-2-5 located 0.3 cM apart are both modifying sugar content (Fridman et al.
2002). In rice, QTl Hd3 consisted of two linked QTls
Hd3a and Hd3b controlling heading date (Monna et al.
2002). A QTl for flowering time dth1.1 consisted of at least two distinct sub-QTls dth1.1a and dth1.1b (Thom-son et al. 2006). Another example is a growth-rate QTl in
Arabidopsis thaliana, consisting of two tightly linked QTls located within a 210 kb interval (Kroymann and Mitchell-Olds 2005). The SnG resistance analysis presented in this study focusing on QSng.sfr-3BS revealed an additional case for two closely linked QTl. Furthermore, the pleiotropic effect of the two involved loci on plant height further com-plicated the analysis. These findings indicate an unexpect-edly high genetic complexity of SnG resistance in cultivar ‘Arina’ and the need for the development of larger popula-tions where the effects of the two linked QTl are separated from each other in a sufficiently large number of individual genotypes. Only in such a mendelized form in even more identical backgrounds a future molecular cloning can be envisaged.
Acknowledgments We thank Bea Senger and Stefan Kellenberger for excellent technical assistance with the field experiments. We thank Philip Streckeisen for the guidance on SnB field scorings. We also thank Bea Senger for the technical help with the plant material in the greenhouse. We thank Hana Simkova and Jaroslav Dolezel for isola-tion of chromosome 3B by flow cytometry. We also thank Matthias Helling for the help with the statistical analysis. The research lead-ing to these results received fundlead-ing from the european Community’s Seventh Framework Programme (FP7/2007-2013) under the grant agreement FP7-212019 (Triticeae Genome) and was supported in the framework of the european Cooperation in Science and Technology FA0604 (Tritigen). This work was also supported by a grant from the Swiss national Science Foundation 31003A_127061. The experi-ments in this study comply with the current laws of Switzerland.
Conflict of interest The authors declare that they have no conflict of interest.
References
Aguilar V, Stamp P, Winzeler M, Winzeler H, Schachermayr G, Keller B, Zanetti S, Messmer MM (2005) Inheritance of field resistance to Stagonospora nodorum leaf and glume blotch and correlations with other morphological traits in hexaploid wheat (Triticum aes-tivum l.). Theor Appl Genet 111:325–336
Akhunov eD, Goodyear AW, Geng S, Qi l-l, echalier B, Gill BS, Miftahudin, Gustafson JP, lazo G, Chao S, Anderson OD, link-iewicz AM, Dubcovsky J, rota Ml, Sorrells Me, Zhang D, nguyen HT, Kalavacharla V, Hossain K, Kianian SF, Peng J, lapitan nlV, Gonzalez-Hernandez Jl, Anderson JA, Choi D-W, Close TJ, Dilbirligi M, Gill KS, Walker-Simmons MK, Steber C, McGuire Pe, Qualset CO, Dvorak J (2003) The organization and rate of evolution of wheat genomes are correlated with recombi-nation rates along chromosome arms. Genome res 13:753–763 Bennett MD, Smith JB (1976) nuclear DnA amounts in angiosperms.
Philos Trans r Soc lond B Biol Sci 274:227–274
Bostwick De, Ohm HW, Shaner G (1993) Inheritance of Septoria glume blotch resistance in wheat. Crop Sci 33:439–443
Broennimann A (1968) Untersuchungen über Septoria nodorum Berk. des Weizens. Mitteil Schweiz landw 16:65–76
Broennimann A (1975) Contributions to genetics of tolerance towards Septoria nodorum Berk. in wheat (Triticum aestivum l.). J Plant Breed 75:138–160
Broennimann A, Fossati A, Hani F (1973) Spreading of Septoria nodorum Berk. and damage to artificially induced mutants of winter wheat cultivar Zenith (Triticum aestivum l.). J Plant Breed 70:230–245
Bryan GJ, Stepherson P, Collins A, Kirby J, Smith JB, Gale MD (1999) low level of DnA sequence variation among adapted genotypes of hexaploid wheat. Theor Appl Genet 99:192–198 Choulet F, Wicker T, rustenholz C, Paux e, Salse J, leroy P, Schlub
S, Paslier M-Cl, Magdelenat G, Gonthier C, Couloux A, Budak H, Breen J, Pumphrey M, liu S, Kong X, Jia J, Gut M, Brunel D, Anderson JA, Gill BS, Appels r, Keller B, Feuillet C (2010) Megabase level sequencing reveals contrasted organization and evolution patterns of the wheat gene and transposable element spaces. Plant Cell 22:1686–1701
Crawley MJ (2007) The r book. Wiley, england
Draeger r, Gosman n, Steed A, Chandler e, Thomsett M, Srini-vasachary, Schondelmaier J, Buerstmayr H, lemmens M, Schmolke M, Mesterhazy A, nicholson P (2007) Identification of QTls for resistance to Fusarium head blight, DOn accumulation
and associated traits in the winter wheat variety Arina. Theor Appl Genet 115:617–625
Duczek lJ, Sutherland KA, reed Sl, Bailey Kl, lanford GP (1999) Survival of leaf spot pathogens on crop residues of wheat and barley in Saskatchewan. Can J Plant Pathol 21:165–173
ellis MH, rebetzke GJ, Azanza F, richards rA, Spielmeyer W (2005) Molecular mapping of gibberillin-responsive dwarfing genes in bread wheat. Theor Appl Genet 111:423–430
eriksen l, Borum F, Jahoor A (2003) Inheritance and localisation of resistance to Mycosphaerella graminicola causing septoria trit-ici blotch and plant height in the wheat (Triticum aestivum l.) genome with DnA markers. Theor Appl Genet 107:515–527 eyal Z, Scharen Al, Prescott JM and van Ginkel M (1987) The
Sep-toria diseases of wheat: concepts and methods of disease man-agement. CIMMYT, Mexico, DF
FAO stat (2010) Food and Agriculture organization of the United nations. Available at http://faostat.fao.org
Faris JD, Haen KM, Gill BS (2000) Saturation mapping of a gene-rich recombination hot spot region in wheat. Genetics 154:823–835 Fridman e, liu YS, Carmel-Goren l, Gur A, Shoresh M, Pleban T,
eshed Y, Zamir D (2002) Two tightly linked QTls modify tomato sugar content via different physiological pathways. Mol Genet Genomics 266:821–826
Fried PM, Meister e (1987) Inheritance of leaf and head resistance of winter wheat to Septoria nodorum in a diallel cross. Phytopathol-ogy 77:1371–1375
Gervais l, Dedryver F, Morlais J-Y, Bodusseau V, negre S, Bilous M, Groos C, Trottet M (2003) Mapping of quantitative trait loci for field resistance to Fusarium head blight in an european winter wheat. Theor Appl Genet 106:961–970
Halama P (2002) Mating relationships between isolates of Phae-osphaeria nodorum, (anamorph Stagonospora nodorum) from geographical locations. eur J Plant Pathol 108:593–596
Hallauer Ar, Miranda Fo JB (1981) Quantitative genetics in maize breeding. The Iowa University Press, Ames
Hollister JD, Gaut BS (2009) epigenetic silencing of transposable elements: a trade-off between reduced transposition and del-eterious effects on neighboring gene expression. Genome res 19:1419–1428
Jeger MJ, Viljanen-rollinson SlH (2001) The use of the area under the disease progress curve (AUDPC) to assess quantitative dis-ease resistance in crop cultivars. Theor Appl Genet 102:32–40 Keurentjes JJB, Bentsink l, Alonso-Blanco C, Hanhart CJ, Vries
HB-D, effgen S, Vreugdenhil HB-D, Koornneef M (2007) Development of a near-isogenic line population of Arabidopsis thaliana and comparison of mapping power with a recombinant inbred line population. Genetics 175:891–905
Kroymann J, Mitchell-Olds T (2005) epistasis and balanced polymor-phism influencing complex trait variation. nature 435:95–98 laubscher FX, von Wechmar B, van Schalkwyk D (1966) Heritable
resistance of wheat varieties to Glume Blotch (Septoria nodorum Berk.). J Phytopathol 56:260–264
Mesterhazy A (1995) Types and components of resistance to Fusar-ium head blight of wheat. Plant Breed 114:377–386
Monna l, lin X, Kojima S, Sasaki T, Yano M (2002) Genetic dissec-tion of a genomic region for a quantitative trait locus, Hd3, into two loci, Hd3a and Hd3b, controlling heading date in rice. Theor Appl Genet 104:772–778
nelson lr, Gates Ce (1982) Genetics of host plant resistance of wheat to Septoria nodorum. Crop Sci 22:771–773
Oliver rP, Friesen Tl, Faris JD, Solomon PS (2012) Stagonospora nodorum: from pathology to genomics and host resistance. Annu rev Phytopathol 50:23–43
Paillard S, Schnurbusch T, Winzeler M, Messmer M, Sourdille P, Abderhalden O, Keller B, Schachermayr G (2003) An integrative
genetic linkage map of winter wheat (Triticum aestivum l.). Theor Appl Genet 107:1235–1242
Paux e, Sourdille P, Salse J, Saintenac C, Choulet F, leroy P, Korol A, Michalak M, Kianian S, Spielmeyer W, lagudah e, Somers D, Kilian A, Alaux M, Vautrin S, Bergès H, eversole K, Appels r, Safar J, Simkova H, Dolezel J, Bernard M, Feuillet C (2008) A physical map of the 1-gigabase bread wheat chromosome 3B. Science 322:101–104
Paux e, Faure S, Choulet F, roger D, Gauthier V, Martinant J-P, Sourdille P, Balfourier F, Paslier M-Cl, Chauveau A, Cakir M, Gandon B, Feuillet C (2010) Insertion site-based polymor-phism markers open new perspectives for genome saturation and marker-assisted selection in wheat. Plant Biotechnol J 8:196–210 Pea G, Paulstephenraj P, Canè MA, Sardaro MlS, landi P, Morgante
M, Porceddu e, Pè Me, Frascaroli e (2009) recombinant near-isogenic lines: a resource for the mendelization of heterotic QTl in maize. Mol Genet Genomics 281:447–457
rustenholz C, Choulet F, laugier C, Šafárˇ J, Šimková H, Doležel J, Magni F, Scalabrin S, Cattonaro F, Vautrin S, Bellec A, Bergès H, Feuillet C, Paux e (2011) A 3,000-loci transcription map of chromosome 3B unravels the structural and functional features of gene islands in hexaploid wheat. Plant Physiol 157:1596–1608 r Development Core Team (2013) r: A language and environment
for statistical computing. r Foundation for Statistical Com-puting, Vienna, Austria. Url http://www.r-project.org. ISBn 3-900051-07-0
Schnurbusch T, Paillard S, Fossati D, Messmer M, Schachermayr G, Winzeler M, Keller B (2003) Detection of QTls for Stagonos-pora glume blotch resistance in Swiss winter wheat. Theor Appl Genet 107:1226–1234
Scott Pr, Benedikz PW, Cox CJ (1982) A genetic study of the rela-tionship between height, time of ear emergence and resistance to Septoria nodorum in wheat. Plant Pathol 31:45–60
Scott Pr, Benedikz PW, Zones HG, Ford MA (1985) Some effects of canopy structure and microclimate on infection of tall and short wheats by Septoria nodorum. Plant Pathol 34:587–593
Shah DA, Bergstrom GC (2002) A rainfall-based model for predicting the regional incidence of wheat seed infection by Stagonospora nodorum in new York. Phytopathology 92:511–518
Shatalina M, Wicker T, Buchmann JP, Oberhaensli S, Simková H, Doležel J, Keller B (2013) Genotype-specific SnP map based on whole chromosome 3B sequence information from wheat culti-vars Arina and Forno. Plant Biotechnol J 11:23–32
Shaw MW, Bearchell SJ, Fitt BDl, Fraaije BA (2008) long-term relationships between environment and abundance in wheat of Phaeosphaeria nodorum and Mycosphaerella graminicola. new Phytol 177:229–238
Srinivasachary Gosman n, Steed A, Hollins TW, Bayles r, Jennings P, nicholson P (2009) Semi-dwarfing rht-B1 and rht-D1 loci of wheat differ significantly in their influence on resistance to Fusar-ium head blight. Theor Appl Genet 118:695–702
The International rice Genome Sequencing Project (2005) The map-based sequence of the rice genome. nature 436:793–800
Thomson MJ, edwards JD, Septiningsih eM, Harrington Se, McCouch Sr (2006) Substitution mapping of dth1.1, a flower-ing-time quantitative trait locus (QTl) associated with trans-gressive variation in rice, reveals multiple sub-QTl. Genetics 172:2501–2514
Tommasini l, Schnurbusch T, Fossati D, Mascher F, Keller B (2007) Association mapping of Stagonospora nodorum blotch resistance in modern european winter wheat varieties. Theor Appl Genet 115:697–708
Van Ginkel M, rajaram S (1999) Breeding for resistance to the Septoria/Stagonospora blights of wheat. In: van Ginkel M, Mcnab A, Krupinsky JM (eds) Septoria and Stagonospora
diseases of cereals: a compilation of global research. CIMMYT, Mexico
Wanjugi H, Coleman-Derr D, Huo n, Kianian SF, luo M-C, Wu J, Anderson O, Gu YQ (2009) rapid development of PCr-based genome-specific repetitive DnA junction markers in wheat. Genome 52:576–587
Wicki W, Winzeler M, Schmid Je, Stamp P, Messmer M (1999) Inher-itance of resistance to leaf and glume blotch caused by Septoria nodorum Berk. in winter wheat. Theor Appl Genet 99:1265–1272 Wolf eDD, Francl lJ (2000) neural network classification of tan spot and Stagonospora blotch infection periods in a wheat field envi-ronment. Phytopathology 90:108–113