HAL Id: hal-02883872
https://hal.umontpellier.fr/hal-02883872
Submitted on 29 Jun 2020
HAL is a multi-disciplinary open access
archive for the deposit and dissemination of
sci-entific research documents, whether they are
pub-lished or not. The documents may come from
teaching and research institutions in France or
abroad, or from public or private research centers.
L’archive ouverte pluridisciplinaire HAL, est
destinée au dépôt et à la diffusion de documents
scientifiques de niveau recherche, publiés ou non,
émanant des établissements d’enseignement et de
recherche français ou étrangers, des laboratoires
publics ou privés.
Geophysical and geomorphological investigations of a
Quaternary karstic paleolake and its underground
marine connection in Cassis (Bestouan, Cassis, SE
France)
Carole Romey, Pierre Rochette, Claude Vella, Bruno Arfib, Valérie
Andrieu-Ponel, Regis Braucher, Cedric Champollion, Marc Douchet, Philippe
Dussouillez, Daniel Hermitte, et al.
To cite this version:
Carole Romey, Pierre Rochette, Claude Vella, Bruno Arfib, Valérie Andrieu-Ponel, et al.. Geophysical
and geomorphological investigations of a Quaternary karstic paleolake and its underground marine
connection in Cassis (Bestouan, Cassis, SE France). Geomorphology, Elsevier, 2014, 214, pp.402-415.
�10.1016/j.geomorph.2014.02.021�. �hal-02883872�
Geophysical and geomorphological investigations of a Quaternary karstic
paleolake and its underground marine connection in Cassis (Bestouan,
Cassis, SE France)
Carole Romey
a,⁎
, Pierre Rochette
a, Claude Vella
a, Bruno Ar
fib
a, Valérie Andrieu-Ponel
b, Régis Braucher
a,
Cédric Champollion
c, Marc Douchet
d, Philippe Dussouillez
a, Daniel Hermitte
a, Emanuela Mattioli
e,
Jean-Claude Parisot
a, Jean-Luc Schwenninger
faAix-Marseille Université, CNRS, CEREGE, Eurôpole de l'Arbois BP80, 13545 Aix-en-Provence Cedex4, France b
Aix-Marseille Université, CNRS, IMBE, Eurôpole de l'Arbois BP80, 13545 Aix-en-Provence Cedex4, France
c
Université Montpellier II, Laboratoire de Géosciences, Place Bataillon, 34095 Montpellier Cedex5, France
d
Association Cassis La Rivière Mystérieuse, M.E.V.A., 4 rue Séverin Icard, 13260 Cassis, France
e
UMR 5276 CNRS LGLTPE, Université Lyon 1, ENS Lyon, bâtiment Géode 2 rue Raphaël Dubois, 69622 Villeurbanne Cedex, France
f
University of Oxford, Research Laboratory for Archaeology and the History of Art, Dyson Perrins Building, South Parks Road, OX1 3QY Oxford, United Kingdom
a b s t r a c t
a r t i c l e i n f o
Article history: Received 22 May 2013
Received in revised form 13 February 2014 Accepted 16 February 2014
Available online 3 March 2014 Keywords: Karst Provence Geophysical prospection Submarine spring Paleolake Cassis Bestouan
An original karstic system in a coastal alluvial plain located in a carbonate environment (Cassis, Provence— SE France) was studied using a multi-method approach (electrical resistivity tomography, gravimetric, passive seismic survey), combined with geomorphologic methods, surface observations and drilling. Limestone dissolu-tion and/or cavity collapse led to the development of a polje, which wasfilled rapidly by erosion of Aptian marls. The combination of several dating and paleoenvironmental proxies indicates that the polje wasfilled during a glacial period (MIS 6, 8 or 10, i.e. in the 130–360 ka age range). This discovery has implications for the under-standing of karst processes. The connection between the polje and the three km-long Bestouan underwater karstic conduit with submarine outlet is strongly suggested by sedimentological studies and geophysical prospections.
1. Introduction
Karst areas, which represent about 20% of the land surface, are characterised by a specific landscape, usually devoid of surface runoff but with surface (e.g. sinkhole, canyons) or deep (e.g. caves, under-ground rivers) karstic structures (Ford and Williams, 2007; de Waele et al., 2009). Karst structures present major economic and societal chal-lenges (e.g.Margiotta et al., 2012). They are adequate for agriculture and ideal sites for human habitation (Siart et al., 2010). However, karst systems have very heterogeneous landforms and it is very difficult to study the extent and geometry of deep structures. Understanding the link between the endokarst and exokarst features and their 3D geometry (Audra and Palmer, 2013) is of particular interest for fresh groundwater management and for geotechnical issues. Karstic sedi-ments are also used for paleoenvironmental studies as they function as terrestrial archives (Delannoy et al., 2009). Waterflow is responsible
for karst development in surface landscapes and underground carbon-ate rocks where dissolution open voids. Surface wcarbon-ater can also sink below ground, forming an underground riverflowing through large karstic conduits (Mocochain et al., 2009).
Poljes are karstic structures in the form of a large andflat-floored enclosed depression. Theflat floor is caused by flooding during high flows due to inefficiency of underground drainage.Ford and Williams (2007)recognized three types of polje according to their main function: (1) poljes dominated by allogenic input controls are very common along highlands that can supply abundant clastic load to rivers; (2) structural poljes are dominated by bedrock geological controls; and (3) base-level poljes are dominated by water-table control.
The Mediterranean region is very suitable for the study of karstic phenomena due to ubiquitous limestone lithology, mainly of Cretaceous but also of Jurassic age (Audra et al., 2004), in particular in SE France. Limestones in Provence are often massive and deformed by a complex tectonic history (Demory et al., 2011; Molliex et al., 2011; Lamarche et al., 2012), with significant relief-related energy that is important for karst formation. Karstic areas are shaped by eustatic and/or tectonic forcing as well as hydrological changes. Coastal karst refers to karstic
⁎ Corresponding author. Tel.: +33 4 42 97 15 81. E-mail address:romey@cerege.fr(C. Romey).
features which have been repeatedlyflooded and drained by oscillating sea levels. The evolution of coastal carbonate karst depends on many factors such as groundwater hydrodynamic behaviour which is linked to sea-level changes (van Hengstum et al., 2011; Canora et al., 2012). Sea level has a key role in the formation and functioning of coastal karst structures around Mediterranean Sea: 1) the draw-down of sea level during the Messinian Salinity Crisis is responsible for the develop-ment of karst networks below glacial period sea level (Audra et al., 2004); 2) the rise of sea level during the Holocene caused the develop-ment andflooding of karstic networks active during the glacial period; and 3) the sea water mixing with coastal aquifers (saline intrusion) cre-ates submarine source discharge of brackish water (Fleury et al., 2007). The purpose of the present study is to describe a peculiar coastal karstic system, by combining geophysical surveys, dating methods, geological surfacefield observations and underground submarine exploration. The studied area is currently characterised by a lowland in a topographic depression where a poljefilled by more than 50 m of lacustrine sediments was discovered. Submarine karst conduits have been explored by speleo-divers from the sea for more than 3 km of development inland, and their topographic survey suggests that they may be linked with the polje. Geophysical methods are useful for study-ing heterogeneous karst structure (e.g.Chalikakis et al., 2011; Vadillo et al., 2012). Electric resistivity tomography (ERT) permits the charac-terization of karstic areas thanks to the contrast in electrical resistivity between resistive low permeability rocks and cavitiesfilled with clay-rich sediments (e.g.Siart et al., 2010). Gravimetric survey is used to investigate sub-surface cavities because the density contrast is large between karstified rocks and the filled cavity (Butler, 1984; Styles et al., 2005). The Horizontal-to-Vertical spectral ratio (H/V) method is important for mapping the thickness of lacustrine sediments
(e.g.Delgado et al., 2000; Guéguen et al., 2007; Méric et al., 2007), with a strong S-wave velocity difference (velocity ratio≥ 3.5) between the surface layer and deeper material (Rosenblad and Goetz, 2010).
The combined use of different geophysical methods is powerful for characterising karstic structure (e.g.Pueyo-Anchuela et al., 2011; Štěpančíková et al., 2011), and the comparison of geophysical results with data from drilling allows verification of the interpretations. More-over, drilled sediments have been dated using complementary absolute and relative dating methods. Identification of reworked nanofossils from sediments allows the determination of the sediment source areas. 2. Geological setting
2.1. Geological setting
This study focuses on a small alluvial plain at 86 m altitude in Cassis (Bouches-du-Rhône, Southern France), about half a kilometre wide and 2 km from the Mediterranean Sea (Fig. 1). This depression is currently downstream of a small topographic catchment area of about 8 km2, rising to 444 m altitude. The northwestern part of the catchment area is composed of Lower Cretaceous, massive Barremian limestones (Urgonian facies) whilst the southeastern part consists of an Aptian limestone–marl sequence. Structural setting (Debrand-Passard et al., 1984) is characterised by a monoclinal series with a local dip around 8° to the southeast, although specific localized outcrops reach 18° dip (Fig. 1). To the southeast, the catchment area is limited by the Cenomanian sandstone and limestone cliff, delimiting a separate catch-ment within the Upper Cenomanian marls. A NW–SE orientated fault separates the southern part of the catchment area from an uplifted Barremian limestone ridge, cut by a gorge where the outletflows to
Geological data
Drilling «CAS» Drilling «BST»Physical data
Submarine spring Accurate geolocation of submarine conduit Submarine conduit explored by speleo-diver Hydrographic network Present topographic cachtment areaFy-E : Quaternary alluvium
c3 : Turonian (limestones, marls, sandstones) n5-6 : Aptian (marls)
c1-2 : Albian - Cenomanian (limestones, marls) n4 : Barremian (Urgonian limestones)
Geophysical data
Gravimetric base Gravimetric points H/V points ERT profiles
Marl sampling site Direction of artificial tracer experiments Fault 43°13’33’ N 5°32’32’’E
Fy-E
n5-6
c1-2
c3
398 m asl Mont Gibaou
B A
Mediterranean Sea
Cassis
Bestouan
spring
Port-Miou
spring
n4
355 m asl Mussuguet
C 0 500 1000 meters N(a)
10° 8° CAS11 CAS8 CAS10 CAS13 CAS14 0 50 100 meters N(b)
Fig. 1. Simplified geology and geomorphology of studied area (a) and location of geophysical measurements (b). Relief highlighted following digital terrain model (DTM 5 m,http://www. crige-paca.org). The direction offlow from the two tracer injection points, located outside of the map, is indicated (seeSection 2.2). The trace of the geological sectionFig. 8a is indicated on (a) by letters (A, B, C). For further details on sampling site of marls seeTable 2.
the sea. Quaternary deposits occur within the depression, which was not identified as a polje until the present study.
2.2. Karst
The Cassis area is well-known for its karstic geomorphology and “Calanques” which are canyons cut into Urgonian limestones by fluvio-karstic processes during the glacial period and presently drowned by sea-level rise. Numerous caves exist in the limestone formations (Early Cretaceous in the western part of the studied area, and Late Cretaceous in the eastern part). Major underground karst features are developed below the current sea level. Two submarine conduits have been explored by speleo-divers: the Port-Miou and Bestouan ‘rivers’ (Arfib and Douchet, 2011). The Bestouan river, ending at the Cassis port entrance, shows a sub-horizontal conduit, which runs at a depth between 0 and 29 m bsl with a cross-section ranging between 10 and 30 m2. Its
explora-tion was stopped after 3 km right on the NW–SE fault which borders the southern boundary of the studied depression (Fig. 1) at sea-level, i.e. about 90 m below the soil surface. Port-Miou shows also a sub-horizontal conduit (depth between 0 and 30 m bsl), about ten times larger than Bestouan, over a distance of 2 km from the shoreline followed by a near vertical plunge explored down to 223 m bsl.
These submarine rivers drain groundwater, forming submarine karstic springs with perennial discharge, which are the main groundwa-ter outlet of the Beausset Unit between Marseille and Toulon. These springs have been extensively studied as they represent a potential resource of freshwater and can be used as proxies for karst evolution and fresh groundwater resources around the Mediterranean Sea (Audra et al., 2004; Blavoux et al., 2004; Arfib et al., 2007; Fleury et al., 2007). The Port Miou and Bestouan springs belong to the same karstic aquifer and are brackish due to seawater intrusion (Tassy et al., 2010). The seawater intrusion occurs at a depth and several kilometres inland, upstream from the terminal explorations by the divers.
The Port Miou and Bestouan springs drain an aquifer probably larger than 400 km2, with still uncertain boundaries. A recent dye tracing test showed a rapid connection (transfer velocity about 1.7 km per day) be-tween a sinkhole and the springs in the carbonate–siliciclastic Turonian and Coniacian rocks located 12 km to the east of the studied area (Arfib and Lamarque, 2012) (Fig. 1). It confirms that the springs drain two reservoirs (Arfib et al., 2006): brackish water coming from the deep part of the aquifer through a chimney-shaft, mixed with fresh water flowing in the upper part of the aquifer through vadose, epiphreatic and shallow phreatic conduits. The deep karstic system around the Mediterranean Sea can be related to the Messinian Salinity Crisis (Audra et al., 2004; Mocochain et al., 2006), a sea-level drop of more than 1500 m acting as the base-level for karst development (Krijsman et al., 1999; Rouchy and Caruso, 2006). Later transgressions and Quater-nary sea-level oscillations established a new base-level close to the current sea-level. Cave development through the 2 km-thick Beausset Unit follows the general hydraulic head from north to south, and is also affected by tectonic structures, such as NW–SE faults in the Cassis area.
3. Materials and methods 3.1. Geophysical methods
A 2-D electric resistivity tomography (ERT) was obtained by employing the ABEM Lund Imaging System using an inverse Wenner– Schlumberger configuration with 64 steel electrodes spaced regularly at 10 or 9 m intervals (Fig. 1b). GPS was used to geo-reference datasets. The apparent resistivity was measured using a computer-controlled multi-channel resistivity metre SAS 4000 (Griffiths et al., 1990). RES2-DINV software was used to invert ERT data (Loke and Barker, 1995; Rucker et al., 2011). The validity of the obtained resistivity sections is supported by the low RMS error of about 2% for the 6th iteration.
Gravity data were recorded with a relative micro-gravimeter, model Scintrex CG5, with a 50 × 50 m grid, in order to create a high-resolution gravity map (Fig. 1b). The nominal sensitivity is about 1μGal. Coordi-nates of measurement points were determined using Trimble GPS in a differential mode with an accuracy of ± 0.01 m. Gravimetric data require various corrections (Bonvalot et al., 2008; Merlet et al., 2008; Jacob et al., 2010) to obtain accurate gravity anomalies only correspond-ing to underground density anomalies. Earth solid tide and ocean load-ing correction were calculated usload-ing TSoft Software (van Camp and Vauterin, 2005). To predict the ocean loading, the toolhttp://froste. oso.chalmers.se/loading(Bos and Scherneck, 2011) was applied using the FES2004 oceanic model (Lyard et al., 2006). The drift of the gravity metre (Martín et al., 2011) was corrected by applying a linear approxi-mation to the data between two measurements at the base station every 3–4 h. Free-air and Bouguer gravity corrections were performed followingBlakely (1996). Finally, the average relative gravity over the survey area is subtracted from the Bouguer anomaly at each station. The Bouguer anomaly data were interpolated using the kriging method (with smoothing distance of 100 m). Oasis Montaj software (GM-SYS, 2001) allows removal of the regional trend and interpolation of a map of Bouguer anomaly. 2D gravity modelling has been performed using the GM-SYS Profile Modelling Program (Ramadass et al., 2006). The model was constrained with several geological and physical data.
The H/V measurements (Nakamura, 1989) were performed at 38 sites, which were located with a GPS (Fig. 1b). Seismic noise was record-ed during at least 30 min with a 100 Hz sampling frequency. Each sta-tion was equipped with a GSR 24-bit digitiser connected to a LE-3D/5s seismometer. Data were processed with the Sesarray package (http:// www.geopsy.org, e.g.di Giulio et al., 2006; Wathelet et al., 2008). Microtremor records were cut into 60 s time windows, for which Fouri-er spectra wFouri-ere computed and smoothed using methods described by Konno and Ohmachi (1998). At each site, the H/V spectral ratios were computed for all selected time windows, and the mean H/V curve was determined with standard deviations. The H/V curves were interpreted usingSESAME (2004)criteria to obtain the fundamental frequency of each site (f0).
3.2. Sediment sample and analysis
Two sedimentary records have been investigated: a 50 m-deep drilling (CAS) in the Quaternary lacustrine sequence from the polje (43°13′33″N, 5°32′32″E,Fig. 1) and a 50 cm-deep percussion core (BST) coming from the Bestouan river. The CAS drilling was undertaken by CEREGE and the‘Centre de Carottage et de Forage National’ (C2FN, INSU) using a SEDIDRILL 250-90 drill. Two cores (of 18 and 50 m lengths) were obtained 1 m from each other, with a perfect sedimentary overlap, which allowed us tofill most of the gaps (recovery ratio for lacustrine section: 95%). BST was obtained by divers through inserting a plastic tube into the conduitfloor about 50 m from the entrance, at 18 m depth (Fig. 8). CAS and BST drillings were characterised using sedimentological analysis in order to establish relationship between the karstic structure and the submarine spring. Four shallow soundings were also performed by trenching or percussion coring (Cobra system) in four sites around the CAS drilling to confirm the presence of lacustrine deposits.
The global mineralogy of bulk sediment and the mineralogical com-position of clay fraction were determined by X-Ray diffractometry (XRD). Samples of 0.5 or 1 g were dried and crushed in an agate mortar. Bulk samples were analysed without pre-treatment. For clay samples, as the signal strength of carbonates masked the signal of clay, carbonate and organic matter were removed by chemical treatments. Then only the fractionfiner than 2 μm was kept. Three glass slides were prepared: an untreated control slide, a heated slide (490 °C, 4 h) and a slide treat-ed with ethylene glycol. Identification of clay mineralogy is based on changes in the spectral signature after physical or chemical treatment, compared to an untreated control (Moore and Reynolds, 1989;
Marriner et al., 2011). Semi-quantitative estimations (±5–10%;Biscaye, 1965) of the main clay species were based on the height of specific reflections measured on ethylene glycol pattern. Clay and bulk sample XRD patterns were recorded using a Philips PW 1729 X-Ray generator using KαCo radiation (λ = 1.79 Å) at 40 mA and 40 kV. Data were collected by the step-counting method (step size 0.05°) between 2.5° and 35° (2θ) with a counting time of 5 s per step.
The Ctot, Corg, N and carbonate compositions were determined using
a CNS NA 1500 series 2. The standard used for Corgwas an Acetanilide
powder (C8H9NO, containing 71.09% carbon). Samples of about 30 mg,
dried and crushed in an agate mortar, were burnt at 1024 °C. The measurement of degassed CO2and Nx allows determination of %Ctot
and %N. Then samples between 10 and 15 mg were decarbonated with 250μl of HCl (1 M) at 40 °C over two days. The determination of degassed CO2provides %Corg. %CaCO3content was estimated using
the following equation: %CaCO3= (%Ctot− %Corg) ∗ 8.33.
3.3. Dating and paleontological methods
Radiocarbon dating (6 charcoal samples) was performed at the Poznań Radiocarbon Laboratory (Poland) and at the ARTEMIS facility (Saclay, France). Charcoals and wood fragments were identified by B. Talon at IMBE (Aix-en-Provence, France) before dating.
Magnetostratigraphic relative dating is based on characteristic fea-tures of the magneticfield recorded during sedimentation (polarity chrons and excursions; e.g.Demory et al., 2005). Natural Remanent Magnetization (NRM) was measured with a 2G Enterprises DC-SQUID cryogenic magnetometer 2G 760R equipped with on-line alternating field demagnetization. Discrete 8 cm3cubic samples were used from
BST whilst a continuous record was obtained from CAS using U-channels. Direction of characteristic NRM was determined by principal component analysis of the AF demagnetization curve (Kirschvink, 1980). Optically Stimulated Luminescence (OSL) dating was carried out on quartz mineral grains at the Luminescence Dating Laboratory, Research Laboratory for Archaeology and the History of Art, University of Oxford (England). Three samples for OSL dating were collected from half cores which had previously been opened in daylight. Core sections showing a 5–10 cm sandy layer plus a few centimetre of the upper and lower clays were selected for dating. In order to avoid the inclusion of bleached mineral grains, the exposed surface of the cores (circa 1.5 cm) was removed under low intensityfiltered LED lighting (emitting at ~588 nm). OSL measurements were performed on coarse sand sized grains (180–255 μm) extracted from the sediment using standard preparation procedures (Mejdahl, 1985). OSL measurements were performed on an automated Risø luminescence reader ( Bøtter-Jensen, 1997; Bøtter-Jensen et al., 2000) using a SAR post-IR blue OSL
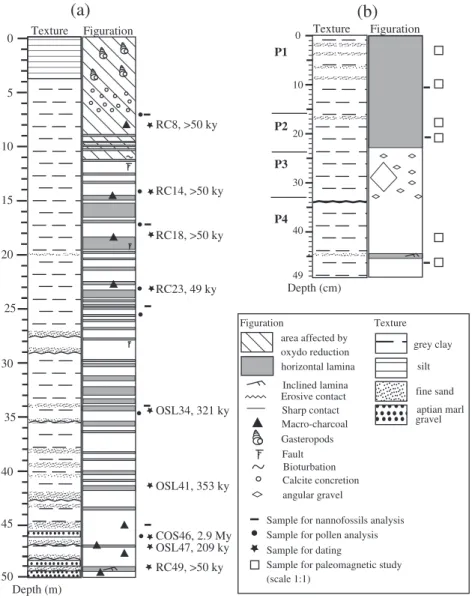
RC18, >50 ky RC8, >50 ky RC23, 49 ky RC49, >50 ky RC14, >50 ky OSL47, 209 ky COS46, 2.9 My OSL34, 321 ky OSL41, 353 ky 10 20 30 40 50 5 45 15 25 35 0 Texture Figuration Depth (m)
(a)
grey clay fine sand silt aptian marl gravel Texture Macro-charcoal Erosive contact Inclined lamina Bioturbation area affected by oxydo reduction horizontal lamina Calcite concretion Gasteropods Sharp contact Figuration angular gravel FaultSample for nannofossils analysis Sample for pollen analysis Sample for dating
Sample for paleomagnetic study (scale 1:1)
(b)
P3 P4 P1 P2 Depth (cm) 0 49 10 40 30 20 Texture FigurationFig. 2. Schematic log of sedimentary records from Cassis (a) and Bestouan (b). Dated samples are denoted according to dating method and depth. RC: radiocarbon, OSL: optically stimulated luminescence, COS: cosmogenic nuclides. SeeSection 4.1for Bestouan levels (P1–P4) explanations.
measurement protocol (Murray and Wintle, 2000; Banerjee et al., 2001; Wintle and Murray, 2006). Dose rate calculations are based onAitken (1985). The OSL age estimates include an additional 3% systematic error to account for uncertainties in source calibration. One sample for cosmogenic nuclide dating (26Al/10Be burial method) sample was
prepared at CEREGE-LN2C and measured at ASTER, the French acceler-ator mass spectrometry (AMS) facility (Aix-en-Provence, France). Quartz (~50 g) obtained after decarbonation of thefine sandy fraction (100–400 μm) from a thick sand layer near the core base was then treated following the protocol of sample preparation for26Al and10Be
measurement (Braucher et al., 2000).
The pollen record (10 samples) was studied in IMBE (France). Because of the poor concentration of sporo-pollinic material, samples were prepared using the method of Takeshi (Nakagawa et al., 1998) using heavy liquid (density = 1.96). Calcareous nanofossils were iden-tified at the University of Lyon (LGLTPE, France) in order to characterise the source of karstic sediment in BST. Samples were prepared as smear slides following the technique described inBown and Young (1998), and slides were analysed under a Leica optical microscope, with crossed polars, and 1000× magnification. Taxonomic determinations and age assessments were based onBown (1998).
4. Sedimentary and geophysical results 4.1. Sedimentary record from Cassis and Bestouan
Detailed analysis of the sedimentary sequence is beyond the scope of the present publication. The information relevant to the geomorpholog-ical interpretation will thus be briefly summarized. In the polje CAS core
thefirst 4.5 m corresponds to Holocene alluvium, whilst from 4.5 to 50 mfinely laminated lacustrine sediment was observed (Fig. 2). At the bottom, the contact with massive Cretaceous marl was sampled over a few centimetre. The upper 5 m of lacustrine deposits was yel-lowish brown and oxidized because of redox phenomena due to the vertical oscillation of the watertable and pedogenesis occurring since lakefilling. Alteration of the sediment prevents the identification of lamina in that upper part. Lamination is (sub)horizontal, except in the last few metres close to the bottom. The up to 15° dip of bottom laminae is probably related to subsidence of the bedrock at the be-ginning of sedimentation. The lacustrine sediments show consider-able homogeneity in colour, texture and composition. Grey sediments are indicative of a reducing environment (sulphides have been identified). The lacustrine sediments are carbonate-rich and poor in organic matter (Table 1). XRD analyses undertaken on bulk samples indicated that global mineralogy is dominated by cal-cite (CaCO3), dolomite (Ca, Mg (CO3)2), quartz (SiO2) and clay. XRD
of the clay fraction shows the presence of smectite, illite and kaolinite.
The BST core can be divided in four parts. P1, from 0 to 17 cm depth, is composed by laminated and ocher clay. Colour and low CaCO3content
at the top of P1 (from 3 to 19%) point towards oxidation and decarbon-ation of the sediment. From 0 to 10 cm (P1a) laminae are only due to changes in texture (clay/sand) whereas from 10 to 17 cm (P1b) laminae are caused by changes in colour (few grey laminae in ocher sediment). P2, from 17 to 23 cm, is composed by laminated clay. Clay is mostly grey with some ocher levels and has a higher percentage of CaCO3
(from 25 to 35%). From 17 to 20 cm (P2a), clay is dark grey whereas from 20 to 24 cm (P2b) clay is light grey. P3, from 23 to 34 cm, is
CAS08
0 144 288 432 567 80 60 20 40CAS10
100 80 60 40 20 0CAS11
80 60 40 20 0CAS13
100 80 60 40 20 0CAS14
0 160 320 480 630 0 160 320 480 630 0 160 320 480 630 0 160 320 480 630 100 80 60 40 20 0 4.00 7.84 15.4 30.1 59.0 116 227 444Resistivity (ohm.m)
RMS error 1.4% RMS error 1.7% RMS error 1.28% RMS error 1.44% RMS error 2.0%SE
NW
SW
NE
Fig. 3. 2-D inverted resistivity sections NW–SE (topographically corrected). Four profiles (CAS10, CAS11, CAS13, CAS14) are 630 m long (10 m spacing of electrodes) and one profile (CAS08) is 576 m long (9 m spacing). The vertical scale is the altitude above the sea level (m) and the horizontal scale is the distance (in m) from the NW end. No vertical exaggeration. Pre-karstic interpolated interface between marls and limestones is indicated by a dotted line.
Altitude (m)
Gravity (mGal)
(c)
88 58 28 -8 0.00 -0.10 -0.20 -0.30 0 100 200 300Distance (m)
Host Sed MixSE
NW
MSE =0.006Altitude (m)
Gravity(mGal)
(b)
88 58 28 -8 -0.08 -0.16 -0.24 -0.32 0 100 200 300Distance (m)
Host Sed MixSW
NE
Error Observed data MSE =0.004(a)
GRAV 1 GRAV 2 0 50 100 meters N Δ g (mGal) -0.7 -0.5 -0.3 -0.1 0.1 0.3 0.5Fig. 4. Map of Bouguer anomalies (a) and modelled profiles GRAV1 (b) and GRAV2 (c). The grid cell of the map of Bouguer anomalies is 100 m. 2D models (a, b) were computed using three formations of different density: dhost= 2690 kg/m3(cretaceous bedrock), dsed= 2181 kg/m3(lacustrine sediments and Holocene deposits), and dmix= 2440 kg/m3(mixture between
sediments and bedrock). Drilling“CAS” (star) and fault (dotted line) are localized on GRAV1.
(c)
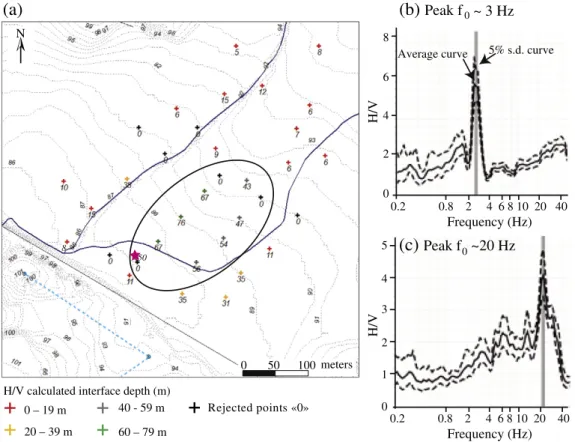
Peak f
0~20 Hz
Frequency (Hz)
0.2 0.8 2 4 6 8 10 20 40H/V
0 1 2 3 4 5(b)
Peak f
0~ 3 Hz
Average curve 5% s.d. curveFrequency (Hz)
0.2 0.8 2 4 6 8 10 20 40H/V
0 2 4 6 8(a)
meters 0 50 100 N 0 – 19 m 20 – 39 m 40 - 59 m 60 – 79 m Rejected points «0» H/V calculated interface depth (m)8
50
Fig. 5. H/V results grouped according to calculated interface depth (a). The area with depths above 40 m is highlighted by a ellipse. Two examples of H/V amplitude ratio versus frequency with resonance peak identification are shown (b, c). Drilling “CAS” is represented by a star. Topography is indicated by isolines (m), rivers are in continuous lines and submarine river in dotted line.
composed by ocher clay with numerous angular pebbles and large sand and gravel fractions. P4, from 34 to 49 cm, is composed by ocher clay, with some sandy laminae.
This succession implies that a high energy event was recorded dur-ing P3, with a subsequentfine sediment input (P2) of composition and origin different than the previous and later input (P1 and P4). The observed difference (higher carbonate content and reduced environ-ment) indicates rapid sedimentation of a sulphide- and/or organic-rich material.
4.2. ERT survey
Six ERT profiles with NW–SE orientation were measured (Fig. 3). The topographic variations, which were also considered in the inver-sion model, are quite small (dh = 5 m). According toSamouëlian et al. (2005)the range of resistivity of unaltered and altered lime-stone is very wide, between 50 and 5000Ω·m whereas lacustrine sediment and marl have low resistivity (5–70 Ω·m) (e.g.Metwaly
and AlFouzan, 2013; Nordiana et al., 2013). Apart from very porous or highly fractured saturated limestones, not present in our study, clay-poor slightly fractured limestone resistivity is assumed N100 Ω·m. ERT is unable to discriminate between formations having similar electrical properties, and the resistivities of marl and Quater-nary lacustrine sediment may be too close to distinguish the bound-ary between both formations. ERT data are only able to locate the boundary between Barremian limestone and the overlying marls or Quaternary formations.
2D pseudo-sections are described from north to south. The descrip-tion is done using the distance from the electrode located at the NW end (designated 0). On the NW end of profiles, the massive limestone levels are nearly outcropping and should plunge about 10° below the Aptian marl or any Quaternaryfilling. The expected top of limestone layer without the impact of karst/dissolution phenomena is indicated by dotted line inFig. 3. Taking the 100Ω·m value as the lower limit for limestones, one could see in CAS11 that a limit between low resistivity and high resistivity material canfit with the expected top of limestone
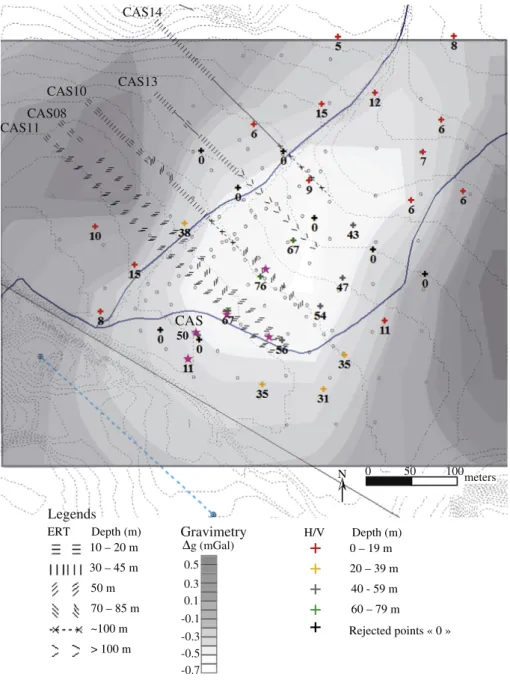
N 10 – 20 m 30 – 45 m 50 m 70 – 85 m ~100 m > 100 m ERT Depth (m)
Δ
g (mGal) -0.7 -0.5 -0.3 -0.1 0.1 0.3 0.5Gravimetry
0 – 19 m 20 – 39 m 40 - 59 m 60 – 79 m H/V Depth (m) Rejected points « 0 »Legends
0 50 100metersCAS14
CAS13
CAS10
CAS08
CAS11
CAS
50Fig. 6. Comparison between ERT (geometric patterns), gravimetric (map) and H/V (crosses) results. The parts of the ERT profiles represented by a straight line correspond to a gradual transition between the two depth classes which surround it. Drilling“CAS” and five shallow (~ 3 m) additional drilling are located by a star.
layer. In other ERT profiles, limits do not match with expected the limestone tops, thus suggesting fracturing and/or dissolution of the limestones and infilling by Quaternary deposits in karstic structures. Major infillings down to more than 80 m depth are identified between electrodes 300 and 350 m in CAS 8, 13 and possibly 14.
Two distinct parts are visible on profile CAS11, the closest profile to the drilling. There is a deep continuous resistivity layer (from 100 to 440Ω·m) which is covered by a less resistive layer (b50 Ω·m). The more resistive layer has a dip characteristic of the regional limestone substratum. Locally, the dip is not constant and it sharply increases around the electrode located at 320 m. The limestone is covered by marl and clay (less resistive). The two layers are observed on the CAS08 profile but their morphologies change. The more resistive layer is cut by the lower resistivity layer between electrodes located at 290 and 340 m. It forms a narrow funnel-shaped structure in the substratum which is filled with a low resistivity material. The depth of the structure is greater than 80 m. CAS10 profile shows a general rise of the high-resistivity material and particularly between electrodes located at 270 and 320 m and between electrodes located at 185 and 230 m. On CAS13 and CAS14 profiles, structures and resistivity variations are similar.
In the near-surface layers of Holocene sediments one can see a steady decrease of average resistivity from NE to SW. The decreasing resistivity corresponds to a more water-rich subsurface layer, in agree-ment with the lower altitude and accumulation of water, as well as thicker Holocene deposits.
4.3. Gravimetric survey
The Bouguer anomaly map (Fig. 4a) shows that after corrections gravity has a small amplitude range of variation (1.2 mGal) from−0.7 to 0.5 mGal. A central band, oriented SW–NE, is highlighted by a nega-tive anomaly which indicates the presence of a low density material, corresponding to the lacustrine sediments. This negative anomaly is elongated SW–NE and is about 400 m long and 200 m wide. It is flanked to the east and west by two positive anomalies, indicating the presence of high density material near the surface corresponding to the Cretaceous bedrock (marl and massive limestone).
The two 2D gravity models (GRAV1 and GRAV2) permit charac-terization of the morphology of the deep karstic structure. These are composed of three compartments:“Sed” represents lacustrine sediments overlain by Holocene deposits;“Host” is the bedrock and“Mix” a mixture between lacustrine sediments and bedrock. Profile GRAV1 (Fig. 4b) through the centre of the negative anomaly follows the SW–NE direction of elongation and is constrained in the SW extremity by the drilling information and the presence of the fault, and by the density of the sediments and bedrock. Measured lacustrine sediment density is 2180 kg/m3 (stereopycnometre
from Quantachrome Instruments, n = 10) The Aptian marl and Barremian limestone densities used are 2690 kg/m3 (Fournier
et al., 2011). Independent constraints are a 50 m thickness of lacus-trine sediments at the CAS core position and the vertical fault put-ting into contact bedrock and lacustrine sediments. At the southwestern end of the GRAV1 profile, a significant and abrupt de-crease in the depth of the sedment/berbrock boundary is visible. The shape of the polje is slightly asymmetrical, with a deepening towards the SW. The part where the structure is deeper than 30 m has a SW–NE extension of about 340 m. The central area of highest negative anomaly can be modelled by a narrow vertical structure of about 15 m width and 90 m depth. It is modelled by an intermediate density material between lacustrine sediment and bedrock density, which indicates a probable filling by blocks of limestone and marl, clogged with clay coming from the erosion of the watershed. Such a mixture, in indeterminate proportions, of limestone, marl and clay, would have resulted in the formation of a level with a density ranging between 2180 and 2690 kg/m3. For this model, the
density for the mixture corresponds to 50% clay and 50% bedrock, i.e. d = 2440 s/m3. This interpretation is not unique and an
alterna-tive model lacking the intermediate density formation and showing a more conical shape is also possible. However, thefirst interpreta-tion is more in agreement with the formainterpreta-tion scenario described in the following text. Profile GRAV2 (Fig. 4c), oriented NW–SE, is per-pendicular to GRAV1 and also crosses the centre of the negative anomaly. The structure is again about 300 m long but the part deeper than 30 m is much narrower.
0 1 2 3 0 10 20 30 40 50 60 70 0 10 20 30 40 50 0 10 20 30 0 5 0 10 20 0 5 10 15 0 2 4 6 8
A
B
1350 1400 1725 2332 2630 3460 3467 3980 4550 4610Percentages
Absolute values
%
t.
MEDITERRANEAN
PINUS ARTEMISIA
PINUS SYLVESTRIS
PIONEER SHRUBS POACEAESTEPPIC HERBSPREQUATERNARYPALYNOMORPHSGYMNOSPERMTRACHEIDS
DEPTH (cm)
L.P.Z.
Arboreal pollens
Herbs pollens
Fig. 7. Simplified pollen diagram of Cassis. Ten samples were analysed (cfFig. 2for location). Percentages are calculated on a pollen sum of vascular plants only. Samples are very poor in pollen (average number per gram of sediment is 560 grains/g; minimum 2.03 grains/g and maximum 4772 grains/g) and the taxonomic diversity is low (13 trees, 38 herbs, 1 fern, 1 algae, 5 fungi). Some pollens have been grouped as pioneer shrubs (Ephedra distachya, Ephedra fragilis, Juniperus, Betula), and steppic herbs (Ammi, Anthemis, Aster, Atriplex, Carlina, Centaurea collina, Centaurea cyanus, Centaurea nigra, Chenopodiaceae, Cichorioideae, Cirsium, Echinops sphaerocephalus, Gypsophila, Helianthemum, Herniaria, Knautia, Lychnis, Papaver, Rosmarinus, Rumex, Sinapis, Succisa and Thalictrum). L.P.Z. means Local Pollen Zone, A indicates a glacial climatic dynamics and B a lateglacial climatic dynamics.
4.4. H/V data
Quaternary sediments and their Cretaceous marls and limestones substratum are characterised by S-wave velocity of 200–600 m/s (Bièvre et al., 2011) and 2000–3500 m/s (Dvorkin et al., 2001;
Fournier et al., 2011), respectively. This velocity contrast is large enough to provide a significant H/V peak (Rosenblad and Goetz, 2010). Treat-ment of H/V curves can integrate all horizontal components or use a specific azimuth in order to minimize 2D effects. Such effects are linked to surface and interface topographies. The NE–SW azimuth, which
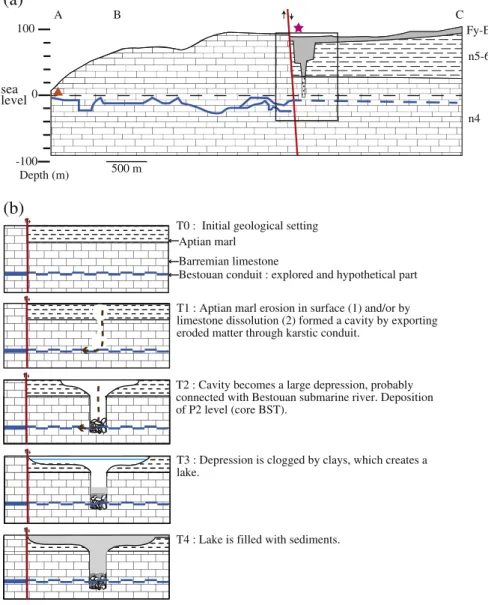
(b)
T0 : Initial geological setting
T1 : Aptian marl erosion in surface (1) and/or by limestone dissolution (2) formed a cavity by exporting eroded matter through karstic conduit.
T2 : Cavity becomes a large depression, probably connected with Bestouan submarine river. Deposition of P2 level (core BST).
T3 : Depression is clogged by clays, which creates a lake.
T4 : Lake is filled with sediments. 1
2
Bestouan conduit : explored and hypothetical part Barremian limestone Aptian marl
(a)
n4 n5-6 Fy-E B A C -100 0 100 Depth (m)sea
level
500 mFig. 8. Interpretative geological section (a) and chronological evolution of karstic system (b). The explored conduit of Bestouan is indicated by a continuous line in the explored part and a dotted line in the hypothetical upstream. Location of geological section is shown inFig. 1a by letters (A, B, C). Geological legend is n4: Barremian (Urgonian), n5-6: Aptian and Fy-E: Quaternary alluvium. Location of cinematic section is shown by the rectangle. Drilling“CAS” is represented by a star and drilling “BST” by a triangle.
Table 1
Mineralogical and chemical data from Cassis paleolake (core CAS), Bestouan underground river (core BST) and Aptian marls.
ID Depth (cm) Level Smectite (%) Illite (%) Kaolinite (%) Chlorite (%) Water (%) %Ctot %Corg %CaCO3
BST 1 3 P1 33 45 11 11 40 0.46 0.14 2.64 BST 2 11 P1 59 30 5 6 46 2.84 0.53 19.17 BST 3 17 P2 32 46 11 11 55 3.87 0.71 26.32 BST 4 20.5 P2 48 35 11 6 38 4.61 0.60 33.44 BST 5 41.5 P4 20 64 16 0 28 2.00 0.13 15.64 BST 6 46.5 P4 44 36 8 12 27 1.95 0.09 15.46 CAS Mean – 70 20 10 0 21 6.17 0.49 47.26 σ – 12 8 6 0 2.28 0.89 0.13 8.62 Max – 90 33 22 0 26 7.80 0.70 62.00 Min – 46 6 4 0 18 4.38 0.30 38.00 Mf – – 29 38 33 0 b1% 9.04 0.32 72.60 Ma – – 76 13 11 0 22 7.62 0.22 61.64
Clay percentages are normalised at 100%; CAS data are reported as a mean of 15 samples with standard deviation (σ). For more explanation about “level” refer toSection 4.1. Sampling location of fresh marls (Mf) and material resulting from the weathering of marls (Ma) are located inFig. 1a
corresponds to the direction of the valley and elongation of gravimetric data, was chosen for data processing. Data are presented inFig. 5. The peak values of H/V ratio range between 2.2 and 21.96. Eight sites (over a total of 38) were discarded after treatment, either because they yield no well-defined peak or because the geometry of the peak did not fulfil the SESAME criteria (width and height). The frequencies obtained vary between 2 and 32 Hz. Most data are below 5 Hz (44%) or between 13 and 24 Hz (48%), with a single site showing a higher frequency. The period of the day during which measurements are taken may affect the results due anthropogenic seismic noise (Cara et al., 2010). Two points were measured at night (S5N and S4N) in order to control the validity of peaks measured during the day. S4N is located in the same place as S3P2, which was measured during the day. The obtained frequencies are very close: 2.90 and 2.92 Hz, respectively.
S4N is close to the CAS drilling, and allowed determination of the velocity of the surface layer. At this point, the depth of the bedrock (h) is 50 m and frequency f0is 2.90 Hz. The velocity (Vs) is deduced with
the following formula: f0= Vs/ (4∗ h). So, the calculated velocity Vs
is 581 m/s. This value is in accordance with the known velocities of wave propagation in clays (Bièvre et al., 2011). Using this calibration point, the depth of substratum can be computed for the other measure-ment points. It ranges between 4.5 and 73 m. The two frequency groups mentioned above correspond to depths over 29 m and in the 6–11 m range, respectively. The deep group is concentrated in the central and SW part, whilst the shallow group is concentrated in the NE and periphery of the map.
5. Discussion
5.1. Geomorphology of the polje
The aim of the study was to delineate the morphology of a buried karstic structure and understand the mechanisms of its formation and connection with a submarine karst network. Comparing the results from three geophysical methods based on different properties improves the interpretation of the data. None of the three methods used alone can clearly determine the boundaries between the three formations present: Quaternary sediments, limestones and Cretaceous marl bedrock. Due to similar electrical resistivities, marl and clay are not distinguished on ERT profiles. Gravimetric study does not differentiate between marl and limestone because of similar densities. The H/V
method, like gravimetry, gives the depth of bedrock and lacustrine sediment boundary. The area covered by the ERT survey is smaller than that covered by gravimetric survey and H/V methods, but the comparison of the results shows that the three methods give coherent results. The results of the ERT profiles and Bouguer anomaly map over-lap well, qualitatively (Fig. 6). However, the ERT depth is usually greater than the modelled depth from gravimetry, especially towards the NE. This may be attributed to marls and suggests that the thickness of marl increases towards NE, moving away from the fault. Furthermore, it is possible to interpolate the theoretical depth of the surface contact between marl and limestone, not taking into account karstic structures. With the hypothesis of a clear interface between marl and limestone and a dip of ~ 8/10°E (Fig. 3), the depth of marl/limestone boundary obtained is about 45–57 m below the ground surface within the polje area (at drilling CAS).
In the southwest, the data from the three methods agree well within uncertainties. All H/V-derived depths greater than 30 m are concentrat-ed in the deeper area indicatconcentrat-ed by gravimetry, with the largest values fitting well with the gravity minimum. The only discrepancy concerns a H/V depth of 9 m determined on the CAS14 profile whilst gravity and ERT indicate a deep interface. This may be due to the presence of a discontinuity within the Quaternary sequence or unsuitable H/V spectra.
Geophysical observations can be used to determine the general shape of the bedrock of the paleolake, and so to give an estimation of the volume of sediment required tofill the polje. Based upon gravimet-ric modelling, the shape of the polje can be approximated using simple geometric forms: 1) a narrow vertical structure, representing a collapsed sinkhole or any alternative way to connect the surface to the karstic network at sea level within the massive limestone; and 2) a larger volume, representing the extension of the paleolake related to the erosion of marl through the sinkhole. The general shape of the karst-ic structure is a similar to a large funnel (Fig. 8), deeper at the centre than at the edges (Fig. 6) andfilled by lacustrine sediments. The polje di-mensions are about 340 m long, 300 m wide and 40 m average depth. Using these dimensions the volume of sedimentfilling the polje is about 4 × 10⁶m3(neglecting the central sinkhole volume). Although this simplified calculation minimizes the complexity of the structure of karst depression, it should provide a correct order of magnitude.
Moreover, geophysical studies and sedimentary observations give information about paleolake water depth. Lacustrine sediments contain abundant Cretaceous microfossils but are very poor in Quaternary
Table 2
Radiocarbon and26Al/10Be dating (a), and OSL dating (b) results of Cassis paleolake core.
(a)
ID laboratory ID sample Type Depth min (m) Depth max (m) Radiocarbon age BP (ky)
SacA 25909 RC8 Coal 8.22 8.22 N50
SacA 25910 RC14 Coal 14.30 14.30 N50
SacA 25911 RC18 Coal 18.40 18.40 N50
Poz-40304 RC23 Wood 23.25 23.25 48 ± 3
Poz-40303 RC49 Coal 49.50 49.50 N51
ID laboratory ID sample Type Depth min (m) Depth max (m) 26
Al/10 Be age (My) FB36_R COS46 Quartz 46.30 46.70 2.9 ± 0.3 (b) ID laboratory ID sample Depth min (m) Depth max (m) K (%) Th (ppm) U (ppm) Water content (%) External dose rate (Gy/ky)
Total dose rate (Gy/ky) Equivalent dose De (Gy) Age (ky) X5375 OSL34 34.00 34.08 0.73 7.0 2.0 27 0.50 ± 0.05 1.18 ± 0.07 380.7 ± 25.2 321 ± 29 X5376 OSL41 41.40 41.50 0.73 6.6 1.9 27 0.51 ± 0.05 1.17 ± 0.07 411.4 ± 34.3 353 ± 37 X5297 OSL47 47.03 47.09 0.73 5.9 1.8 27 0.56 ± 0.06 1.19 ± 0.08 249.9 ± 19.0 209 ± 21
The location and comments of dated samples are shown onFig. 2. Concerning OSL dating, radioisotope measurements (K, Th, U) were made on dried, homogenised and powdered material by ICP-MS/AES with an assigned systematic uncertainty of ±5%. Dry beta and gamma dose rates calculated from these activities were adjusted for the measuredfield water content (27%) expressed as a percentage of the dry mass of the sample. The external gamma dose rate was derived from the concentrations of radioisotopes within the overlying and underlying clayey sedimentary units which bracket the sandy layers where the OSL samples were collected. An inflated systematic error of 10% was attached to the external dose rate calculations.
organisms such as ostracods or diatoms. There are no traces of bioturba-tion (except one at 11 m). The lack of diatoms, which are very common in lacustrine sediments, is due to the carbonate-rich nature of the sediment (e.g.Lamb et al., 2007). The grey colour of the sediment is characteristic of anoxic sediment, rich in sulphides (van Geen et al., 2003). The sediment lamination also indicates the lack of currents (e.g. waves-induced currents) which would homogenise the sedimen-tary deposits and oxygenate the water column, and is concordant with sediment anoxia. The sedimentology thus indicates a deep depositional environment (e.g.Tudryn et al., in press). Based on the near-surface presence of lacustrine sediment in all coring points, the surface of the paleolake was once at a present altitude of at least 90 m a.s.l (altitude of lacustrine sediment cored in the most northward point), thus constraining the altitude of the paleo-outlet.
5.2. Sedimentary record chronology
Samples for radiocarbon dating obtained from the lacustrine sedi-ments (Table 2a) are all beyond the limit of the technique, about 49 ky (Donahue, 1995). One sample (RC23 at 23.13 m depth) provides a date of 48 ± 3 ky which could be due to minor, more recent14C
con-tamination. Therefore, the entire period of lacustrine sedimentation, and moreover karstic structure formation, can reasonably be assumed to be older than 50 ky. Continuous paleomagnetic investigations (Romey, 2013) reveals normal polarity throughout the sequence, indicating a Brunhes age (b780 ka) without any record of geomagnetic excursion. Three OSL dates obtained from 34.04, 41.45 and 48.40 m depth provided age estimates of 321 ± 29 ky (MIS 9–10), 353 ± 37 ky (MIS 9–10) and 209 ± 21 ky (MIS 6–7), respectively (Table 2b). Optical dating is used to determine burial ages of sediments that were exposed to sunlight prior to deposition. However, OSL dates can be bi-ased by many factors (Bradley, 1999) and one of the main limitations is the possibility of insufficient resetting of the luminescence signal. Partially bleached sediment may contain a mixture of grains carrying different levels of residual signals, and this can lead to an age overesti-mation (Böse et al., 2012). In this study, the small size of the watershed (~8 km2) would imply a short transport time which could reduce the
likelihood of a full resetting of the quartz OSL signal at deposition. The associated low26Al/10Be ratio (1.58 ± 0.26) measured in a sample of
quartz from a depth of 46 m suggests a minimum burial age of 2.9 My, which is inconsistent with other data within the core. This implies that the quartz grains have been buried in a Tertiary layer, rapidly erod-ed and rerod-edepositerod-ed in the lake, i.e. without enough time to reset the cos-mogenic nuclides clock. Thesefindings point towards a more complex depositional scenario, involving multiple surface exposures and burial sequences. The OSL dates are likely to represent age overestimates
(hypothesis supported by catchment area dimension, overestimation of26Al/10Be dating and no stratigraphic order of the OSL ages) but
when considered in combination with the14C dating suggest that
lacus-trine sedimentation is likely to have taken place between 50 (lower limit of14C dating) and 350 ky (upper limit of OSL dating).
Concerning pollen analysis (Fig. 7), the presence of Artemisia (up to 28.5%), other steppic herbs, pioneer shrubs and the dominance of Pinus (up to 80%) in the pollen assemblages are typical of glacial and late-glacial vegetation from the Upper to Middle Pleistocene periods in Western Provence (Triat-Laval, 1978). No Tertiary exotic taxa were observed in pollen slides. As the extinction of those taxa dates to the end of MIS 11 in Western Europe, the lacustrine infilling of Cassis is younger than MIS 11 (ca 400 ka) and dates from Middle to Upper Pleistocene.
The different elements of dating indicate an age (1) greater than 50 ky, (2) less than 400 ky, and (3) from a cold period. Moreover, due to the sedimentary homogeneity with the absence of discontinuities, lacus-trine sediments probably correspond to a unique continuous cold peri-od. The intersection of these data can highlight the corresponding periods. MIS 6 (~ 130 to 190 ky), MIS 8 (~ 244 to 301 ky) and MIS 10 (~ 334 to 364 ky) can match these criteria (Bassinot et al., 1994; Lisiecki and Raymo, 2005). Therefore, the sedimentary sequence of Cas-sis would represent a maximum period of deposition representing circa 30 to 60 ky.
Moreover, the analysis of calcareous nanofossils (Table 3) shows three main ages for the sediment source: Cenomanian (~ 93–99 My), Aptian (~ 112–125 My) and Valanginian–Hauterivian (130–140 My), with a dominant contribution of the Aptian. So the carbonate sedimen-tation is mostly the result of the erosion of Aptian marl coming from the eastern part of the catchment area. However, Aptian marls may not have supplied the sandy levels. The presence of Cenomanian fossils could confirm that sandy levels come from the erosion of the Cenomanian lithologies located to the east of the study area. The out-crop area of Aptian marls in the catchment area is about ~ 4 km2
(Fig. 1) and the volume of the lacustrine sediment is about 4 × 10⁶ m3. So one needs to erode on average about 1 m of Aptian marls to
totallyfill the karst depression (assuming total deposition of eroded material).
The maximum duration of sedimentation suggested here (30 to 60 ky) would provide minimum denudation rates ranging from 17 to 33 m/My. A comparable denudation rate of 37 m/My was obtained on the nearby Cap Canaille cliff summit, which shares the same climate and slope as the catchment area (Braucher et al., 2011). Cap Canaille lithology being a hard conglomerate, one may expect a greater denuda-tion rate in the Aptian marls, i.e. a sedimentadenuda-tion duradenuda-tion below 30 ky. This also agrees with studies in mountainous areas that showed that it is
Table 3
Distribution of calcareous nanofossils in the sedimentary records from the paleolake of Cassis (CAS, n = 5) and the underground river Bestouan (BST, n = 3).
Sample Index species Known range Inferred probable age Associated species Remarks
CAS Braarudosphaera africana Albian–Cenomanian Cenomanian N. bonetii, N. bucherii, N. circularis, N. elongatus, N. globulus, N. Kamptneri minor, M. obtusus, B. constans, C. striatus, C. cuvillieri, D. Lehmani, D. rotatorius, E. turriseiffelli, F. oblongus, M. pemmatoidea, R. angustus, R. asper, S. crux, various species of Watznaueria, various species of Zeugrhabdotus
Dominant contribution of Aptian–Albian sediments Braarudosphaera bigelowii Cenomanian–present
Nannoconus truittii Late Aptien–Campanian Aptian–Albian N. quadriangulus Late Aptien–Albien
Litrhaphidites carniolensis Late Berriasian–Maastrichtian
Eiffellithus striatus Late Valanginian–Late Hauterivian Valanginian–Hauterivian Calcicalathina oblongata Early Valanginian–Early
Barremian
Tubodiscus verenae Late Berriasian–Late Hauterivian BST 2
(P1)
Kokia curvata Valanginian Valanginian L. carniolensis, B. constans, various species of Watznaueria, various species of Zeugrhabdotus
dominant contribution of upper Cretaceous sediments Eprolithus octopetalus Turonian Turonian
Biscutum magnum? Santonian–Maastrichtian ? Santonian–Maastrichtian BST 4
(P2)
Prediscosphaera ponticula Albian–Maastricthian Cenomanian–Maastricthian C. conicus, R. infinitus, various species of Watznaueria
Watznaueria species are quite dominant
BST 6 (P4)
– – Early Cretaceous +
?Callovian–Oxfordian
R. asper, S. crux, Z. embergeri, various species of Watznaueria, various species of Zeugrhabdotus
W. britannica, W. manivitiae, W. ovata are quite dominant The location of samples is shown inFig. 2. 38 species were identified in CAS samples, which show a perfect overlap of species, and 22 species in BST samples. Levels (seeFig. 2), in which BST samples were collected, are shown within brackets.“?” indicates an uncertain identification.
possible to quicklyfill a lake with a marl erosion rate of several mm/year (e.g.Rey, 2003).
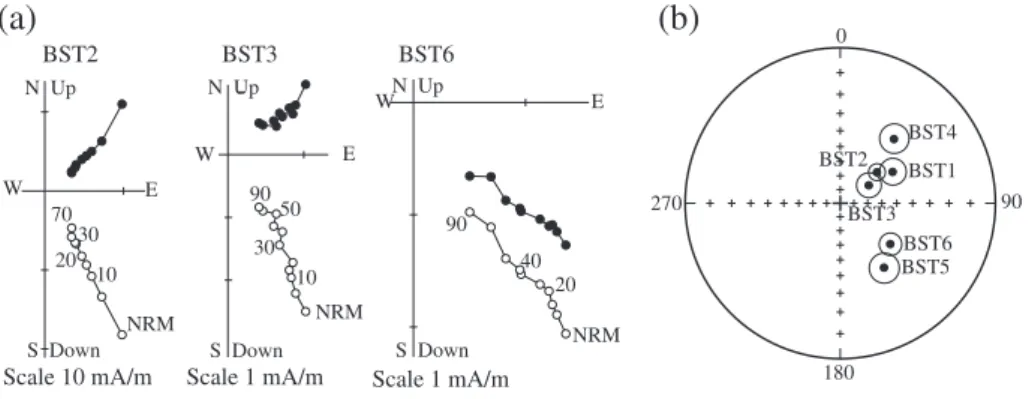
Concerning the BST core, there is no way to obtain chronological constrains, apart from the consistent normal polarity of paleomagnetic signal (Fig. 9), supporting an age younger than 780 ka.
5.3. Polje formation and link to Bestouan river
The paleolake is located above karstified, fractured and faulted lime-stones (Fig. 8b (T0)). This context is very favourable for large cavity formation. The funnel shape of the subsurface karst as inferred from gravity data strongly suggests that the paleolake formation was controlled by two factors: the erosion of marls by surfaceflow and the formation of a karstic cavity in limestones, located at the centre of the depression (Fig. 8b (T1)). The karstic cavity was formed by the dissolu-tion of limestones by waterflow. The progression of ongoing limestone dissolution led to the collapse of the cavity or the creation of a vertical conduit, which created a karstic sinkhole establishing a connection be-tween the surface and the Bestouan conduit (Figs. 1, 8b (T2)). Constant erosion of marls and drainage into the sinkhole with subsequent transport towards the now submerged outlet, combined with the high clay content of marls, caused a gradual clogging of the depression. Connection between surface and underground karstic network was thus interrupted (Fig. 8b (T3)). Once the cavity clogged, the depression created can operate as a lake and gradually befilled by sediments from the catchment (mostly Aptian marls) (Fig. 8b (T4)). The sequence of events described above is in agreement with other results obtained from studies of karstic lakes (e.g.Kindinger et al., 1999; Salvati and Sasowsky, 2002).Kindinger et al. (1999)detailed four progressive developmental stages of karstic lake formation: 1) the collapse of karst (active phase), 2) thefilling of the cavity by sediments and the subsidence of the lake bottom (transitional phase), 3) thefilling of the depression and 4) a phase of sinkhole development, associated with structural features (not observed in Cassis paleolake). Another forma-tion hypothesis may be suggested by the fault located south of the polje. The fault brought into contact compact limestone and imperme-able marls. This preferential drainage area could allow the establish-ment of a sinkhole, as commonly observed in karst area. However, the centre of the depression (Figs. 4, 6) is about 100 m to the north of the fault and thus has no close relationship with the fault. If there had been a karstic sinkhole close to the fault, sediment thickness should be maximal, whilst geophysical measurements give a thickness of about 10 m. Because of this configuration, it is unlikely that the fault is related to the formation of the polje. Even if the fault is not related to the forma-tion of the polje, it could create a preferential drainage area that could have functioned as a minor outlet of the polje. The high homogeneity of sedimentary facies and the absence of unconformities and large
deformation indicate that subsidence effects did not significantly affect the lacustrine sedimentation. The presence in the sedimentary record of a few microfaults (displacement less than a few centimetre) and a significant dip at the base could correspond to differential compaction. Moreover, from 45 to 50 m depth they are layers containing Aptian marls gravel from 10 to 20 cm thickness and abundant charcoals, whereas from 0 to 45 m depth, the core is poor in charcoal and devoid of gravels. The presence of marl pebbles and charcoals may be related to the instability of the slopes of the polje after its formation.
The proximity of this karstic structure, both in depth and location, with the ultimate point explored in the Bestouan submarine river is unlikely to be fortuitous and point towards a connection between the two. The hypothesis that the cavity collapse was recorded in the BST core through the succession of P3 and P2 levels cannot be grounded chronologically. The analysis of calcareous nanofossils found in BST core (Table 3) cannot give a precise age of the sediment eroded. Indeed, the three samples show a wide variety of nanofossils, covering the peri-od from Upper Jurassic to Lower Cretaceous, characteristic of the area. The presence of fossils covering such a wide timescale can be explained by the extensive aquifer drained by the river (Blavoux et al., 2004) and/ or by remobilization of sediment. Clay mineralogy also points towards the fact that BST sediment is a mixture of different sources, with (in par-ticular) chlorite that is not present in the paleolake sediments. However, it is possible to make assumptions about the relationship between the Bestouan river and the polje as well as its consequences on the sedimen-tation of Bestouan. Colour variation of the sediment BST can be related to a change of redox degrees during deposition. The grey colour of P2 layer indicates a reducing environment and is similar to sediment from the paleolake of Cassis, whilst ocher sediments (levels P1, P3 and P4) reflect an oxidizing environment. This change in the redox state of the sediment may be related to a decrease in oxygenation or a change in sediment source. P2 is characterised by a higher organic carbon content and carbonate content than P1, P3 and P4, indicative of rapid deposition of marl erosion products (Table 2). The layer of homoge-neous sediments P4 could correspond to a sedimentary phase prior to the polje formation, withfine and homogeneous contributions coming from the erosion of karst aquifer drained by the Bestouan river. The layer rich in coarse elements P3 could be related to a collapse within the Bestouan drainage. For grey level P2, sedimentation in the Bestouan river could just precede lacustrine sedimentation. In this period, sedi-ment coming from Aptian erosion, would go from the polje catchsedi-ment area to the underground river through the karst sinkhole. The ocher sedimentation P1 could indicate clogging of the sinkhole by clay and the separation of the two systems (lake and underground river).
Cavalera (2007)studied a core BE1 coming from Bestouan river and taken at 100 m from the resurgence, i.e. about 50 m upstream core BST. BE1 sedimentation is composed of two layers A and B, which could
(b)
BST1 BST4 BST2 BST3 BST6 BST5 90 0 180 270(a)
BST6 Scale 1 mA/m N Up W E S Down NRM 90 20 40 BST3 Scale 1 mA/m N Up S Down W E NRM 90 50 10 30 BST2 Scale 10 mA/m N Up S Down W E NRM 10 70 30 20Fig. 9. Bestouan magnetic data. Orthogonal projection plots (a) of stepwise alternatingfield (AF) demagnetization data of Bestouan samples (location of samples is shown inFig. 2). Open and solid symbols represent projections on two perpendicular planes whose intersection is the horizontal axis. The samples show a stable vertical component above 10–20 mT, converging to the origin. AF demagnetization steps are given in mT. NRM means Natural Remanent Magnetization. Stereoplot (b) shows a stable inclination for all samples (solid points), ranging from 33° to 65°. Circles indicate MAD (maximum angular deviation) values. The variation in declination (from 45° to 140°) is not significant since the core is not oriented and is likely to have been twisted on the gravel layer.