HAL Id: hal-01594781
https://hal.archives-ouvertes.fr/hal-01594781
Submitted on 2 Jul 2018
HAL is a multi-disciplinary open access
archive for the deposit and dissemination of
sci-entific research documents, whether they are
pub-lished or not. The documents may come from
teaching and research institutions in France or
abroad, or from public or private research centers.
L’archive ouverte pluridisciplinaire HAL, est
destinée au dépôt et à la diffusion de documents
scientifiques de niveau recherche, publiés ou non,
émanant des établissements d’enseignement et de
recherche français ou étrangers, des laboratoires
publics ou privés.
Analysis (MLVA) Scheme for Fine-Scale Monitoring and
Microevolution-Related Study of Ralstonia
pseudosolanacearum Phylotype I Populations
Jérémy Guinard, Anne Latreille, Fabien Guérin, Stéphane Poussier,
Emmanuel Wicker
To cite this version:
Jérémy Guinard, Anne Latreille, Fabien Guérin, Stéphane Poussier, Emmanuel Wicker. New
Mul-tilocus Variable-Number Tandem-Repeat Analysis (MLVA) Scheme for Fine-Scale Monitoring and
Microevolution-Related Study of Ralstonia pseudosolanacearum Phylotype I Populations. Applied and
Environmental Microbiology, American Society for Microbiology, 2017, 85 (4),
�10.1128/AEM.03095-16�. �hal-01594781�
New Multilocus Variable-Number
Tandem-Repeat Analysis (MLVA) Scheme
for Fine-Scale Monitoring and
Microevolution-Related Study of
Ralstonia pseudosolanacearum Phylotype
I Populations
Jérémy Guinard,
a,bAnne Latreille,
b* Fabien Guérin,
aStéphane Poussier,
aEmmanuel Wicker
b*
Université de la Réunion, UMR 53 Peuplements Végétaux et Bioagresseurs en Milieu Tropical (PVBMT), Saint Denis, Réunion, Francea; CIRAD, UMR 53 Peuplements Végétaux et Bioagresseurs en Milieu Tropical (PVBMT),
Pôle de Protection des Plantes, Saint Pierre, Réunion, Franceb
ABSTRACT
Bacterial wilt caused by the Ralstonia solanacearum species complex
(RSSC) is considered one of the most harmful plant diseases in the world. Special
at-tention should be paid to R. pseudosolanacearum phylotype I due to its large host
range, its worldwide distribution, and its high evolutionary potential. So far, the
mo-lecular epidemiology and population genetics of this bacterium are poorly
under-stood. Until now, the genetic structure of the RSSC has been analyzed on the
world-wide and regional scales. Emerging questions regarding evolutionary forces in RSSC
adaptation to hosts now require genetic markers that are able to monitor RSSC field
populations. In this study, we aimed to evaluate the multilocus variable-number
tandem-repeat analysis (MLVA) approach for its ability to discriminate genetically
close phylotype I strains and for population genetics studies. We developed a new
MLVA scheme (MLVA-7) allowing us to genotype 580 R. pseudosolanacearum
phylo-type I strains extracted from susceptible and resistant hosts and from different
habi-tats (stem, soil, and rhizosphere). Based on specificity, polymorphism, and the
ampli-fication success rate, we selected seven fast-evolving variable-number tandem-repeat
(VNTR) markers. The newly developed MLVA-7 scheme showed higher discriminatory
power than the previously published MLVA-13 scheme when applied to collections
sampled from the same location on different dates and to collections from different
locations on very small scales. Our study provides a valuable tool for fine-scale
mon-itoring and microevolution-related study of R. pseudosolanacearum phylotype I
pop-ulations.
IMPORTANCE
Understanding the evolutionary dynamics of adaptation of plant
patho-gens to new hosts or ecological niches has become a key point for the
develop-ment of innovative disease managedevelop-ment strategies, including durable resistance.
Whereas the molecular mechanisms underlying virulence or pathogenicity changes
have been studied thoroughly, the population genetics of plant pathogen
adapta-tion remains an open, unexplored field, especially for plant-pathogenic bacteria.
MLVA has become increasingly popular for epidemiosurveillance and molecular
epidemiology studies of plant pathogens. However, this method has been used
mostly for genotyping and identification on a regional or global scale. In this
study, we developed a new MLVA scheme, targeting phylotype I of the soilborne
Ralstonia solanacearum species complex (RSSC), specifically to address the
bacte-rial population genetics on the field scale. Such a MLVA scheme, based on
fast-Received 14 November 2016 Accepted 13
December 2016
Accepted manuscript posted online 21
December 2016
Citation Guinard J, Latreille A, Guérin F,
Poussier S, Wicker E. 2017. New multilocus variable-number tandem-repeat analysis (MLVA) scheme for fine-scale monitoring and microevolution-related study of Ralstonia
pseudosolanacearum phylotype I populations.
Appl Environ Microbiol 83:e03095-16.https://
doi.org/10.1128/AEM.03095-16.
Editor Harold L. Drake, University of Bayreuth Copyright © 2017 American Society for
Microbiology.All Rights Reserved.
Address correspondence to Emmanuel Wicker, wicker@cirad.fr.
*Present address: Anne Latreille, INRA, URFM-UR629 Unité de Recherche Écologie des Forêts Méditerranéennes, Site Agroparc, Domaine Saint Paul, Avignon, France; Emmanuel Wicker, CIRAD, UMR Interactions
Plantes-Microorganismes-Environnement, Montpellier, France.
crossm
on July 2, 2018 by guest
http://aem.asm.org/
Downloaded from
evolving loci, may be a tool of choice for field experimental evolution and
spa-tial genetics studies.
KEYWORDS
VNTR, microevolution, epidemiosurveillance, molecular epidemiology,
population biology, bacterial wilt
I
ntensification of agriculture during the 20th century led to global changes in
crop-ping practices and to intensification of rapid and large-scale exchanges. Thus, it
increased risks for food security by contributing to significant changes in plant
patho-gen populations, such as emerpatho-gence and/or reemerpatho-gence of pathopatho-gens and selection
of virulent pathogen populations (1). Among the different strategies to control plant
pathogens, deploying resistant plant varieties appears to be the most promising
solution (2). The implementation of efficient and durable disease management
strate-gies requires deciphering of the ecological and genetic mechanisms that lead to the
adaptation of a pathogen population to a new host or a new resistant cultivar (3).
Thorough investigation of these mechanisms on the field scale requires the use of
efficient ad hoc molecular markers.
To date, several markers have been developed through the use of DNA
fingerprint-ing methods (restriction fragment length polymorphism [RFLP], amplified fragment
length polymorphism [AFLP], and random amplified polymorphic DNA [RAPD] analyses)
and housekeeping gene sequencing (multilocus sequence typing [MLST] and
multilo-cus sequence analysis [MLSA]). Nevertheless, variable-number tandem-repeat (VNTR)
markers, with their fast molecular clock (4), remain the most suitable tool for molecular
epidemiology studies (5). VNTR are tandem repeats of sequences ranging from 5 to 100
bp; they have been used more and more for genotyping due to their portability
between different laboratories, their reproducibility, and their high level of
polymor-phism on monomorphic bacteria (6). Multilocus VNTR analysis (MLVA) has been used
widely in the medical field, especially to monitor epidemics of monomorphic bacteria,
such as Bacillus anthracis (7), Yersinia pestis (8, 9), Mycobacterium tuberculosis (10, 11),
Burkholderia pseudomallei (12, 13), and methicillin-resistant Staphylococcus aureus (14),
and to assess their evolutionary history on different time and space scales (15, 16).
Although there is a growing interest in the use of MLVA on plant-associated bacteria,
only a few studies have been published, focusing on their population biology. These
studies aimed at tracing sources of water contamination (Ralstonia solanacearum [17]),
assessing the host-driven pathogen population structure (Pseudomonas syringae pv.
maculicola and P. syringae pv. tomato [18], Xanthomonas axonopodis pv. manihotis [19],
and R. solanacearum [20]), reconstructing the emergence history (Xanthomonas citri pv.
citri [21–23]), evaluating the structure and evolution of pathogen populations (X. citri
pv. citri [22] and Erwinia amylovora [24]), and global surveillance (Xanthomonas oryzae
pv. oryzae and X. oryzae pv. oryzicola [25]). Studies investigating population structure
on a small geographical scale have seldom been realized for plant-associated bacteria
or for plant-associated oomycetes and fungi (22, 26–28).
Bacterial wilt caused by the R. solanacearum species complex (RSSC) (29, 30), a
soilborne proteobacterium, is one of the most economically important bacterial plant
diseases worldwide (31), mainly due to its wide geographical distribution and its large
host range (250 host species in 54 botanical families [32]). The RSSC is considered a
rather primitive vascular plant pathogen (33) and is composed of four phylotypes that
correlate with their geographical origins (29). These phylotypes display specific
evolu-tionary dynamics as estimated by their recombination rates and demographic histories
(34). A splitting of the RSSC was proposed recently, reclassifying (i) phylotypes I and III
into Ralstonia pseudosolanacearum, (ii) phylotype II into R. solanacearum, and (iii)
phylotype IV into Ralstonia syzygii (35). The R. pseudosolanacearum phylotype I
popu-lation structure presents molecular signatures of a recent and rapid demographic
expansion (34), suggesting a high dissemination capacity. Moreover, phylotype I is
highly recombinogenic (34, 36) and distributed worldwide (32), affects the largest
number of hosts (37, 38), and contains all six pathoprofiles as described by Lebeau et
on July 2, 2018 by guest
http://aem.asm.org/
al. (virulence patterns on a core collection of tomato, eggplant, and pepper plants
[39–41]). Altogether, these features clearly indicate that phylotype I possesses a high
evolutionary potential sensu McDonald and Linde (42). This phylotype is thus an
interesting model for studying the evolutionary dynamics of plant-bacterium
interac-tions. Although the molecular basis of its interactions with plants and the variability of
its genome have been investigated widely (43–49), the population genetics and
dynamics of this fascinating plant pathogen remain poorly understood and considered.
Until now, only two studies have addressed the population genetic structure on a local
scale. The first one was conducted in India by using RAPD markers (50), and the second
was performed on Trinidad Island by using repetitive sequence-based PCR (REP-PCR)
(51). Unfortunately, the low repeatability and reproducibility with RAPD markers make
the results difficult to interpret, and REP-PCR portability between laboratories remains
problematic (6). To date, three MLVA schemes have already been developed, to
decipher RSSC population genetics on different scales (41), to investigate sources of
water contamination by Ralstonia solanacearum (phylotype IIB) (17), and to characterize
African R. pseudosolanacearum phylotype III strains on local and global scales (52). The
MLVA phylotype I-specific scheme of N=Guessan et al. (20) (13 loci; MLVA-13) and the
MLVA phylotype III-specific scheme of Ravelomanantsoa et al. (52) gave promising
results in discriminating populations on scales ranging from cropping areas to
conti-nents (41).
In the present study, we first evaluated the MLVA-13 scheme for its discriminatory
power on strains from the same field. Given that this scheme was poorly polymorphic
on the field scale, we developed a new MLVA phylotype I-specific scheme and tested
its use for conducting population genetics and microevolution studies on the field
scale. More specifically, our objectives were (i) to identify new VNTR loci displaying
potentially higher allelic diversity within phylotype I and III genomes, (ii) to evaluate
their discriminatory power on collections sampled from the same location at different
dates and collections sampled from different locations but on very small scales (single
bulk soils and different plant locations), and (iii) to verify their suitability for assessing
population differentiation and population evolution.
RESULTS
The MLVA-13 scheme is not adapted for analysis of field populations. We first
used the previously developed MLVA-13 scheme (20) on the Vallon 2012 field
collec-tion, composed of 319 strains of R. pseudosolanacearum phylotype I. Within this
collection, egl-mutS typing identified a single haplotype (egl-ST043, mutS-ST022,
se-quevar 31), identical to the sese-quevar 31 strain RUN0471, previously reported from
Réunion Island (41). MLVA-13 identified only three haplotypes, which were most highly
related to the reference haplotype H123, a singleton also corresponding to RUN0471.
Only one locus (RS3L20) was polymorphic, with only three alleles detected. The genetic
diversity detected was too low (Table 1) to properly perform population genetic
analyses, leading us to develop a more discriminative MLVA scheme.
Tandem repeat screening leads to development of a new MLVA scheme
com-posed of seven polymorphic loci (MLVA-7). TR searches using the Tandem Repeats
TABLE 1 Comparison of genetic diversity revealed by the MLVA-13 and MLVA-7 schemesfor descending scales, i.e., worldwide, regional (Ivory Coast), and field (Vallon 2012) scalesb
Phylotype I collection (reference)
MLVA-13 schemea MLVA-7 scheme
n HE No. of haplotypes G/N ratio n HE No. of haplotypes G/N ratio Worldwide (41) 34 0.374 31 0.91 34 0.666 31 0.91 Ivory Coast (41) 18 0.307 15 0.83 18 0.578 17 0.94 Vallon 2012 (this study) 319 0.013 3 0.007 319 0.298 43 0.135
aDescribed in reference 20. bn, number of strains; H
E(or Hub), Nei’s unbiased gene diversity index per locus; G/N ratio, ratio of the number of genotypes to the number of strains. All statistics were calculated with GenAlex v. 6.5.
on July 2, 2018 by guest
http://aem.asm.org/
Database (TRDB) and the Microorganisms Tandem Repeats Database (MTRDB) led us to
select 24 TR loci: 11 localized on the chromosome (four from strain GMI1000, three from
strain Y45, and four from strain CMR15) and 13 localized on the megaplasmid (five from
GMI1000, three from Y45, and five from CMR15). Four of the 11 chromosomal loci were
intergenic, whereas all 13 megaplasmid loci were intergenic. No significant (NS)
differ-ence in polymorphism was observed either between chromosomal and megaplasmid
loci (P
⫽ 1.000) or between intergenic and intragenic loci (P ⫽ 0.625). Prescreening of
these 24 loci on a 19-strain collection subset by high-resolution MetaPhor gel
electro-phoresis revealed only six loci to be polymorphic. These were between 6 and 9 bp long
and repeated 5 to 21 times in the genome of origin (Table 2). We thus combined these
six loci with the RS3L20 locus (from the MLVA-13 scheme) to define the new MLVA
scheme, called MLVA-7. The interexperimental (between plates) variation of fragment
size calling by capillary electrophoresis reached 1 bp when the GeneScan-500 LIZ size
standard was used and allowed unambiguous assignation of alleles. The number of
expected TR (in silico prediction) and the number of observed TR for reference strains
GMI1000 (phylotype I) and CMR15 (phylotype III) were statistically similar to each other
(chi-square test P value
⫽ 0.976 [NS] and 0.988 [NS], respectively).
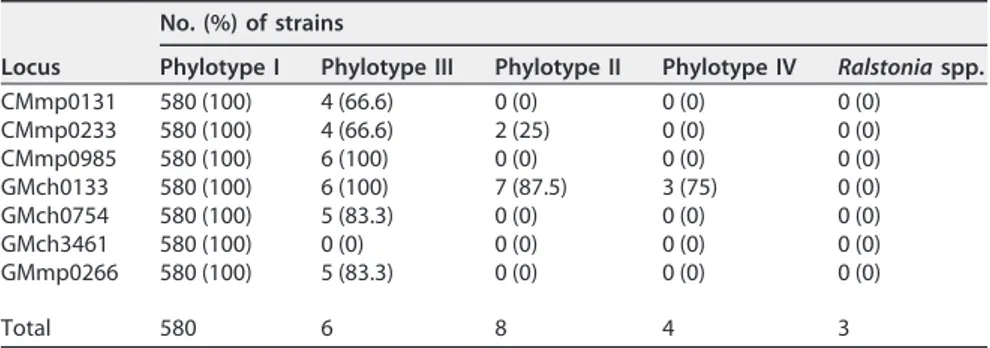
The MLVA-7 scheme is specific to the RSSC and to phylotype I strains. All
MLVA-7 loci were amplified only from RSSC strains, not from the other Ralstonia species
(Ralstonia mannitolilytica, Ralstonia insidiosa, and Ralstonia pickettii) strains, indicating
that they were RSSC specific (Table 3). Amplification of the MLVA-7 loci showed clearly
variable specificity for the different RSSC phylotypes of the worldwide collection. All
seven loci were amplified from all R. pseudosolanacearum phylotype I strains.
GMch3461 was the only phylotype I-specific locus, whereas all six other loci were
amplified from the phylotype III strains, with rates ranging from 66.66% to 100%. The
GMch0133 locus was also amplified from R. solanacearum (phylotype II) and R. syzygii
(phylotype IV) strains (87.5% and 75%, respectively), whereas CMmp0233 was amplified
from 25% of the phylotype II strains (Table 3).
MLVA-7 loci reveal genetic diversity from the field scale to the bulk soil scale.
All MLVA-7 loci showed allelic diversity in field collections, ranging from 2 to 10 alleles
per locus (see Table S2 in the supplemental material). The lowest diversity was found
in the Pirogue 2007 soil sample (Martinique), as expected, with one or two alleles per
TABLE 2 Features of the VNTR loci composing the newly developed MLVA-7 scheme Locus namea Genome of originc Start position Localization Tandem repeat sequence Motif size (bp) VNTR locus size (bp) in the genome of originPrimer sequences (5=-3=) for
amplification of repeat regiond
CMmp0131 CMR15 131842 Intergenic region TGCGGA 6 69 FAM-CCCCGGTGGCTTTGTCATTCCCG and GATCGGGCAGCCGGATACCGC CMmp0233 CMR15 233468 Putative secreted protein Popf1 GCCGGA 6 76 NED-GCCTGCAGTGCCCACTTCAGGTC
and ACCTGCCGTCCGACCTGTTCTTCA GMch0133 GMI1000 133827 Conserved hypothetical protein,
putative 2-nitropropane dioxygenase
TCGCAA 6 41 PET-CATCGACCTGAAGCTGGCGCAGG and TGGACTACAGCGTGATGGTCGGCA
GMch0754 GMI1000 754254 Protein of unknown function or conserved protein of unknown function, proline-alanine-aspartic acid repeated motif
GGATCGGCA 9 142 VIC-GGCTCGTTGGCGGCTTCGATGTT and CGCTGTTCAACGACCTGCCCGAG
GMch3461 GMI1000 3461892 Putative pseudogene (dehydrogenase) protein
AATGGTTG 8 57 FAM-CGAGGTCGCTCTCCAGAAGGCGA and CGAGAAGGCCAGTCCCGAGCTGA GMmp0266 GMI1000 266226 Conserved protein of unknown
function
GAAGCGACC 9 108 NED-CCTGTATCGGCGCCGGAGATTGC and TGTCCTTGCCGAACACATCCGCG CMmp0985
(RS3L20)b
CMR15 985 Putative cobalamin biosynthesis protein (CobN)
CGTGAT 6 128 VIC-GCCGCGCCCAGCTCGCACA and AAGGCGCACCGCCACCCGCA
aLoci were named according to their genome of origin (CM⫽ CMR15; GM ⫽ GMI1000), replicon (mp ⫽ megaplasmid; ch ⫽ chromosome), and physical position on
the replicon.
bThe CMmp0985 locus (RS3L20) was described previously (20) and was used in this study because it was the only polymorphic locus in the Vallon 2012 collection
when the first MLVA scheme (MLVA-13) was used.
cGenomic sequences of the reference strains CMR15 (phylotype III) (43) and GMI1000 (phylotype I) (46) were used.
dForward primers were labeled with the following dyes giving the indicated colors: FAM, blue; NED, yellow/black; PET, red; and VIC, green. The annealing temperature
was 63°C for all primers.
on July 2, 2018 by guest
http://aem.asm.org/
locus (Table S2) and five multilocus haplotypes (Table S3). The highest diversity was
found in the Vallon 2012 field collection (Table 4), with two to nine alleles per locus
(Table S2) and 32 haplotypes (Table S3). Genetic diversity was thus highest in the Vallon
2012 collection, with decreasing levels in the Vallon 2009, Vallon 1999, and Pirogue
2007 collections (Table 4; see also Table S3). However, it is striking that the ratios
between numbers of haplotypes and numbers of strains (G/N ratios) were similar for
the Vallon 2012 and Pirogue 2007 collections (Table 4), despite the huge difference in
sampling efforts.
MLVA-7 is more discriminant than MLVA-13 on both global and field scales. To
compare the discriminatory power between MLVA-13 and the newly developed
MLVA-7 scheme on the global (worldwide), regional (countrywide), and local
(field-wide) scales, we considered the following different subsets of strains: (i) the worldwide
phylotype I collection (n
⫽ 34), among which was defined (ii) a subset composed of
representative phylotype I strains from the Ivory Coast (referred to here as the
“country-scale” collection; n
⫽ 18), and (iii) the Vallon 2012 field collection (n ⫽ 319) (Table 1).
Considering the worldwide collection, the unbiased diversity index for the MLVA-7
scheme was almost 2 times higher than that for MLVA-13, though the G/N ratios were
the same (0.91) (Table 1). Considering the country-scale collection (Ivory Coast strains
[41]), a similar trend was observed, with MLVA-7 revealing a genetic diversity 2 times
higher than that with the MLVA-13 scheme, as well as a higher G/N ratio (0.94 versus
0.83). For the Vallon 2012 field collection, the MLVA-7 scheme revealed a genetic
diversity 23 times higher than that with the MLVA-13 scheme. The G/N ratio followed
the same trend (Table 1).
MLVA-7 is congruent with MLVA-13 on the global scale, giving geographically
relevant clusterings. We evaluated the congruence of both MLVA schemes toward the
worldwide collection of R. pseudosolanacearum phylotype I strains (n
⫽ 34) by using
TABLE 3 Typeability of each MLVA-7 locus in the RSSC and other Ralstonia species, as
estimated by the number (percentage) of strains from which the locus could be amplified within each RSSC phylotype and the Ralstonia outgroupa
Locus
No. (%) of strains
Phylotype I Phylotype III Phylotype II Phylotype IV Ralstonia spp.
CMmp0131 580 (100) 4 (66.6) 0 (0) 0 (0) 0 (0) CMmp0233 580 (100) 4 (66.6) 2 (25) 0 (0) 0 (0) CMmp0985 580 (100) 6 (100) 0 (0) 0 (0) 0 (0) GMch0133 580 (100) 6 (100) 7 (87.5) 3 (75) 0 (0) GMch0754 580 (100) 5 (83.3) 0 (0) 0 (0) 0 (0) GMch3461 580 (100) 0 (0) 0 (0) 0 (0) 0 (0) GMmp0266 580 (100) 5 (83.3) 0 (0) 0 (0) 0 (0) Total 580 6 8 4 3
aThe amplification success rates (in parentheses) were calculated based on the total number of strains per
group (last row).
TABLE 4 Summary statistics for the different collections of R. pseudosolanacearum
phylotype I strains, based on MLVA-7 locia
Collection Host n No. of haplotypes G/N ratio Mean Na I HE Allelic richness Pirogue 2007 (Martinique)
Soil, Musa fallow 38 5 0.132 1.429 0.160 0.101 1.22 Vallon 1999 Solanaceae, Geraniaceae 96 8 0.083 1.860 0.198 0.111 1.28 Vallon 2009 Solanaceae 90 7 0.078 1.714 0.279 0.182 1.48 Vallon 2012 Solanum lycopersicum 319 32 0.100 4.714 0.511 0.298 1.64
an, number of strains; G/N ratio, ratio of the number of genotypes to the number of strains; N
a, number of different alleles; I, Shannon’s information index; HE(or Hub), Nei’s unbiased diversity index. All statistics were calculated with GenAlex v. 6.5.
on July 2, 2018 by guest
http://aem.asm.org/
two approaches: Mantel tests on distance matrices and comparison of clusterings
obtained via discriminant analysis of principal components (DAPC).
Distance matrices (Euclidean and Manhattan distances) were highly correlated, with
respective Mantel correlation coefficients of 0.666 and 0.640 (P
⫽ 0.001 for both
Euclidean and Manhattan matrices), indicating that MLVA-13 and MLVA-7 data were
significantly congruent.
DAPC was performed on the worldwide collection of phylotype I strains (n
⫽ 34)
genotyped by both MLVA-13 and MLVA-7. DAPC clusters were named by giving the
MLVA scheme (“DAPC13.” for data from the MLVA-13 typing scheme and “DAPC7.” for
data from the MLVA-7 scheme) followed by the number of the cluster (cl01 to cl14). In
both DAPC analyses, all strains were assigned to a single cluster (Fig. S1), with one
exception (RUN1533 with MLVA-7). Among the 14 clusters identified in both data sets,
10 DAPC clusters obtained with the MLVA-7 scheme each perfectly matched a single
MLVA-13 cluster (Table 5). DAPC7.03 was split between DAPC13.13 and DAPC13.14,
DAPC7.09 was split between DAPC13.9 and DAPC13.10, and DAPC7.13 was split
between DAPC13.03 and DAPC13.11 (Fig. 1). Strains RUN0044 (Australia), RUN0215 and
RUN0119 (Cameroon), and RUN1533 and RUN1878 (Ivory Coast) were thus ranked
differently by MLVA-13 and MLVA-7 (Fig. S1). We also checked for correspondence
between the clonal complexes (CC) previously identified with MLVA-13 (20) and the
DAPC clusters. Most of the DAPC13 clusters corresponded to a single CC, except for
DAPC13.03, which grouped strains of CC02 and CC05. The correspondence between CC
and DAPC7 clusters was a little lower, since two clusters corresponded to more than
one CC: (i) DAPC7.09 (CC02 and CC10) and (ii) DAPC07.13 (CC02 and CC03). CC02 was
split into three clusters with both MLVA-13 and MLVA-7 (Fig. 1); CC07 and CC10 were
each split into two DAPC7 clusters, whereas CC11 was split into two DAPC13 clusters.
DAPC clusters were globally correlated with geographical origins for both data sets,
even though 4 of 14 clusters gathered strains from two or three countries (Fig. S3).
A DAPC analysis performed on the MLVA-7 data set obtained from the Vallon 2012
(Réunion Island) (n
⫽ 319), Pirogue 2007 (Martinique) (n ⫽ 38), and worldwide (n ⫽ 37)
collections clustered Réunion Island strains into several clusters, together with strains
from different African countries (Fig. 2).
Altogether, these results indicate that MLVA-7 gave clusterings similar to those
obtained with MLVA-13 on the global scale, and the geographical relevancy of these
clusters seemed equivalent between both MLVA schemes. Since several clusters had
mixed origins (Fig. 2), the usefulness of such an MLVA scheme for biogeographic
studies looks questionable.
TABLE 5 Correspondence between clusters identified by DAPC within the MLVA-13 data
set and within the MLVA-7 data seta DAPC13
cluster
No. of strains in DAPC7 cluster
14 2 6 13 10 4 7 1 8 11 9 12 5 3 1 5 2 3 3 2 1 1 4 1 1 5 1 6 2 7 1 8 3 9 1 10 1 2 11 2 12 3 13 2 14 2
aFor MLVA-13, the DAPC clusters are named DAPC13.01 to DAPC13.14; the same notation was used for
MLVA-7 (DAPC7.01 to DAPC7.14). Clusters that match each other are indicated in bold.
on July 2, 2018 by guest
http://aem.asm.org/
The MLVA-7 scheme allows for identification of epidemiological relationships
within and between field collections. The epidemiological relationships between the
78 haplotypes identified within the entire phylotype I collection (Table S3) were
visualized using a minimum spanning tree (Fig. 3). Two clonal complexes were
iden-tified. The main clonal complex (Fig. 2), whose founder (H018) was specific to the Vallon
2012 collection, consisted mostly of Vallon 2012 haplotypes, Vallon 2009 haplotypes,
Vallon 1999 haplotypes, and three worldwide haplotypes: H58 (Ivory Coast), H20 (Ivory
FIG 1 Correspondence between clonal complexes (defined in reference 41) and DAPC clusters inferred by MLVA-13 (right) and MLVA-7 (left). CC, clonal complex;
S, singleton. The figure was created using the table.value function in the R adegenet package (87).
FIG 2 Scatterplot representing DAPC clusters for the Vallon 2012, Pirogue 2007 (Martinique), and
worldwide collections, inferred by use of the MLVA-7 scheme. Réunion Island-specific clusters and the Martinique cluster (box 4) are associated with negative and positive values, respectively, on the x axis. Some clusters are shared across countries, i.e., Ivory Coast and Réunion Island (boxes 2 and 3); Martinique and French Guiana (box 4); Cameroon, Ivory Coast, Réunion Island, and Taiwan (box 7); Cameroon, Ivory Coast, South Africa, and Réunion Island (box 8); and Cameroon, French Guiana, Ivory Coast, Réunion Island, and South Africa (box 9). Numbers on axes indicate respective inertia rates. The figure was created using the find.cluster and scatterplot functions in the R package adegenet (87).
on July 2, 2018 by guest
http://aem.asm.org/
Coast and Vallon 2012), and H21 (Kenya/Ivory Coast). The other small clonal complex
gathered all five Pirogue collection-specific haplotypes (Martinique) (shown in red in
Fig. 3) and two haplotypes (H035 and H039) that were specific to French Guiana.
Double- and triple-haplotype clonal complexes and singletons were mostly composed
of worldwide haplotypes, as well as six Vallon 2012 haplotypes and one Vallon 2009
haplotype.
The MLVA-7 scheme allows monitoring of the temporal evolution and genetic
structure of a field population (“Vallon” collections). To investigate the temporal
evolution of the genetic diversity and structure of a field population, we considered the
three “Vallon” collections only. Ten DAPC clusters were inferred, among which two (cl07
and cl08) were common to all three collections (“universal” clusters) and six (cl01, cl02,
cl03, cl04, cl09, and cl010) were specific to the 2012 sampling (Fig. 4). DAPC strongly
differentiated the universal clusters from four of the Vallon 2012-specific clusters (cl01,
cl02, cl04, and cl10) and from cluster 05, composed of Vallon 2009 and Vallon 2012
strains. Interestingly, cluster 05 was first detected within the Vallon 2009 collection and
then increased in size within the Vallon 2012 collection. Since the Vallon 1999 and
Vallon 2009 collections were sampled from plant stems only, we hypothesized that the
Vallon 2012-specific clusters may have been isolated from a specific habitat
(rhizo-FIG 3 Haplotype network built from the MLVA-7 data sets for different collections. The Vallon 1999 collection is represented in blue, the Vallon 2009 collection
is represented in green, the Vallon 2012 collection is represented in black, the Pirogue collection (Martinique) is represented in red, and the worldwide collection is represented in gray. Networks link single-locus variants (SLVs) in blue, double-locus variants (DLVs) in green, and triple-locus variants (TLVs) in red. Labels within circles indicate haplotype numbers. (A) Global view. (B) Detailed view of clonal complex 01 (CC01). The founder of CC01 is circled in yellow (H18), whereas the founders of subgroups within CC are circled in light green. This figure was built using the goeBURST algorithm implemented in PHYLOViZ 1.1.
on July 2, 2018 by guest
http://aem.asm.org/
sphere or soil). However, there was no correlation between DAPC clusters and the
habitat of isolation (data not shown).
MLVA-7 allows inference of the reproductive mode of R. pseudosolanacearum
phylotype I within field collections as estimated by multilocus LD. The Pirogue
2007 (Martinique) collection, though collected from a very small amount of soil,
displayed a significant linkage disequilibrium (LD), suggesting a clonal reproductive
mode (Table 6). For the Réunion Island “Vallon” collections, the results contrasted: the
Vallon 1999 collection appeared to be nearly recombining, while the Vallon 2009 and
Vallon 2012 collections appeared to be highly clonal.
Estimation of a TR locus mutation model. In order to estimate the mutation
model followed by our molecular markers, we looked at the locus variation along the
haplotype network of the minimum spanning tree, specifically into the TR number
variation across single-locus variants (SLV) (Fig. 3). Three loci (GMch0133, GMch3461,
and RS3L20) clearly followed the stepwise mutation model (more than 80% of
⫺1/⫹1
TR variation), while CMmp0131 gave a majority (55.6%) of single-TR variants (STRV) but
also 44.44% 2-TR variants. Two other loci gave a majority of STRV, but at much lower
rates. GMch0754 indeed gave 40% STRV, but it also gave 2-, 5-, and 6-TR variants, at a
rate of 20% each. GMmp0266 gave 26.09% STRV, as well as 2-TR (8.70%), 4-TR (13.04%),
5-TR (13.04%), and 7-, 8-, 9-, 10-, and 15-TR variants (at rates of 4.35, 8.70, 4.35, 17.39,
and 4.35%). Finally, the CMmp0233 locus gave only 3- and 4-TR variants (50% for both).
DISCUSSION
The proposed new MLVA scheme is the fourth one developed for the RSSC, after the
initial work of N=Guessan et al. (including the phylotype I-specific MLVA-13 scheme)
(20), the phylotype IIB-1-specific scheme of Parkinson et al. (17), and the phylotype
III-specific scheme of Ravelomanantsoa et al. (52). These three schemes, used on
regional scales, allowed the inference of possible dissemination routes of phylotype I
FIG 4 DAPC clusters and plot inferred for the “Vallon” collections. Strains in the Vallon 1999 (n⫽ 96), Vallon 2009 (n ⫽ 90),
and Vallon 2012 (n⫽ 319) collections were genotyped using the MLVA-7 scheme (left), and their distribution within the three collections was determined using the table.value tool (right). Among the 10 clusters, five (cl01, cl02, cl07, cl08, and cl09) are specific to the Vallon 2012 collection, whereas three (cl03, cl04, and cl10) are common to all three collections. Numbers on axes indicate respective inertia rates. The figure was obtained using the find.cluster, scatterplot, and table.value functions in the R package adegenet (89). Inf, DAPC clusters inferred from the data set mentioned.
TABLE 6 Estimates of multilocus linkage disequilibriumb
Collection IAvalue P valuea rdvalue P valuea
Pirogue 2007 (Martinique) 0.301 0.014* 0.172 0.014* Vallon 1999 0.193 0.024* 0.061 0.033* Vallon 2009 1.179 0.001*** 0.437 0.001*** Vallon 2012 1.252 0.005*** 0.283 0.005***
aP values were estimated from 999 randomized permutations by using the parametric bootstrap method.
Randomly permuted data sets were obtained using the “permutation over alleles” method.*, significant; ***, very highly significant.
bEstimation was realized on field populations within the “Vallon” collections and the Martinique collection
(Fig. 3).
on July 2, 2018 by guest
http://aem.asm.org/
within the Ivory Coast and Africa (41), addressed the global surveillance of phylotype
III (52), and identified sources of contamination of the Thames by phylotype IIB-1 (17).
These studies improved the comprehension of RSSC epidemiology, its spread, its
structuration on different scales, and its colonization pattern. However, all these studies
focused only on large scales and did not pay particular attention to how microevolution
acted on the field scale. Until now, field-scale studies focusing on RSSC genetic diversity
were achieved only with markers with poor interlaboratory portability (RAPD [50],
REP-PCR [51, 53], and AFLP [54, 55]).
In this study, we decided to develop a new MLVA scheme, as VNTR loci have already
proved their use in field-scale microevolution studies of plant-pathogenic bacterial
epidemics, e.g., for local populations of Xanthomonas citri pv. citri from different citrus
orchards in Vietnam (22, 27) and in Mali and Burkina Faso (23) as well as local
populations of X. oryzae pv. oryzae and X. oryzae pv. oryzicola (25).
Our primary goal in developing this new MLVA scheme was to differentiate
genet-ically closely related strains of R. pseudosolanacearum phylotype I from a unique field,
and even from a unique bulk soil. We indeed demonstrated that the first phylotype
I-specific MLVA-13 scheme (20) was not powerful enough on the field scale, with only
one polymorphic locus (CMmp0985; also named RS3L20). We thus identified six new,
polymorphic, fast-evolving loci of 6 to 9 nucleotides that were repeated 7 to 22 times
in the genomes of origin, thus matching the rules previously enounced for fast-evolving
loci (20). The search for loci that were both potentially fast evolving and polymorphic
had a relatively low success rate, since only six loci were retained among 24 selected.
Our VNTR loci were specifically present in RSSC genomes and were even specific to
phylotype I as well as phylotype III, to a lesser extent. These findings, which confirmed
earlier reports (17, 20), tend to support the proposed concept of three genomic species
within the RSSC: the first (R. pseudosolanacearum) gathering phylotypes I and III, the
second (R. solanacearum) corresponding to phylotype II, and the third (R. syzygii)
corresponding to phylotype IV (35, 43, 56, 57).
Our second goal was to assess the discriminatory power of the newly developed
MLVA scheme on the field scale. The new MLVA-7 scheme is clearly adapted to
monitoring the evolution of strains sampled from the same location at different dates
and from different fields on very small scales (either from single bulk soils or from
different plant locations). On the field scale, the discriminatory power of MLVA-7 is
much higher than that of MLVA-13 (20). Genetic diversity could be revealed on a scale
as small as a single soil sample (5 g) collected in a banana fallow in Martinique; this
point may open research prospects for study of bacterial microevolution in soil habitats.
The MLVA-7 scheme is also discriminant enough to reveal evolutionary patterns of a
bacterial population sampled from the same field at different dates (“Vallon”
collec-tions). Interestingly, our markers could distinguish between haplotypes prevalent over
14-year and 4-year periods (from 1999 to 2012 and from 2009 to 2012, respectively) and
haplotypes specific to one or another sampling date. This point also paves the way for
future experimental evolution assays performed on the field scale.
The third goal of this study was to evaluate the suitability of our markers for
assessing population genetics and evolution studies. We demonstrated that clustering
inferred by use of MLVA-7 on a worldwide collection of isolates was globally congruent
with clustering inferred from the previously published MLVA-13 scheme (20). MLVA-7
loci also identified the specificity of African phylotype I populations toward Asian ones
and the close relatedness between some Réunion Island strains and some Ivorian
strains, previously established by multilocus sequence analysis (C. A. N=Guessan and E.
Wicker, unpublished data). The geographical coherence of our markers was good, as we
did not identify common allelic profiles between field collections and the worldwide
collection (with one exception), though we realize that these markers are of limited
value for biogeographic studies. This geographical coherence looked better than that
of phylotype IIB-1 markers, which identified common allelic profiles in English and
Swedish strains (17). Finally, we demonstrated that these markers could be used to
decipher the evolution of field populations over time, even with different sampling
on July 2, 2018 by guest
http://aem.asm.org/
efforts. We were able to distinguish different clusters in a single field and their
evolution, as previously evoked. We could also address the reproductive mode of R.
pseudosolanacearum phylotype I field populations, distinguishing some nearly
recom-bining populations from more clonal populations. Such evolutionary patterns need to
be investigated further in collections generated by similar sampling efforts and with
complementary approaches, including spatial genetics.
The genetic diversity estimated for our R. pseudosolanacearum phylotype I field
collections (0.101
⬍ H
E⬍ 0.298) appears to be low compared to values reported for
plant-pathogenic bacteria, such as E. amylovora (H
E⫽ 0.50) (24), X. citri pv. citri (H
E⫽
0.77) (22, 27) and R. solanacearum (H
E⫽ 0.595) (41). It is important that all these studies
analyzed the genetic diversity in areas that were larger than ours (continent, country,
and regional scales, respectively). Interestingly, our values were higher than that
reported for an R. pseudosolanacearum phylotype III field population sampled in
Cameroon (H
E⫽ 0.03; G/N ⫽ 0.235) (52). An explanation for the low genetic diversity
detected, apart from a possible sampling bias effect, might be that the RSSC is capable
of surviving in plants and in soil in a viable but not cultivable (VBNC) state (58).
Therefore, this means that the haplotypes identified might not reflect the total
vari-ability in the field and that we detected only haplotypes specifically able to grow on an
agar medium.
The mutation model for our MLVA-7 loci has been determined. It has been reported
that VNTR loci evolve following a stepwise mutation model (SMM) or another model,
e.g., an infinite allele model (IAM) (59), a two-phase model (TPM) (60), or a generalized
stepwise mutation model (GSM), or k-allele model (KAM) (61). We showed that within
the MLVA-7 scheme, six loci strictly or predominantly follow SMM, whereas one locus
does not follow this model. This finding is important information for future population
genetics analyses, notably the assessment of population differentiation. It also
illus-trates that mutation dynamics of VNTR loci can be different depending on the loci and
on the species studied (62, 63). SMM is the predominant mutational model for some
plant-pathogenic bacteria (24, 27, 64), but data remain scarce on the actual mutation
model at play and the possible variations around this model within the Proteobacteria
phylum.
In conclusion, this study provides an adapted tool for characterizing the genetic
diversity and structure of R. pseudosolanacearum phylotype I on fine scales, from fields
to bulk soil. This MLVA-7 scheme opens research prospects toward an understanding of
the evolutionary mechanisms underlying population structure and adaptation as well
as plant selective pressure on the field scale. This will thus allow characterization of the
impacts of resistant or susceptible plant accession and of crop successions on the
spatial genetic structure of soilborne bacterial plant pathogens. Such tools will allow
unraveling of the bacterial population dynamics on the plant and field scales, help us
to understand plant resistance bypass processes, and pave the way to optimization of
innovative disease control strategies, such as the use of resistant/susceptible varietal
mixtures.
MATERIALS AND METHODS
Bacterial strains. A total of 601 strains—including 598 RSSC strains—were used in this study
(Table 7; see Table S1 in the supplemental material). The species specificity of the MLVA markers was checked with DNAs from Ralstonia pickettii (LMG5942T), R. mannitolilytica (LMG6866T), and R. insidiosa
(LMG21421T) (Table S1). The phylotype specificity and phylogenetic coherence of our markers were
tested on 55 RSSC strains of different phylotypes representative of the worldwide diversity (Table S1). This collection is referred to here as the “worldwide collection.” The suitability of our markers for discriminating populations on the field and soil scales was assessed on (i) three collections sampled from the same R. pseudosolanacearum phylotype I-infected field on Réunion Island at different dates (“Vallon” collections) and (ii) a collection extracted from 5 g of soil sampled at one single location point (“Pirogue” collection) in another R. pseudosolanacearum phylotype I-infected field in Martinique (Table 1; Table S1). Strains of the Vallon 1999 collection were isolated as previously described by Poussier (54). For the other collections, bacterial extractions were performed on 5-cm stem segments following a previously described protocol (40). For bacterial extraction from rhizospheres, the complete root systems were soaked in 200 to 500 ml of Van Elsas and Smalla buffer (VES buffer) (65) and shaken overnight at 120 rpm and 28°C. For bacterial extraction from soil, 20 g of fresh soil (0- to 20-cm top layer) was soaked in 100
on July 2, 2018 by guest
http://aem.asm.org/
TABLE 7 Summary of the collections of RSSC strains Collection Phylotype a Sampling location Country GPS location (latitude, longitude) b Sampling date Sampled material Host Total no. of strains No. of strains genotyped by: MLVA-13 MLVA-7 Worldwide I Table S1 Table S1 Table S1 Stem Table S1 37 34 c 37 II Table S1 Table S1 Table S1 Stem and tuber Table S1 8 8 8 III Table S1 Table S1 Table S1 Stem Table S1 6 6 6 IV Table S1 Table S1 Table S1 Stem Table S1 4 4 4 Field collections Vallon 1999 I Le Vallon field, CIRAD exptl station of Ligne Paradis, St. Pierre Réunion Island ⫺ 21.3208°, 55.4845° 1999 Stem and rhizosphere Solanaceae and Geraniaceae 96 96 Vallon 2009 I Le Vallon field, CIRAD exptl station of Ligne Paradis, St. Pierre Réunion Island ⫺ 21.3208°, 55.4845° 2009 Stem Solanaceae 90 90 Vallon 2012 I Le Vallon field, CIRAD exptl station of Ligne Paradis, St. Pierre Réunion Island ⫺ 21.3208°, 55.4845° January to March 2012 Soil and stem Solanum lycopersicum 319 319 319 Soil collection Pirogue I Habitation Pirogue, Le Lorrain Martinique ⫹ 14.8030°, ⫺ 61.1044° 2007 Soil Musa fallow 38 38 Total phylotype I field and soil strains 543 319 543 Total phylotype I strains (field, soil, and worldwide) 580 353 580 aPhylotypes I and III now belong to R. pseudosolanacearum , phylotype II to R. solanacearum , and phylotype IV to R. syzygii . bPositive latitude coordinates correspond to the North, whereas negative coordinates correspond to the South; positive longitude coordinates corr espond to the East, whereas negative coordinates correspond to the West. cStrains RUN1955, RUN1985, and RUN0157 could not be genotyped by MLVA-13.
on July 2, 2018 by guest
http://aem.asm.org/
Downloaded from
ml of VES buffer, rotated for 30 min at 100 rpm, and then left to settle for 5 min. Series of 1-ml aliquots were sampled and diluted down to 10⫺4. Afterwards, macerates (50l) were streaked either on Imazaki
medium (rhizosphere and soil) (66) or on modified Sequeira medium (67). Plates were then incubated at 28°C for 2 to 3 days. Isolates presenting the typical RSSC morphology—mucoid, “bird’s eye”-shaped beige colonies with formazan coloration—were finally plated on Kelman’s triphenyltetrazolium chloride (TZC) medium (68). Finally, bacteria were stored on microbeads (Microbank ProLab Diagnostic, Neston, Wirral, United Kingdom) or in 20% glycerol at⫺80°C.
Molecular typing and DNA extraction. Molecular identification of the RSSC and determination of
the phylotype were performed using multiplex PCR (mxPCR) on bacterial suspensions (⬃108cells ml⫺1
in high-pressure liquid chromatography [HPLC]-grade water) as previously described (69, 70). PCR products were then subjected to 2% agarose electrophoresis and visualized under UV light after ethidium bromide staining (5g ml⫺1). For isolates identified as belonging to the RSSC, bacterial
suspensions (⬃5 ⫻ 108to 1⫻ 109CFU ml⫺1) were washed with 1 ml of 0.5 M NaCl and centrifuged at
12,000 ⫻ g. The pellets were subjected to Wizard genomic DNA purification lysis buffer (Promega, Fitchburg, WI), and DNA was extracted following the protocol provided by the manufacturer. The DNA concentration and quality were checked using a NanoDrop ND-8000 device (NanoDrop Technologies Inc.). For genotyping, DNA was diluted to 2 ngl⫺1in HPLC-grade water and stored at⫺30°C.
Sequence-based molecular typing (egl and mutS). Multilocus sequence typing based on partial
sequences of DNA mismatch repair (mutS) and virulence-associated endoglucanase (egl) genes has been a reference method for RSSC molecular diagnostics (40, 69, 71, 72). egl sequevars and mutS sequence types were determined using the Endo-F/Endo-R and mutS-RsF.1570/mutSRsR1926 primer pairs, respec-tively. The PCR conditions and the sequencing procedure were described previously (40). Sequences were assembled with Geneious v. 6.0.3 (Biomatters Ltd., Auckland, New Zealand), aligned with the algorithm ClustalW (73) implemented in MEGA5 (74), and then trimmed as explained previously (34).
egl-based sequevars and STs (eSTs) and mutS-based STs (mSTs) were assigned using egl and mutS
reference sequences (34) within DnaSP, using the “generate haplotype list” command (75).
Genotyping with the MLVA-13 scheme (20). To assess whether MLVA-13, the first phylotype
I-specific MLVA scheme, developed by N=Guessan et al. (20), was suitable for analysis on the field scale, 319 phylotype I strains from one field (Vallon 2012 collection) were genotyped using this scheme. Multiplexed primer mixes and the PCR conditions were described previously (20). Capillary electrophore-ses were performed in an ABI Prism 3130XL sequencer, and the electropherograms generated were analyzed with GeneMapper v. 4.0 (Applied Biosystems, Life Technologies, Carlsbad, CA).
Development of a new MLVA scheme (MLVA-7). Three fully sequenced and annotated genomes
(phylotype I strains GMI1000 [46] and Y45 [49] and phylotype III strain CMR15 [43]) that are publicly available via the MaGe interface (RalstoniaScope [76]) were screened for detection of tandem repeats using the Microorganisms Tandem Repeats Database (MTRDB) (77, 78) and the Tandem Repeats Database (TRDB) (79). It has been reported that the number of alleles correlates with the number of TR in the genome and conversely correlates with the pattern size (80), but so far, no general rules have been published. From the literature, expert personal communications (O. Pruvost, personal communication), and the development of the first RSSC MLVA scheme (20), we observed that the highest level of polymorphism was observed for loci with more than 10 repeats and pattern sizes ranging from 5 to 9 bp (20). As a consequence, after a preliminary search, we set the following criteria for TR detection in the MTRDB: total length in the range of 50 to 600 bp, TR length in the range of 5 to 9 bp, number of copies in the range of 9 to 50, matching percentage above 80%, and the default setting for other parameters. TR detection in the TRDB was performed using default parameters (alignment weights at 2 [match], 7 [mismatch], and 7 [indels]) (see the detailed explanation at the TRDB website [79]). PCR primers (18 to 27 bp) were designed within the 500-bp flanking sequences of the TR by using Geneious software v. 6.0.3 (Biomatters Ltd.). Primer sequences were then subjected to BLAST searches with the BLASTN program (81), available on the MaGe website (76), to determine the locations of loci and to check the specificity of each pattern to a single locus per genome. This first step led to the identification of 24 loci (3 detected by both platforms, 5 detected only by the MTRDB, and 16 detected only by the TRDB). These loci were further screened for amplification ability, repeatability, and polymorphism on a 19-strain collection subset (Table S1) including (i) 11 Vallon 2012 strains, selected on the basis of their allelic profiles according to the MLVA-13 scheme, their locations in the field, their hosts (tomato or susceptible or resistant eggplant), and their sampling habitats (stem, rhizosphere, or soil), and (ii) 8 worldwide strains (41), selected on the basis of the clonal complex to which they belong and their geographic origin. Simplex PCRs were performed as previously detailed (20), followed by electrophoresis migration in high-resolution Metaphor agarose (3% Metaphor and 1% SeaKem agarose; Lonza Ltd., Basel, Switzer-land). Based on these results, six loci and primer pairs were selected to develop the new MLVA scheme (Table 2). As we found that CMmp0985 (RS3L20) from the MLVA-13 scheme (20) was the only polymor-phic locus in the Vallon 2012 collection, this locus was added to the six other loci to compose the new MLVA-7 scheme. Primers were multiplexed into two pools of four and three pairs (Table 2), labeled on the forward primers with different fluorescent dyes, i.e., 6-carboxyfluorescein (FAM) (blue), VIC (green), NED (black/yellow), and PET (red) (Applied Biosystems). Primer concentrations and annealing tempera-tures were optimized for amplification of loci on four reference strains according to the manufacturer’s instructions (Applied Biosystems). Capillary electrophoresis was performed as mentioned above.
VNTR analysis and performance measures. Peak data were analyzed using GeneMapper v. 4.0
(Applied Biosystems) and automatically converted to fragment sizes (in base pairs). The analyses described below were realized by using the amplification sizes. When needed, amplicon sizes were converted to repeat numbers by use of the following formula: observed size⫽ extra TR sequence length ⫹ (TR size ⫻ repeat
on July 2, 2018 by guest
http://aem.asm.org/
number). The number of TR was rounded up to the nearest integer, as previously recommended (82). The reproducibility of the amplification of our markers was assessed using GMI1000, the reference phylotype I strain (46), as a positive control for each genotyping run, and also by twice amplifying the phylotype I worldwide collection from independent DNA extractions. Allelic profiles were identical across the different replicates.
Analysis of genetic data. Haplotypes (defined as allelic profiles), Nei’s unbiased diversity index (HE
or Hub) (83), the total number of alleles (Na), and their frequencies were determined using GenAlex
software v. 6.5 (84) (Table 7). To assess the correlation between locus location (chromosome versus megaplasmid and intergenic versus intragenic) and locus polymorphism, allele numbers of loci were compared statistically by the Fisher exact test under the null hypothesis (H0) that a locus has equal probabilities of being polymorphic for any position on the gene.
Haplotype networks were achieved with the globally optimized eBURST analysis (goeBURST) imple-mented in PHYLOViZ v. 1.0 (85). These analyses allowed us to highlight different clonal complexes, defined as groups of SLVs. It also allowed us to visualize allelic profiles diverging by one locus (SLVs) or several loci (double-locus variants [DLVs], three-locus variants [TLVs], etc.). Using the eBURST algorithm, STs are clustered based on their numbers of SLVs, DLVs, and TLVs and occurrence frequencies. The group founder is first connected to all its SLVs; then, each of those, following the ST ordering, is connected to its SLVs not yet present in the tree. This process is repeated until each element of the disjoint graph is present in the tree. The second step consists of a local optimization of the tree. The goeBURST algorithm provides a globally optimal solution and corrects links that do not strictly follow the eBURST rules.
To assess the congruence of MLVA-13 and MLVA-7 clusterings, distance matrices were calculated and compared by the Mantel test, using the CADM.post function of the R package ape 3.1-4, with 9,999 permutations (86). The Mantel correlation coefficients were computed on rank-transformed distances among the distance matrices.
The population structure of R. pseudosolanacearum phylotype I (the worldwide strain collection and the three “Vallon” collections) was assessed using DAPC with the adegenet 1.4.2. package (87) imple-mented in R software v. 3.3.1. This clustering method, free of any assumption related to a population genetics model (e.g., Hardy-Weinberg equilibrium or an absence of linkage disequilibrium) (6), provides an efficient description of genetic clusters by using a few synthetic variables (called the discriminant functions). DAPC yields linear combinations of the original variables (alleles) that maximize differences between groups while minimizing variation within clusters. Clusters were defined by independent k-means, using the Bayesian internal criterion (BIC). Twenty DAPC runs were performed in order to assess the stability of clusters. The xvalDAPC function was used to choose the optimal number of PCs for DAPC.
To detect signatures of recombination and population structure within field collections, multilocus linkage disequilibrium (LD) was estimated using the index of association calculated by the R package poppr (88). The poppr tool calculates both Brown’s index (IA), which was found to increase with the
number of loci, and rd, which corrects for this scaling and forces the index to lie between 0 (linkage
equilibrium) and 1 (full disequilibrium). To test the significance of both indices, the package generated 999 resamplings of the data under the null hypothesis (H0) of free recombination, using the “permuta-tion over alleles” and “parametric bootstrap” methods, and then calculated the P value.
SUPPLEMENTAL MATERIAL
Supplemental material for this article may be found at
https://doi.org/10.1128/
AEM.03095-16
.
TEXT S1, PDF file, 0.04 MB.
DATA SET S1, XLSX file, 0.08 MB.
DATA SET S2, XLSX file, 0.01 MB.
DATA SET S3, XLSX file, 0.01 MB.
ACKNOWLEDGMENTS
We thank S. Lebon, J. M. Baptiste, and E. Lallemand for their technical assistance in
both the field and the laboratory and O. Pruvost and C. Vernière for enriching
discussions.
This research was financially supported by the European Union (FEDER project), the
Conseil Régional de la Réunion, and the French Ministry of Agriculture (project CASDAR
C-2013-09 “RESAUBER”).
REFERENCES
1. Grunwald NJ, Goss EM. 2011. Evolution and population genetics of exotic and re-emerging pathogens: novel tools and approaches. Annu Rev Phytopathol 49:249 –267. https://doi.org/10.1146/annurev-phyto -072910-095246.
2. Leach JE, Cruz CMV, Bai JF, Leung H. 2001. Pathogen fitness penalty as
a predictor of durability of disease resistance genes. Annu Rev Phyto-pathol 39:187–224.https://doi.org/10.1146/annurev.phyto.39.1.187. 3. McDonald BA, Linde C. 2002. Pathogen population genetics,
evolution-ary potential, and durable resistance. Annu Rev Phytopathol 40: 349 –379.https://doi.org/10.1146/annurev.phyto.40.120501.101443.
on July 2, 2018 by guest
http://aem.asm.org/
4. van Belkum A. 1999. The role of short sequence repeats in epidemiologic typing. Curr Opin Microbiol 2:306 –311.https://doi.org/10.1016/S1369 -5274(99)80053-8.
5. Vergnaud G, Pourcel C. 2006. Multiple locus VNTR (variable number of tandem repeat) analysis, p 83–104. In Stackebrandt E (ed), Molecular identification, systematics, and population structure of prokaryotes. Springer-Verlag, Berlin, Germany.
6. Roumagnac P, Gagnevin L, Pruvost O, Achtman M. 2007. Insights into structure and evolution of bacterial species that are revealed by molec-ular methods, p 473– 492. In Tibayrenc M (ed), Encyclopedia of infectious diseases: modern methodologies. Wiley-Liss, Hoboken, NJ.
7. Keim P, Price LB, Klevytska AM, Smith KL, Schupp JM, Okinaka R, Jackson PJ, Hugh-Jones ME. 2000. Multiple-locus variable-number tandem repeat analysis reveals genetic relationships within Bacillus anthracis. J Bacteriol 182:2928 –2936.https://doi.org/10.1128/JB.182.10.2928-2936.2000. 8. Le Fleche P, Hauck Y, Onteniente L, Prieur A, Denoeud F, Ramisse V,
Sylvestre P, Benson G, Ramisse F, Vergnaud G. 2001. A tandem repeats database for bacterial genomes: application to the genotyping of
Yer-sinia pestis and Bacillus anthracis. BMC Microbiol 1:2.https://doi.org/ 10.1186/1471-2180-1-2.
9. Li Y, Cui Y, Hauck Y, Platonov ME, Dai E, Song Y, Guo Z, Pourcel C, Dentovskaya SV, Anisimov AP, Yang R, Vergnaud G. 2009. Genotyping and phylogenetic analysis of Yersinia pestis by MLVA: insights into the worldwide expansion of Central Asia plague foci. PLoS One 4:e6000.
https://doi.org/10.1371/journal.pone.0006000.
10. Jiang Y, Liu HC, Zheng HJ, Tang B, Dou XF, Zhao XQ, Zhu YQ, Lu B, Wang SY, Dong HY, Zhao GP, Zhang YY, Kan B, Wan KL. 2012. Evaluation of four candidate VNTR loci for genotyping 225 Chinese clinical Mycobacterium
tuberculosis complex strains. Biomed Environ Sci 25:82–90. https:// doi.org/10.3967/0895-3988.2012.01.012.
11. Le Flèche P, Fabre M, Denoeud F, Koeck JL, Vergnaud G. 2002. High resolution, on-line identification of strains form the Mycobacterium
tu-berculosis complex based on tandem repeat typing. BMC Microbiol 2:37.
https://doi.org/10.1186/1471-2180-2-37.
12. Pearson T, U’Ren J, Schupp JM, Allan GJ, Foster PG, Mayo MJ, Gal D, Choy JL, Daugherty RL, Kachur S, Friedman CL, Leadem B, Georgia S, Hornstra H, Vogler AJ, Wagner DM, Keim P, Currie BJ. 2007. VNTR analysis of selected outbreaks of Burkholderia pseudomallei in Australia. Infect Genet Evol 7:416 – 423.https://doi.org/10.1016/j.meegid.2006.12.002. 13. U’Ren JM, Schupp JM, Pearson T, Hornstra H, Friedman CL, Smith KL,
Daugherty RR, Rhoton SD, Leadem B, Georgia S, Cardon M, Huynh LY, DeShazer D, Harvey SP, Robison R, Gal D, Mayo MJ, Wagner DM, Currie BJ, Keim P. 2007. Tandem repeat regions within the Burkholderia
pseu-domallei genome and their application for high resolution genotyping.
BMC Microbiol 7:23.https://doi.org/10.1186/1471-2180-7-23.
14. Pourcel C, Hormigos K, Onteniente L, Sakwinska O, Deurenberg RH, Vergnaud G. 2009. Improved multiple-locus variable-number tandem-repeat assay for Staphylococcus aureus genotyping, providing a highly informative technique together with strong phylogenetic value. J Clin Microbiol 47:3121–3128.https://doi.org/10.1128/JCM.00267-09. 15. Lindstedt BA. 2005. Multiple-locus variable number tandem repeats
analysis for genetic fingerprinting of pathogenic bacteria. Electrophore-sis 26:2567–2582.https://doi.org/10.1002/elps.200500096.
16. Van Belkum A. 2007. Tracing isolates of bacterial species by multilocus variable number of tandem repeat analysis (MLVA). FEMS Immunol Med Microbiol 49:22–27.https://doi.org/10.1111/j.1574-695X.2006.00173.x. 17. Parkinson N, Bryant R, Bew J, Conyers C, Stones R, Alcock M, Elphinstone
J. 2013. Application of variable number tandem repeat (VNTR) typing to discriminate Ralstonia solanacearum strains associated with English wa-tercourses and disease outbreaks. Appl Environ Microbiol 79: 6016 – 6022.https://doi.org/10.1128/AEM.01219-13.
18. Gironde S, Manceau C. 2012. Housekeeping gene sequencing and mul-tilocus variable-number tandem-repeat analysis to identify subpopula-tions within Pseudomonas syringae pv. maculicola and Pseudomonas
syringae pv. tomato that correlate with host specificity. Appl Environ
Microbiol 78:3266 –3279.https://doi.org/10.1128/AEM.06655-11. 19. Arrieta-Ortiz ML, Rodriguez RL, Perez-Quintero A, Poulin L, Diaz AC, Arias
Rojas N, Trujillo C, Restrepo Benavides M, Bart R, Boch J, Boureau T, Darrasse A, David P, Duge de Bernonville T, Fontanilla P, Gagnevin L, Guerin F, Jacques MA, Lauber E, Lefeuvre P, Medina C, Medina E, Montenegro N, Munoz Bodnar A, Noel LD, Ortiz Quinones JF, Osorio D, Pardo C, Patil PB, Poussier S, Pruvost O, Robene-Soustrade I, Ryan RP, Tabima J, Urrego Morales OG, Verniere C, Carrere S, Verdier V, Szurek B, Restrepo S, Lopez C, Koebnik R, Bernal A. 2013. Genomic survey of
pathogenicity determinants and VNTR markers in the cassava bacterial pathogen Xanthomonas axonopodis pv. manihotis strain CIO151. PLoS One 8:e79704.https://doi.org/10.1371/journal.pone.0079704.
20. N=Guessan CA, Brisse S, Le Roux-Nio A-C, Poussier S, Koné D, Wicker E. 2013. Development of variable number of tandem repeats typing schemes for Ralstonia solanacearum, the agent of bacterial wilt, banana Moko disease and potato brown rot. J Microbiol Methods 92:366 –374.
https://doi.org/10.1016/j.mimet.2013.01.012.
21. Bui Thi Ngoc L, Vernière C, Vital K, Guérin F, Gagnevin L, Brisse S, Ah-You N, Pruvost O. 2009. Development of fourteen minisatellite markers for the citrus canker bacterium, Xanthomonas citri pv. citri. Mol Ecol Res 9:125–127.https://doi.org/10.1111/j.1755-0998.2008.02242.x.
22. Bui Thi Ngoc L. 2009. Apport de la génétique évolutive dans la taxono-mie et l’épidémiologie de Xanthomonas citri pv. citri, bactérie respon-sable du chancre asiatique des agrumes. PhD thesis. Université de la Réunion, Réunion, France.
23. Leduc A, Traore YN, Boyer K, Magne M, Grygiel P, Juhasz CC, Boyer C, Guerin F, Wonni I, Ouedraogo L, Verniere C, Ravigne V, Pruvost O. 2015. Bridgehead invasion of a monomorphic plant pathogenic bacterium:
Xanthomonas citri pv. citri, an emerging citrus pathogen in Mali and
Burkina Faso. Environ Microbiol 17:4429 – 4442.https://doi.org/10.1111/ 1462-2920.12876.
24. Buhlmann A, Dreo T, Rezzonico F, Pothier JF, Smits TH, Ravnikar M, Frey JE, Duffy B. 2014. Phylogeography and population structure of the biologically invasive phytopathogen Erwinia amylovora inferred using minisatellites. Environ Microbiol 16:2112–2125.https://doi.org/10.1111/ 1462-2920.12289.
25. Poulin L, Grygiel P, Magne M, Gagnevin L, Rodriguez RL, Forero Serna N, Zhao S, El Rafii M, Dao S, Tekete C, Wonni I, Koita O, Pruvost O, Verdier V, Verniere C, Koebnik R. 2015. New multilocus variable-number tandem-repeat analysis tool for surveillance and local epidemiology of bacterial leaf blight and bacterial leaf streak of rice caused by Xanthomonas
oryzae. Appl Environ Microbiol 81:688 – 698. https://doi.org/10.1128/ AEM.02768-14.
26. Daverdin G, Rouxel T, Gout L, Aubertot JN, Fudal I, Meyer M, Parlange F, Carpezat J, Balesdent MH. 2012. Genome structure and reproductive behaviour influence the evolutionary potential of a fungal phytopatho-gen. PLoS Pathog 8:e1003020. https://doi.org/10.1371/journal.ppat .1003020.
27. Vernière C, Bui Thi Ngoc L, Jarne P, Ravigné V, Guérin F, Gagnevin L, Le Mai N, Chau NM, Pruvost O. 2014. Highly polymorphic markers reveal the establishment of an invasive lineage of the citrus bacterial pathogen
Xanthomonas citri pv. citri in its area of origin. Environ Microbiol 16:
2226 –2237.https://doi.org/10.1111/1462-2920.12369.
28. Dunn AR, Bruening SR, Grunwald NJ, Smart CD. 2014. Evolution of an experimental population of Phytophthora capsici in the field. Phytopa-thology 104:1107–1117.https://doi.org/10.1094/PHYTO-12-13-0346-R. 29. Allen C, Prior P, Hayward AC (ed). 2005. Bacterial wilt disease and the
Ralstonia solanacearum species complex. APS Press, Saint Paul, MN.
30. Gillings MR, Fahy P. 1994. Genomic fingerprinting: towards a unified view of the Pseudomonas solanacearum species complex, p 95–112. In Hayward AC, Hartman GL (ed), Bacterial wilt: the disease and its caus-ative agent, Pseudomonas solanacearum. CAB International, Wallingford, United Kingdom.
31. Elphinstone JG. 2005. The current bacterial wilt situation: a global overview, p 9 –28. In Allen C, Prior P, Hayward AC (ed), Bacterial wilt disease and the Ralstonia solanacearum species complex. APS Press, Saint Paul, MN.
32. Hayward AC. 1991. Biology and epidemiology of bacterial wilt caused by
Pseudomonas solanacearum. Annu Rev Phytopathol 29:65– 87.https:// doi.org/10.1146/annurev.py.29.090191.000433.
33. Vinatzer BA, Bull CT. 2009. The impact of genomic approaches on our understanding of diversity and taxonomy of plant pathogenic bacteria, p 37– 62. In Jackson RW (ed), Plant pathogenic bacteria— genomics and molecular biology. Caister Academic Press, Reading, United Kingdom. 34. Wicker E, Lefeuvre P, de Cambiaire JC, Lemaire C, Poussier S, Prior P.
2012. Contrasting recombination patterns and demographic histories of the plant pathogen Ralstonia solanacearum inferred from MLSA. ISME J 6:961–974.https://doi.org/10.1038/ismej.2011.160.
35. Safni I, Cleenwerck I, De Vos P, Fegan M, Sly L, Kappler U. 2014. Polyphasic taxonomic revision of the Ralstonia solanacearum species complex: proposal to emend the descriptions of Ralstonia solanacearum and Ralstonia syzygii and reclassify current R. syzygii strains as Ralstonia
syzygii subsp. syzygii subsp. nov., R. solanacearum phylotype IV strains as