HAL Id: hal-02975991
https://hal.archives-ouvertes.fr/hal-02975991
Submitted on 20 Apr 2021
HAL is a multi-disciplinary open access
archive for the deposit and dissemination of
sci-entific research documents, whether they are
pub-lished or not. The documents may come from
teaching and research institutions in France or
abroad, or from public or private research centers.
L’archive ouverte pluridisciplinaire HAL, est
destinée au dépôt et à la diffusion de documents
scientifiques de niveau recherche, publiés ou non,
émanant des établissements d’enseignement et de
recherche français ou étrangers, des laboratoires
publics ou privés.
Carbonate-Siliciclastic Margin (Great Barrier Reef,
Australia)
Amanda Thran, Madison East, Jody Webster, Tristan Salles, Carole Petit
To cite this version:
Amanda Thran, Madison East, Jody Webster, Tristan Salles, Carole Petit. The Influence of Carbonate
Platforms on the Geomorphological Development of a Mixed Carbonate-Siliciclastic Margin (Great
Barrier Reef, Australia). Geochemistry, Geophysics, Geosystems, AGU and the Geochemical Society,
2020, 21 (4), pp.e2020GC008915. �10.1029/2020GC008915�. �hal-02975991�
Carbonate
‐Siliciclastic Margin (Great
Barrier Reef, Australia)
Amanda C. Thran1,2 , Madison East2, Jody M. Webster2 , Tristan Salles1,2 , and Carole Petit3
1EarthByte Group, School of Geosciences, The University of Sydney, Sydney, New South Wales, Australia,2Geocoastal
Research Group, School of Geosciences, The University of Sydney, Sydney, New South Wales, Australia,3Université Côte
d'Azur, CNRS, Observatoire de la Côte d'Azur, IRD, Géoazur, Valbonne, France
Abstract
Sedimentation regimes on the Great Barrier Reef margin often do not conform to more conventional sequence stratigraphic models, presenting difficulties when attempting to identify key processes that control the margin's geomorphological evolution. By obstructing and modifying down‐shelf and down‐slope flows, carbonate platforms are thought to play a central role in altering the distribution and morphological presentation of common margin features. Using numerical simulations, we test the role of the carbonate platforms in reproducing several features (i.e., paleochannels, shelf‐confined fluvial sediment mounds, shelf‐edge deltas, canyons, and surface gravity flows) that have been described from observational data (seismic sections, multibeam bathymetry, sediment cores, and backscatter imagery). When carbonate platforms are present in model simulations, several notable geomorphological features appear, especially during lowstand. Upon exposure of the shelf, platforms reduce stream power, promoting mounding offluvial sediments around platforms. On the outer shelf, rivers and streams are re‐routed and coalesce between platforms, depositing shelf‐edge deltas and incising paleochannels through knickpoint retreat. Additionally, steep platform topography triggers incision of slope canyons through turbidity currents, and platforms act as conduits for the localized delivery of land and shelf‐derived sediments to the continental slope and basin. When platforms are absent from the topographic surface, the model is unable to reproduce many of these features. Instead, a more typical“reciprocal‐type” sedimentation regime arises. Our results demonstrate the essential role of carbonate platform topography in modulating key bedload processes. Therefore, they exert direct control on the development of various geomorphological features within the shelf, slope, and basin environments.Plain Language Summary
The modern Great Barrier Reef sits atop the skeletal remains of its ancestors. These remains form large (50–200 km2) columns of chalk (or carbonate platforms) that rest on the northeast Australian continental shelf. By comparing observational data with computer simulations, wefind that these platforms majorly disrupt and modify the flow of rivers and deep‐sea density currents during periods of lower sea level. When platforms are exposed, they become hills, forming steep topographic high points that are large enough to re‐route rivers and promote incision on the continental slope. On the modern seafloor, evidence of this activity is preserved in the form of ancient deltas, paleochannels, submarine canyons, and sedimentflows that stretch across the abyssal plain. The morphology and distribution of these seafloor features are more robustly accounted for when carbonate platforms are present, and many of them do not appear in computer simulations where carbonate platforms are absent. Our work shows that carbonate platforms can alter seascapes in ways that are traditionally less understood.1. Introduction
Submarine geomorphology provides a crucial window into the myriad of hydrodynamic, sedimentary, bio-logical, and climatic processes that operate on continental margins over geological timescales. The processes that form features such as paleochannels, submarine canyons, sediment gravityflows, and submarine fans are well understood within a typical sequence stratigraphic framework, which heavily emphasizes the role of eustatic sea level position in mediating source‐to‐sink sediment transport in what are typically
©2020. American Geophysical Union. All Rights Reserved.
Key Points:
• Platforms exert fundamental control on the development of
paleochannels,fluvial mounds, shelf‐edge deltas, submarine canyons, and basinflows • Carbonate platforms obstruct/
re‐route lowstand rivers and promote turbidity current‐driven incision of submarine canyons • Simulations indicate that when
platforms are absent, many features are not reproduced, and a “reciprocal” model of sedimentation dominates Supporting Information: • Supporting Information S1 Correspondence to: A. C. Thran, amanda.thran@sydney.edu.au Citation:
Thran, A. C., East, M., Webster, J. M., Salles, T., & Petit, C. (2020). The influence of carbonate platforms on the geomorphological development of a mixed carbonate‐siliciclastic margin (Great Barrier Reef, Australia). Geochemistry, Geophysics, Geosystems, 21, e2020GC008915. https://doi.org/ 10.1029/2020GC008915
Received 10 JAN 2020 Accepted 13 MAR 2020
siliciclastic‐dominated depositional settings (Emery & Myers, 2009; Jervey, 1988; Posamentier et al., 1988; van Wagoner et al., 1988). In carbonate‐dominated settings (e.g., warm and cool water “carbonate fac-tories”), sequence stratigraphic models mainly focus on the geomorphological development of carbonate platforms (Eberli & Ginsburg, 1989; Kendall & Schlager, 1981; Sarg, 1988). Australia's Great Barrier Reef margin is the world's largest extant mixed carbonate‐siliciclastic system, and while it hosts many features that are ubiquitous in both siliciclastic‐ and carbonate‐dominated settings, the margin repeatedly deviates from conventional styles of geomorphological development that are predicted by these end‐member scenar-ios (Dunbar et al., 2000; Dunbar & Dickens, 2003b).
At the heart of these discrepancies, carbonate platforms are largely speculated to play a role, where platforms interrupt and modify typical cross‐shelf and downslope sediment transport (Dunbar et al., 2000; Dunbar & Dickens, 2003b; Fielding et al., 2003; Page & Dickens, 2005). On the inner to mid‐continental shelf, paleochannels, which are typically incised by rivers during eustatic lowstands, appear to be dis-continuous and shallow in seismic sections, promoting subaerial aggradation rather than erosion (Fielding et al., 2003; Johnson et al., 1982; Woolfe et al., 1998). With the exception of a few larger rivers (Fielding et al., 2005; Ryan, Bostock, et al., 2007), carbonate platforms are thought to obstruct most riv-ers and streams from reaching the shelf edge, causingfluvial sediments to become trapped on the shelf (Dunbar & Dickens, 2003b; Feary et al., 1993; Fielding et al., 2003; Page & Dickens, 2005; Ryan, Bostock, et al., 2007; Symonds et al., 1983; Woolfe et al., 1998). On the continental slope, numerous can-yons show signs of presently active or recent (<80 ka) incision (Feary et al., 1993; Puga‐Bernabéu et al., 2013; Webster et al., 2012). By re‐routing and blocking sediments, the platforms may play a role in preventing the burial of these canyons. However, it is still less clear as to why the canyons remain recently active, particularly as the platforms appear to isolate the canyons from lowstandfluvial sources, which are widely believed to instigate incision within canyon heads (Baztan et al., 2005; Daly, 1936; Kolla & Macurda, 1988; Pratson et al., 2007; Rasmussen, 1994). In the surrounding basin, lowstand sub-marine fans have not been documented. Instead, flows are characterized by multiple generations of far‐reaching sediment gravity deposits and turbidites, which are deposited at all sea level stages (Puga‐Bernabéu et al., 2014; Watts et al., 1993). Gaps between the platforms (or “inter‐reef passages” at highstand), are believed to act as conduits for deposition of coarse‐grained sediments on the slope and in the basin (Puga‐Bernabéu et al., 2014; Symonds et al., 1983; Webster et al., 2012).
Sediment cores and seismic data provide clues as to how the margin behaved before the platforms became established on the shelf, potentially lending insight into the more recent impact of platform topography on the margin. Echoing typical siliciclastic systems, deposition of coarse‐grained material was high on the slope during lowstands, where it was hypothesized that these sediments could more directly migrate to base level (Feary et al., 1993; Feary & Jarrard, 1993). Additionally, the slope was dominated by broader paleovalleys instead of smaller canyons (Feary et al., 1993; Symonds et al., 1983). These authors note a fundamental shift in margin sedimentation style once the platforms appear in seismic sequences.
This deviation from convention poses challenges when attempting to identify the governing mechanisms that form certain geomorphological features. Process‐based models help address these shortcomings by simulating these mechanisms in a numerical framework (e.g., Salles, Ding, Webster, et al., 2018). When simulations reproduce observations, they provide crucial insights into governing physical processes that otherwise may be impossible to observe or ascertain from the geological record alone. As all numerical mod-els are simplified representations of reality, mismatches between observations and simulations are inevita-ble. However, these mismatches can also be used to identify potentially influential processes that are less understood.
This study aims to test the role of carbonate platforms in reproducing key geomorphological features that have previously been described on the Great Barrier Reef margin. Beginning during the previous lowstand (~30 ka), we run simulations with both a“pre‐Holocene” and a “platforms absent” topographic surface, comparing model outputs to multibeam data, seismic sections, backscatter imagery, and interpretations from sediment cores. We show that the platforms play a crucial role in modulating key bedload processes, thus facilitating the formation of outer‐shelf paleochannels, inner to mid‐shelf fluvial mounds, shelf‐edge deltas, slope‐confined canyons, and surface gravity flows.
2. Regional Setting
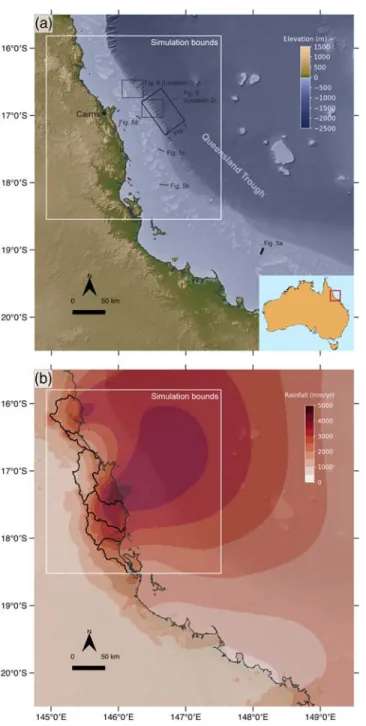
The study region is located in an area previously referred to as the “Noggin” region (Bridge et al., 2011) on Australia's central Great Barrier Reef margin near the Queensland town of Cairns (Figure 1a). Now a pas-sive margin, the region's more active history of extensional tectonics, long‐term subsidence, fault reactivation, and tilting gave rise to the large‐scale bathymetric geometries that physiographically define the mar-gin today (Davies et al., 1989; Symonds et al., 1983). The marmar-gin is charac-terized by a relatively narrow (~50–80 km) continental shelf, a relatively steep (4–7°) continental slope, and a deep (1,500–1,800 m), north‐westward‐dipping Queensland Trough (Puga‐Bernabéu et al., 2013). Tropical climatic conditions favor coral reef growth on the continental shelf, which facilitated the construction of many large (50–200 km2) car-bonate platforms over multiple sea level cycles since the modern Great Barrier Reef's inception. Proposed ages for the Great Barrier Reef's initia-tion range from 400 to 670 ka (Braithwaite et al., 2004; Dubois et al., 2008; Gallagher et al., 2014; International Consortium for Great Barrier Reef Drilling, 2001). This age range is broad, which in part reflects the indirect and imprecise methods so far applied to dating the reef's initiation. However, this broad range may also represent the interplay of multiple paleoenvironmental factors (i.e., the onset of high‐amplitude sea level fluctuations during the mid‐Pleistocene, paleoceanographic and paleocli-matic changes) that may have caused the reef's initiation to occur at differ-ent times and at differdiffer-ent latitudes (Dubois et al., 2008; Gallagher et al., 2014). The entire Great Barrier Reef margin is classified as mixed carbonate‐siliciclastic due to substantial contributions from outer neritic and high‐energy reef sources, which supplement typical hemipelagic sedi-mentation (Davies & McKenzie, 1993; Mount, 1984).
Presently, the Noggin region resides within intermingling wet and dry tro-pical zones, which are dictated by monsoonal, orographic rainfall (Australian Bureau of Meteorology, 2001). The region is often subjected to monsoon‐related flooding and cyclone activity (Sumner & Bonell, 1986), further driving up average annual rainfall values (Figure 1b). As a result of the variable rainfall regime and the topographic control imposed by the mountains to the west, modern rivers and their catchments are comparatively small (~500–2,000 km2
), seasonal inflow, and sometimes ephemeral, emptying their sediments in the nearshore (<20 m depth; Neil et al., 2002; Orpin et al., 2004). The region is macroti-dal (Ryan, Brooke, et al., 2007), and offshore wave regime is moderately energetic, where both swell and locally generated waves are driven by east‐south‐easterly winds and power north‐westward longshore currents (Gallop et al., 2014; Larcombe et al., 1995; Orpin et al., 2004).
3. Methods
3.1. Overview
In this study, we simulate the geomorphological evolution of the Great Barrier Reef margin using pyBadlands (Salles, Ding, Webster, et al., 2018), a code designed to deterministically model sediment transport and land-scape evolution on long (millennial to tectonic) timescales. By capturing fluvial processes, turbidity currents, carbonate platform accretion, and wave‐driven longshore currents, the code is ideally suited to simulating the principal bedload processes that operate on mixed carbonate‐siliciclastic, high‐energy margins.
Figure 1. (a) Hillshaded digital elevation model (DEM; Beaman, 2010) of the Noggin region contained within the simulation bounds. Note the positions of the carbonate platforms in pale blue. Figure 5a (black line) denotes an observed seismic location adapted from Johnson and Searle (1984). Figures 5b–5d (gray lines) denote the locations of simulated seismic profiles. Figures 6 and 7 delineate the bounds of close‐up renderings of 30 m resolution multibeam data (Webster et al., 2008). They also delineate the corresponding modeled areas shown in Figures 6 and 7. (b) Thirty‐year average annual rainfall (Australian Bureau of Meteorology,
2019) with catchments outlined in black (Department of Natural Resources and Mines, 2009).
We note here that while there are many intriguing questions surrounding the behavior of suspended sediments on this margin (see Dunbar et al., 2000; Page et al., 2003), our code does not account for the entrain-ment and subsequent dispersal offine‐grained sediments. We instead focus on features that are more likely to be controlled by bedload processes which mobilize coarse‐grained material (i.e., fine sand and larger). The following methods describe the various governing equations, inputs, and boundary conditions imple-mented in pyBadlands (see Table S1 in the supporting information for a full list of model parameters). 3.2. Clastic Sedimentation and Landscape Evolution
3.2.1. Bedload Fluvial Incision and Deposition
On afirst‐order basis, fluvial incision occurs on steep slopes that are subjected to high discharge (Tucker et al., 2001). In pyBadlands, this process is simulated using a detachment‐limited stream power law (Howard, 1980; Salles & Hardiman, 2016; Tucker et al., 2001):
_ε ¼ −κeAmSn; (1)
where_ε is the vertical incision rate of a river into its bed, κeis an erodibility coefficient, A is the drainage area (a proxy for discharge, and it is a function of precipitation), S is the local topographic gradient, and m and n are dimensionless coefficients. The vertical incision rates computed by the stream power law are then used to calculate bedload sediment volumetricfluxes between nodes, which are then tracked throughout the com-putational domain over time. When simulated rivers or streams encounter shallow local topographic slopes (i.e., S < 0.3° in our experiments), deposition is assumed to occur. Deposition is also permitted in local topo-graphic depressions using a pit‐filling algorithm (Planchon & Darboux, 2002).
While the parameters drainage area A and topographic gradient S are iteratively computed from the initial topographic surface (see section 3.6.1), the other parameters are predetermined. The coefficients m and n default to values of 0.5 and 1, respectively (Salles, Ding, Webster, et al., 2018). The erodibility coefficient κedepends on a variety of factors that control the detachability of the rock substrate, such as climate, rock strength, vegetation, and channel hydraulics (Lague et al., 2005; Whipple & Tucker, 1999). As these factors are not easily quantifiable, and because the parameter is scale‐dependent (Dietrich et al., 1995), the onshore bedrock erodibility coefficient is calibrated by directly comparing the computed sediment fluxes in the model to observed sedimentfluxes in the field. The coefficient is then altered until the computed and observedfluxes match to the correct order of magnitude. Belperio (1979) determined that riverine sediment in the central Great Barrier Reef region is composed of approximately 10–20% bedload. Using this ratio, we calibratedκeto a value of 9.0 · 10−8using total annual sediment load estimates from the Tully River mouth (Brodie et al., 2009). This river has undergone long‐term monitoring and lies within the computational domain, allowing for region‐specific calibration of subaerial bedrock erodibility. We assign a separate κe value for the shelf, slope, and basin, where we assume that sediments are more detachable in these settings. We setκeto a value of 7.5 · 10−6on the basis that key erosional morphological features (e.g., submarine can-yons and outer shelf paleochannels) are reproduced. The selection procedure for shelf, slope, and basin erod-ibility is necessarily qualitative given that the observed sedimentfluxes required for site‐specific calibration are unavailable for these areas.
The code solves the continuity equation using afinite volume scheme on an irregular triangulated mesh of approximately 250‐m resolution (Tucker et al., 2001). Flow is assumed to occur unidirectionally along the slope of steepest descent (O'Callaghan & Mark, 1984). To ensure numerical stability and adequate temporal resolution, an adaptive time step is implemented (Salles & Hardiman, 2016), where the maximum time step interval is set to 100 years.
3.2.2. Turbidity Currents and Marine Sedimentation
In pyBadlands, the stream power law (equation 1) is also used to approximate long‐term submarine erosion and deposition by turbidity currents and surface gravity deposits. In this case, the onshorefluvial network is extended below mean sea level and also operates as a submarine hyperpycnalflow network. For the hyper-pycnalflow network, parameters A and S in the stream power law are modified, following Petit et al. (2015). Drainage area A remains confined to onshore catchment rather than appending the additional area gained by the hyperpycnalflow network, and an effective slope is computed to reduce the erosive power of rivers and streams when they meet the ocean. Thus, erosion rate_ε is dependent on Seff:
Seff ¼ S ρsed− ρwat ρsed ;
(2) whereρsedis the sediment density andρwatis the water density.
In the model, submarine erosion by turbidity currents is simulated when sediments chronically oversaturate the hyperpycnalflow network over long periods of time. When the critical density of the combined water and sediments surpass a given threshold (1,000.025 kg/m3; see Table S1), erosion and downcutting occurs, and sediments are entrained within the hyperpycnalflow network. This threshold value is necessarily low because the timescale of the model does not permit turbidity currents to be triggered instantaneously and episodically. Here, the erosive action of turbidity currents is simulated over longer timescales. As a result, the density threshold value needed to trigger long‐term erosive action by turbidity currents must be lowered. To avoid frequent and rapid avulsion, and to enable sediments to be distributed downslope, the proportion of sediments deposited at a particular cell, dprop, is a function of the local slope:
dprop¼ 0:9
1þ eα S−0:005ð Þ; (3) whereα is a scaling parameter. Sediments therefore are permitted to bypass steeper slopes and are deposited on shallower slopes (Lowe, 1976).
3.2.3. Creep and Slope Failures
In pyBadlands, soil creep is modeled using a well‐known linear diffusion law (Braun et al., 2001; Sweeney et al., 2015):
∂z
∂t¼ κd∇2z; (4)
where z denotes topographic elevation andκdis a diffusion coefficient with units of L2/t. Saunders and Young (1983) determined a value of κd ≈ 0.0008 m2/year for tropical climates, which falls within the accepted order of magnitude for creep rates on land (Martin & Church, 1997). In the deep marine realm (i.e., below wave base), creep diffusion is less efficient (Jordan & Flemings, 1991; Schlager & Adams, 2001), and thus a lower value ofκd= 0.0001 m2/year is prescribed based on observations from Maryland coastal plains (Carson & Kirkby, 1972; Fagherazzi et al., 2004).
Downward movements due to instantaneous slope failure are similarly approximated by the linear diffusion law. When local topographic slope exceeds a critical threshold (S > 14°), a higherκdvalue (0.2 m2/year) is assigned, resulting in accelerated diffusion on steep slopes. Thisκdvalue is informed by measured landslide transport rates (Martin & Church, 1997).
3.3. Waves and Longshore Drift
Where energy conditions permit, wave action propels longshore drift in the nearshore environment. Here, we parameterize the long‐term sedimentary impact of longshore drift using a linear, shallow water wave formu-lation. The basic procedure is as follows: using initial wave forcing parameters (see section 3.6), wave trans-formation is computed in the domain, where the algorithm accounts for energy dissipation due to breaking and bottom friction (Salles, Ding, Webster, et al., 2018). Once a critical shear stress threshold is surpassed at bed, sediments are entrained and transferred parallel to the isobath beneath the breaking zone. Upon enter-ing an area where the bottom shear stress falls below the threshold value or where the depth falls below the prescribed maximum wave base, sediments are once again deposited. Here, the maximum wave base is set to 20 m based on wave data collected near the study region (Orpin et al., 2004). For a full breakdown of the gov-erning equations for wave transformation and longshore drift, see Salles, Ding, and Brocard (2018). 3.4. Carbonate Platform Accretion by Coral Reefs
The vertical accretion of carbonate platforms by coral reef ecosystems is simulated using the fuzzy logic approach of Salles, Ding, and Brocard (2018). The approach involves the application of a set of user‐defined conceptual rules that dictate whether reef growth occurs. Three critical, first‐order factors con-trol accretion rates on geological timescales: water depth (which modulates light exposure and accommoda-tion space), wave activity, and clastic sedimentaaccommoda-tion rate. When these condiaccommoda-tions are simulated in
pyBadlands (Salles, Ding, Webster, et al., 2018), reef growth will either be permitted or limited on carbonate platforms via an if‐then logic. For instance, if carbonate platforms lie within a particular water depth range, then they will undergo vertical accretion by corals and other calcifying organisms. Conversely, if the plat-forms are subaerially exposed, then reef growth will not occur, and carbonate platplat-forms will not undergo vertical accretion. In the model domain, reef growth is permitted on carbonate platforms, as it is generally accepted that a hard, antecedent Pleistocene substrate provides the necessary structural foundations for sub-sequent Holocene and modern reef growth (Davies & Marshall, 1980; Hopley et al., 2007; Johnson & Searle, 1984; Marshall & Davies, 1982).
Following Salles, Ding, and Brocard (2018), the conceptual framework set by these rules is then trans-lated into a quantitative framework in the numerical model. The controlling factors of coral reef growth (i.e., depth, wave height, and clastic sedimentation rate) are represented by a series of membership functions (see Figure 7 in Salles, Ding, & Brocard, 2018), where we consider a unique set of functions for both a shallow and a deep species assemblage. For each environmental factor, the degree of fuzzy membership peaks over a specified range, thus providing a window that allows for optimal growth. The degree of fuzzy membership yielded by these functions is then mapped to a physical carbonate accretion rate according to a maximum real‐world value (Zadeh, 1965). Maximum accretion rates were informed by core‐derived rates for shallow facies (i.e., robust branching corals; 1.2 cm/year) and deep water facies (i.e., tabular‐branching and massive corals; 1.0 cm/year; see Montaggioni, 2005) from reefs in the Indo‐Pacific.
3.5. Pelagic Sedimentation
In addition to coral reefs, pelagic organisms contribute to carbonate deposition on the northeastern Australian margin. This process is simulated through a similar fuzzy logic method, where the sedimentation rate is only dependent on depth. An upper limit of 1.0 cm/kyr was prescribed based on sedimentation rates computed from basin piston cores containing over 90% carbonate (Dunbar et al., 2000). We assume that the effects of compaction are negligible over the past 30 kyr.
3.6. Initial and Boundary Conditions 3.6.1. Bathymetry and Topography
To test the impact of the carbonate platforms on the geomorphological development of features on the mar-gin, we constructed two topographic surfaces: a“pre‐Holocene” surface and a “platforms absent” surface. First, to construct a pre‐Holocene surface, we assume the most significant and consequential changes in ele-vation and shelf gradient occurred due to transgressive and highstand carbonate accretion on carbonate plat-forms. Though variable, Holocene reef thicknesses generally peak at ~15 m (Marshall & Davies, 1984; Webster & Davies, 2003). Following Salles, Ding, Webster, et al. (2018), the initial topographic surface was extracted and smoothed from a 100 m resolution DEM spanning the entire Great Barrier Reef margin (Figure 2a; Beaman, 2010). We then remove a layer with a maximum thickness of 15 m at shallower platform depths, tapering the layer linearly at deeper platform depths (Figure 2b) to produce thefinal pre‐Holocene surface (Figure 2c). Finally, to construct the“platforms absent” surface, we excised all carbonate platforms and applied a linear interpolation over removed shelf areas (Figure 2d). While this surface is artificial, we aimed to preserve the general underlying geometry of the margin for direct comparison, thereby isolating the impact of the platforms. We assume the effects of tectonic subsidence are negligible (Webster et al., 2018), and we assume that onshore river catchments have not significantly reorganized during the last 30 kyr based on pollen records from ODP Site 820 (Moss & Kershaw, 2007).
3.6.2. Sea Level
To simulate sea level rise and fall, we use the curve of Grant et al. (2014). We opted for a curve which approx-imates global eustatic sea level rather than a locally derived one because the millennial‐scale factors that modulate local accommodation space (e.g.,fluvial supply and marine deposition; Posamentier et al., 1988) are independently simulated in the model. Similarly, for this study we chose not to use sea level curves reconstructed solely from coral reef proxies (i.e., Yokoyama et al., 2018—IODP Exp. 325 from the Great Barrier Reef) to prevent a self‐confirming result in the carbonate accretion module.
3.6.3. Precipitation
Asfluvial sedimentation relies on precipitation, we force the model using an average annual rainfall data set spanning 30 years (Figure 1b; Australian Bureau of Meteorology, 2019), which captures critical orographic rainfall patterns. Though regional pollen proxies suggest millennial‐scale rainfall variability (Burrows
et al., 2016; Hughes & Croke, 2017), specific rainfall values are often difficult to precisely reconstruct, complicating the model forcing. In light of the uncertainty inherent in reconstructing paleoclimate parameters, we retain this precipitation regime over the duration of the model to highlight the influence of other environmental variables we are most interested in testing (i.e., the impact of the carbonate platforms). 3.6.4. Wave Regime
Based on output from a global hindcast model, which centers on the wind wave climate of Australia and the South Pacific (Durrant et al., 2014), we prescribe an easterly wave direction and a significant wave height of 2.0 m as boundary conditions for the wave module. The hindcast model predictions are in good agreement with measured wave heights from satellite altimetry (Gallop et al., 2014). While the late Pleistocene and Holocene wave climate for central Queensland is still poorly understood, major climatic phenomena such as El Niño–Southern Oscillation (ENSO) have likely experienced variability over this time (Shulmeister & Lees, 1995). The wave climate of the southwest Pacific, being tightly coupled to ENSO (Goodwin, 2005), may have responded to these changes. Nonetheless, we retain these wave parameters over the course of the simulation for simplicity.
4. Results
4.1. Regional Outlook
Before focusing on specific geomorphological features, we provide a regional overview of river, shoreline, and carbonate platform evolution to help visualize the development of the Noggin margin as it progresses
Figure 2. (a) Original DEM spanning the computational domain. (b) Thickness representing the most recent Holocene reef growth on platforms. This layer was removed from the original DEM to produce the pre‐Holocene surface depicted in the next panel. (c) Smoothed pre‐Holocene topographic surface. (d) Artificial surface with carbonate platforms removed entirely.
through lowstand (30–15 ka), transgression (15–6.5 ka), and highstand (6.5 ka–present). We highlight notable differences in the regional evolution of the margin when platforms are present and when platforms are absent.
Model outputs showcase differences in nearshore geometry at key times (Figure 3). During the Last Glacial Maximum (22.5 ka, sea level =−110 m; Grant et al., 2014), relict platform geometries manifest as subaerially exposed karstified hills, with the shoreline rimming the outer shelf break (Figure 3a). Karstified hills are
Figure 3. Three‐dimensional rendering of model output depicting the migration of the shoreline at key times: the Last Glacial Maximum (22.5 ka), the mid‐Holocene transgression (11 ka), and the beginning of the Holocene highstand (6.5 ka). The first column illustrates the shoreline position in the
simulation where carbonate platforms are present in the initial topographic surface, and the second column illustrates the shoreline position in the simulation where carbonate platforms are absent. Orange indicates areas where shallow and deep coral reef assemblage growth has become activated in the simulation. This occurs when water depth, wave conditions, and sedimentation rates are suitable (see section 3.4). Vertical exaggeration = 11×.
absent from the“platforms absent” simulation by design, and the shoreline occupies a similar shelf‐break location due to the preservation of upper slope geometry in constructing the initial artificial surface (Figure 3b). During the mid‐transgression (11 ka, sea level = −35 m) shoreline geometries diverge considerably. When platforms are present, the paleoshoreline advances landward (Figure 3c) but is punctuated by subaerially exposed karstified hills, forming a series of topographically complex coastal embayments that fall within wave base. Contemporaneously on the outer shelf, smaller submerged platforms begin to undergo vertical accretion by shallow and deep coral assemblages. Prolific reef growth atop platforms begins at ~9 ka when they become fullyflooded. This is largely consistent with turn‐on times indicated by fossil reef cores recovered on the shelf edge (Webster et al., 2018) and inner to mid‐shelf (Hopley et al., 2007). When carbonate platforms are absent, the shoreline is more uniform and linear during the transgression (Figure 3d), owing to the more gradual underlying shelf gradient. Finally, during the highstand “carbonate platforms present” scenario (6.5 ka, sea level = −6 m), the shoreline reaches a similar position to that of present day (Figure 3e), and reef growth continues. The“platforms absent” scenario attains a similar shoreline configuration but without the proliferation of reefs (Figure 3f). Lowstandfluvial networks are profoundly reorganized by the presence of the platforms, where rivers and streams are often re‐routed and coalesce within gaps between platforms on the outer shelf (Figure 4). Localized sediment mounds are constructed around the platforms by a combination of re‐deposited fluvial and platform‐derived sediments. These re‐routed rivers produce outer‐shelf paleochannels, shelf‐edge del-tas, and highly localized slope and basinflows, all of which will be discussed in greater detail in the following results sections. When carbonate platforms are removed, rivers and streams follow a more direct route to the outer shelf, primarily depositing their sediments on the outer shelf and upper slope. Particularly notable is a lack of incision on the inner to mid‐shelf in both cases.
4.2. Shelf Features
Model simulations reproduce notable shelf features observed in seismic data, including reef pinnacles, reworked transgressive shelf deposits, fluvial mounds, shelf‐edge paleochannels, and shelf‐edge deltas. These features do not appear in the same fashion when carbonate platforms are removed.
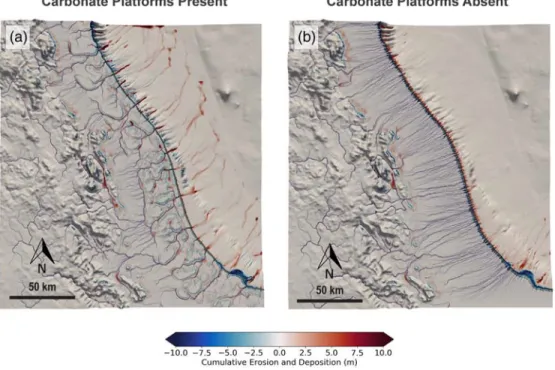
Figure 4. Drainage network evolution from lowstand (30 ka) to the beginning of the transgression (15 ka) for simulations containing carbonate platform topography (a) and no carbonate platforms (b). Major rivers and streams computed in the model are shown in blue, where drainage patterns at 30, 25, 20, and 15 ka are overlain over cumulative erosion and deposition over this period. Red areas around the carbonate platforms indicate deposition of both platform andfluvial sediments.
Starting on the mid‐shelf, it is important to note that the observed seismic cross‐section fell outside of the simulation bounds, precluding direct data‐model comparisons at this specific site. Here, we opted to provide several simulated examples from multiple locations within the domain. The observed seismic section along the windward edge of Prawn Reef illustrates mounded morphology at the base of a reef pinnacle (Figure 5a), where vibrocores from the mound recoveredfluvially‐derived sands (Symonds et al., 1983). Simulations pro-duce similar mounded morphologies at the bases of modern pinnacles, where mounds are partially con-structed by Pleistocenefluvial deposits and reef talus at lowstand. They are further shaped by reworked
Figure 5. (a) Boomer profile showing sediment mounds overlying a channel on the windward margin of Prawn Reef (adapted from Symonds et al., 1983). (b–d) Examples of synthetic seismic cross sections showing positive relief and mounding over bathymetric depressions rimming the windward margins of various carbonate platforms in the computational domain. For locations of all lines, see Figure 1.
shelf and platform‐derived sediments during the transgression (Figures 5b–5d). A lowstand erosional channel was also incised in the model (Figure 5c), where it was subsequently backfilled by channel abandonment, waves, and currents during the beginning of the transgression. In simulations, carbonate vertical accretion commences around the antecedent platform edge at ~14 ka. Upward growth propagates across the top of the platform after it becomes fully inundated at ~9 ka.
Outer shelf features that were reproduced in model simulations include paleochannels (sometimes referred to as“shelf‐incising canyons”) and shelf‐edge deltas (Figure 6). Paleochannels are excavated via knickpoint retreat by lowstand rivers, which regain stream power when they are directed through gaps between plat-forms. When carbonate platforms are removed, minor shelf‐edge incision occurs, but paleochannels are much shorter and are uniform along the shelf‐edge. Similarly, shelf‐edge deltas appear in both simulations, but their occurrence is more scattered when carbonate platforms are present.
4.3. Slope Features
The highly gullied, dendritic morphologies of the Noggin region canyons were successfully reproduced in model simulations when carbonate platforms were present (Figures 7a and 7b). Also reproduced are
Figure 6. Feature comparison of DEM and simulated cumulative deposition/erosion (temporal range: 30–22.5 ka) for two outer‐shelf locations. The blue lines indicate sea level position, and carbonate platforms are shaded in white. For locations, see Figure 1.
linear, more isolated gullies to the south. In the model, incision is instigated throughout the lowstand by the triggering of erosive turbidity currents, where turbidity currents are initiated by an excess of sediments eroded from steep platform, shelf edge, and upper slope topography. The smoothed, antecedent slope topography also controls gully orientation, where individual channels in the amphitheater heads coalesce further downslope. Canyon head incision is interspersed with shelf‐edge and upper slope fluvial deposits. When carbonate platforms are removed from the simulation, canyon incision by this process ceases entirely (Figure 7c). Instead, the outer shelf edge and upper slope experience more uniform net deposition during this lowstand period.
4.4. Basin Features
Backscatter data depict surface gravity deposits on the slope and in the basin in the Noggin region, where two major northward‐deflecting flows have previously been interpreted (Figure 8a; Dunbar et al., 2000). Corresponding simulations with carbonate platforms produce a variety of northward‐deflected gravity deposits during lowstand (Figure 8b), which are facilitated both by erosive turbidity currents and by highly localized deposition on the slope in gaps between platforms. In the model,flows extend into the axis of the
Figure 7. (a) High‐resolution (30 m) multibeam bathymetry showing dendritic canyon morphologies described in the Noggin region (Puga‐Bernabéu et al., 2013). (b) Simulations of cumulative erosion and deposition in the Noggin region from 30 to 15 ka (i.e., lowstand to early transgression), where carbonate platforms are present and dendritic morphologies of the canyons are reproduced by turbidity current incision. (c) Identical simulation of the Noggin region with carbonate platforms absent. Vertical exaggeration = 11×.
Queensland Trough and appear to be fairly evenly distributed from north to south. When carbonate platforms are absent (Figure 8c), turbidity currents are not readily triggered, with deposits more concentrated on the upper slope. Another notable feature is the lack of submarine fans in both cases.
5. Discussion
A number of geomorphological features are successfully reproduced with pyBadlands when carbonate plat-forms are present in the initial topographic surface. Within each Discussion section, we will investigate the mechanisms that are responsible for forming them in the model space. We reproduce observations in data sets that both pre‐date (i.e., seismic reflection profiles and slope/basin sediment cores) and post‐date (i.e., seismic reflection profiles, shallow sediment cores, multibeam bathymetry, and backscatter data) the Great Barrier Reef's inception, lending legitimacy to our approximation of a bathymetric surface without carbonate platforms. This allows us to highlight the role of the reef structure in preconditioning and modify-ing some of these source‐to‐sink mechanisms. Additionally, we will discuss areas where the data and model diverge, identifying model limitations and suggesting areas for future work. Table 1 summarizes the model's ability to reproduce specific features, providing explanations of governing model processes and recommen-dations for processes that are missing from the model but are potentially important.
5.1. Shelf Features
5.1.1. Sediment Mounding Around Karstified Hills
Our simulations demonstrate that carbonate platforms on the continental shelf obstruct rivers and facilitate mounding offluvio‐deltaic and shelf‐derived sediments during lowstand. At a smaller scale, the model is able to reproduce the mounded morphologies offluvially‐derived sands that have been seismically imaged around the windward margins of carbonate platforms (Figures 5b–5d; Symonds et al., 1983). Lowstand mounding is promoted by sharp changes in topography, and subsequent transgressive mounding is insti-gated by wave‐driven longshore drift. However, there are finer‐scale discrepancies between observed and modeled morphologies. For instance, observed mounds tend to be smaller, exhibit higher local relief, and are bordered by deeper channels. Such discrepancies suggest that additional, secondary controls (i.e., channel‐levee and delta lobe deposition, reworking by wind and tidal currents) may be interacting with
Figure 8. (a) GLORIA side‐scan sonar backscatter imagery (Puga‐Bernabéu et al., 2013), pictured with satellite imagery of the onshore and shelf areas. White areas on the slope and in the basin correspond to areas of high reflectivity, interpreted as coarse‐grained surface gravity deposits and landslides. Labeled flow names follow the interpretations of (Dunbar et al., 2000). (b) pyBadlands simulation output with carbonate platforms present, depicting shelf‐to‐basin cumulative erosion and deposition from 30 to present. (c) Cumulative erosion and deposition for the“platforms absent” simulation.
platforms during and/or following the deposition of the main mound, as has been previously suggested (Symonds et al., 1983).
A regional view of the simulation output shows similar depositional patterns around local topographic highs and within local topographic lows (Figure 4). Once again, small coastal rivers and streams lose their power when encountering the variable relief introduced by the exposed carbonate platforms. This phenomenon has previously been hypothesized to explain the widely reported aggradational shelf geometries observed in seis-mic sections and the absence of lowstand siliciclastic sediments in slope and basin cores (Dunbar et al., 2000; Dunbar & Dickens, 2003b; Feary et al., 1993; Feary & Jarrard, 1993; Page et al., 2003; Page & Dickens, 2005; Woolfe et al., 1998), representing a significant deviation from conventional reciprocal sequence stratigraphic models (Jervey, 1988; Posamentier et al., 1988; Posamentier & Vail, 1988). However, not all sediments appear to be trapped on the shelf during lowstand; while a portion of bothfluvial sediments and reef talus remain on the shelf during this time, our simulations also show highly localized delivery of sediments between carbonate platforms (Figure 4). This behavior has been suggested in previous studies of slope hemi-pelagic and turbidite sedimentation (Feary et al., 1993; Francis et al., 2007; Puga‐Bernabéu et al., 2014). A more detailed source‐to‐sink computational analysis is warranted to help disentangle the specific sediment sources contributing to these deposits and to determine the fate of these sediments following the transgres-sion. Nevertheless, our model supports the occurrence of both blocking and re‐rerouting of sediments that traverse the shelf, processes which do not occur when carbonate platforms are absent (Figure 4).
5.1.2. Paleochannel Incision
Model simulations indicate that outer shelf paleochannel incision is facilitated by the carbonate platforms (Figure 6). In the model, these channels form due to knickpoint retreat, which is prompted by the increased stream power of lowstand rivers as they coalesce through gaps between platforms andflow down the steep shelf edge. When platforms are not present, this process is much less pronounced given the diffuse
Table 1
Summary of Model's Ability to Reproduce Certain Morphological Features
Feature
Model's ability
to reproduce Processes responsible in model
Potentially missingfirst‐order
processes Key references
Fluvial mounding around platforms
Well‐reproduced Decrease of stream power by steep, subaerially exposed platform topography, local undulations in bathymetry, ample supply from hinterland
Smaller‐scale fluviodeltaic processes (delta lobe deposition and
channel‐levee processes), bottom currents
Symonds et al. (1983), Dunbar et al. (2000), Maxwell and Swinchatt (1970)
Inner shelf paleochan-nel incision
Poorly reproduced
— Tidal processes, episodic
flooding events
Carter et al. (1993), Fielding
et al. (2003; 2005), Johnson et al. (1982), Johnson and Searle (1984), Ryan, Bostock, et al. (2007), Symonds et al. (1983), Orme et al. (1978) Outer shelf
paleochan-nels
Well‐reproduced Knickpoint retreat driven by subaerially exposed shelf edge, steep upper slope, and increased stream power by rivers and streams, which are re‐routed and coalesce within gaps between exposed platforms
Tidal currents Abbey et al. (2011) and Hinestrosa
et al. (2016)
Shelf‐edge deltas
Well‐reproduced Knickpoint retreat, relatively low fluvial supply
Two‐way coupling of wave‐delta interactions
Harris et al. (1990) and Symonds et al. (1983)
Slope‐confined canyons
Well‐reproduced Incision by turbidity currents, which are preconditioned by steep carbonate platform topography, steep continental slope, and initial“amphitheater‐like” slope morphology
Upslope, retrogressive erosion by landslides and other mass movements
Puga‐Bernabéu et al. (2011, 2013)
Sediment gravity flows/ turbidites Partially reproduced
Relatively low supply, relatively steep platforms and continental slope, north‐westward deepening geometry of the Queensland Trough
Highstand shedding, river plumes, storm andflooding events, seismicity, and factors influencing slope stability
Dunbar et al. (2000), Puga‐Bernabéu et al. (2011, 2014), Watts et al. (1993), Webster et al. (2012)
distribution of rivers and streams on the outer shelf, which lessens their individual stream power (Figure 6). Because tidal currents are not simulated here, we cannot fully discount their role in forming and maintain-ing these channels, as has been previously proposed (Abbey et al., 2011; Harris et al., 2005). However, given that the model adequately reproduces these features without tidal activity, we deem platform‐facilitated knickpoint retreat to be an important driver in their formation. In reproducing these outer shelf channels, our simulations suggest that lowstand rivers indeed reach the shelf edge because of the lack of a continuous, rimmed barrier in the Noggin region. However, before reaching the shelf edge, they are heavily re‐routed and localized through gaps in the platforms, where they then incise the outer shelf. This implies that the positions of these outer paleochannels may not distinctly correspond to the positions of larger onshore rivers and may help explain the sometimes discontinuous nature of shelf‐traversing paleochannels in this region (Carter et al., 1993; Fielding et al., 2003). This also implies that paleochannel incision on the outer shelf is instigated by different processes than those on the inner shelf (see below).
Conversely, our models do not reproduce paleochannel incision on the inner and mid‐shelf, regardless of whether carbonate platforms are present. This suggests that the shallow and patchy nature of the paleochan-nels cannot necessarily be attributed to the obstruction of carbonate platforms alone and that other factors may be important. Given their seemingly fragmentary distribution, the origins of the inner to mid‐shelf paleochannels, which were imaged roughly 150–200 km southwest of the computational domain (Carter et al., 1993; Fielding et al., 2005; Johnson et al., 1982; Johnson & Searle, 1984; Ryan, Bostock, et al., 2007; Symonds et al., 1983), have been a subject of debate in recent years. Again, while many prominent paleo-channels indeed appear to be associated with major rivers (i.e., the Burdekin and Fitzroy; Fielding et al., 2005; Ryan, Bostock, et al., 2007), it has been speculated that many auxiliary rivers and streams in this region would not have been strong enough to incise the low‐gradient shelf and that other processes (i.e., tidal scour-ing and high‐energy flooding events) may be contributing to their formation and maintenance during regres-sions and/or lowstands (Ryan, Bostock, et al., 2007; Woolfe et al., 1998). The modeling presented here supports this view. If inner to mid‐shelf paleochannels are indeed present in the Noggin region, we antici-pate that stream power would not be high enough to be the sole mechanism responsible for their incision due to small catchment sizes and the shallow shelf gradient. This suggests that other lesser‐known incision and maintenance processes might be at play that are not captured in the present model framework. We reiterate the conclusions of Fielding et al. (2005) and Ryan, Bostock, et al. (2007), where paleochannel inci-sion could be quite complex and could involve a number of site‐specific factors that preclude formulating a unified model for the region.
5.1.3. Shelf‐Edge Delta Formation
Shelf‐edge deltas are another byproduct of fluvial deposition and knickpoint retreat in the model (Figure 6). These features also arise when platforms are absent, though they are more uniform along the slope. There is considerable evidence of shelf‐edge delta development from seismic reflection data (Symonds et al., 1983) and sediment cores (Harris et al., 1990), where they occur in sequences that both precede and post‐date the proposed age range for the inception of the modern Great Barrier Reef (~400–670 ka; Braithwaite et al., 2004; Dubois et al., 2008; Gallagher et al., 2014; International Consortium for Great Barrier Reef Drilling, 2001). The modeling results presented here provide an additional independent line of evidence that favors lowstand shelf‐edge delta deposition rather than the development of deep‐sea fans, and we attribute this behavior to the relatively low stream power and sediment supply of coastal rivers and streams in the Noggin region. In both bathymetric data and model simulations with platforms present (Figure 6), younger shelf‐edge deltas appear to be more sporadic in their distribution, and we attribute this to the positioning of the platforms. However, wave activity may also play a role in restricting depocenters on the outer shelf and upper slope, and future work would benefit from a computational examination of two‐way coupling betweenfluvial supply and wave activity.
5.2. Platform Control on Submarine Canyon Incision
Model simulations indicate that the carbonate platform structures exertfirst‐order control on the morpho-logical development of the submarine canyons in the Noggin region (Figure 7). Previous hypotheses which state that canyons are incised by the scouring action of lowstand turbidity currents (e.g., Baztan et al., 2005; Daly, 1936; Mulder et al., 2003; Popescu et al., 2004; Pratson & Coakley, 1996) are supported here. In the case of the Noggin region, turbidityflows are further pre‐conditioned by both the steepness of the continental
slope and the steepness of the platforms. When the platforms are subaerially exposed during lowstands, stream power is increased, and erosion is enhanced. Thus, hyperpycnal conditions are favored at the shelf edge. This is consistent with the presence of outer neritic and reefal sediments in turbidites deposited within canyons in the region (Puga‐Bernabéu et al., 2014; Webster et al., 2012). More broadly, this mechanism could help explain the occurrence of numerous small canyons on slopes adjacent to carbonate platforms, which have been observed both in ancient record (Mullins & Cook, 1986) and in other modern settings (e.g., the Bahamas; Mullins et al., 1984; Tournadour et al., 2017). Regarding the influence of retrogressive erosion sug-gested by others (Puga‐Bernabéu et al., 2013), our model does not explicitly capture this process, and we therefore will not rule out its potential influence on canyon development, especially given the model's sen-sitivity to the initial amphitheater‐like depressions in the initial topographic surface. However, our model does support the occurrence of a top‐down canyon incision style (Baztan et al., 2005; Pratson & Coakley, 1996), where localized incision of pre‐canyon rills on the steep upper slope promotes a positive feedback of subsequent failure and further incision within the developing canyon head.
The influence of the carbonate platforms on canyon formation is further supported by seismic evidence. Prior to the Great Barrier Reef's initiation, and thus prior to the construction of the carbonate platforms on the Queensland shelf (which Feary et al. estimated to be ~0.76–1.01 Ma based on seismic interpretation), broad paleovalleys and sigmoidal/progradational geometries are interpreted on the shelf edge and upper slope (Feary et al., 1993; Symonds et al., 1983). Symonds et al. (1983) describe widespread upper slope deposi-tion at this time, which is consistent with relatively high outer shelf and slope sedimentadeposi-tion rates derived from sediment cores (Feary & Jarrard, 1993). This represents a style of sedimentation that is more consistent with the reciprocal model (Jervey, 1988; Posamentier et al., 1988; Posamentier & Vail, 1988), where sedi-ments are deposited at or near base level. We are able to reproduce this style of sedimentation simply by removing the carbonate platforms from the simulation, where net deposition occurs on the slope rather than canyon incision. Following the Great Barrier Reef's initiation, signs of increased slope incision appear in observational data, where Feary et al. (1993) interpret canyon incision since at least 80 ka. Similarly, when carbonate platforms are present in the model, canyon incision occurs at lowstand. Given thesefindings, we infer that the age of the canyons, at least in their current, dendritic‐like morphological form, is constrained by the age of the platforms (~600 ka). Nevertheless, the proposed age for these canyons still remains tentative and could be clarified by a more extensive three‐dimensional seismic survey.
It is possible that canyon incision and maintenance continues during highstands in the central Great Barrier Reef region. This relatively recent activity is indicated both by the presence of carbonate‐dominated turbi-dites at highstand (Puga‐Bernabéu et al., 2014) and the presence of sediment waves located within the axes of the canyon heads, which are imaged in multibeam bathymetric data (Puga‐Bernabéu et al., 2013). Highstand canyons have been described in the cool‐water carbonate Gippsland Basin system in southern Australia (Mitchell et al., 2007), where it is speculated that increased production of shelf‐derived carbonates cause more frequent triggering of erosive turbidity currents and sediment gravityflows within canyon heads. It is possible that canyon downcutting and incision is triggered by a similar mechanism of supply‐driven fail-ure and erosion in the Great Barrier Reef region, as carbonate sediment production peaks during highstands (Dunbar & Dickens, 2003a). In warm water carbonate‐dominated settings, this mechanism may be a conse-quence of a process more broadly referred to as“highstand shedding” (Droxler & Schlager, 1985; Schlager et al., 1994). However, within our current model framework, highstand shedding is not currently accounted for. Nevertheless, this mechanism should be more rigorously explored in the future.
5.3. Surface Gravity Flows and Turbidite Deposition
The spatial distribution of the gravity deposits simulated in the model, which were primarily triggered by turbidity currents at lowstand, generally corresponds to the spatial distribution of the surface gravity depos-its observed in backscatter imagery. However, the real and simulated deposdepos-its differ in several notable ways (Figure 8). Simulatedflows extend outward into the axis of the Queensland Trough as the turbidite record suggests (Puga‐Bernabéu et al., 2011; Watts et al., 1993), where upon initiation, stream power is heightened by steep carbonate platform topography and localization of rivers through gaps between platforms. Similar to theflows observed in backscatter imagery, simulated flows are deflected northward by the Queensland Trough, where the lack of development of any significant submarine fans is attributed to relatively low sup-ply and the deepening geometry of the trough. However, backscatter imagery implies clustering offlows
toward the north, whereas the simulatedflows occur fairly evenly throughout the domain where gaps between platforms are present. This discrepancy may be due to the fact that backscatter imagery is more indicative of coarser‐grained (sand‐gravel) deposits and/or disintegrative landslides (Puga‐Bernabéu et al., 2011),which are not simulated here and are preconditioned by an additional suite of slope stability fac-tors (the degree of consolidation, the presence weak layers, overburdening, etc.; Hampton et al., 1996). In the model,flows are more indicative of turbidite deposition triggered under hyperpycnal conditions at the mouths of rivers and streams. In addition to a spatial mismatch of deposits, there also appears to be a timing mismatch. So far, deep sea sediment cores from this region do not yield any definitive relationship between turbidite occurrence and sea level (Dunbar et al., 2000; Puga‐Bernabéu et al., 2014; Watts et al., 1993; Webster et al., 2012). As stated in the above section, because turbidite sedimentation is primarily generated during lowstands in the model (Figure 8), there are likely other triggering processes (e.g., highstand shed-ding, disintegrative landslides, storm events, and seismicity) that are presently unaccounted for in simula-tions (Schlager et al., 1994). This is further reinforced by the lack of turbidite sedimentation in the simulation where platforms are absent, despite the prolonged record of basin turbidite deposition in a core which pre‐dates the Great Barrier Reef (i.e., since the Miocene; Watts et al., 1993).
5.4. Limitations and Future Directions
While we mentionfiner‐scale model shortcomings in the previous discussion sections and in Table 1, we address broader study limitations here. First, in the absence of three‐dimensional seismic data, we make sev-eral assumptions when constructing the initial“pre‐Holocene” and “platforms absent” topographic surfaces. Regarding the pre‐Holocene surface, the shelf's ability to store sediments at lowstand is predicated upon topographic complexity, which alters stream power and facilitates deposition. Given the numerous drowned platforms and topographic depressions imaged in two‐dimensional seismic sections (Johnson & Searle, 1984; Symonds et al., 1983; Webster et al., 2018), we deem it reasonable to assume that the initial topography would have been sufficiently complex, even without more precise knowledge of the initial surface. Nevertheless, this should be tested if the relevant data are acquired. Similarly, while the initial“platforms absent” surface was artificial, our results are consistent with higher sedimentation rates and thicker isopach maps on the outer shelf and upper slope prior to the establishment of the platforms (Feary et al., 1993; Feary & Jarrard, 1993). This suggests that our approximation of the surface is robust, lending confidence to the con-clusion that sediment transport under these circumstances would be less circuitous and unimpeded. This study would nonetheless benefit from a more substantial sensitivity analysis of the initial topographic surface.
Finally, in the interest of prioritizing the most important mechanisms, the study's scope did not capture the full set of oceanographic, climatic, hydraulic, sedimentological, and biological factors (i.e., tidal currents, upwelling, wind‐driven currents, variable precipitation, bar and levee deposition, heterogeneous grain size, and lithology) that may be responsible for the presentation of certain geomorphological features. Additionally, whereas this model deterministically simulates processes over geological timescales, margin environments are inherently stochastic, and higher‐frequency/higher‐energy events such as floods and cyclones may be important in forming certain features. Finally, it would be worthwhile to examine the impact of vegetation (e.g., paleo‐mangrove swamps) on both sediment supply and lowstand sediment sto-rage (Bostock et al., 2007; Grindrod et al., 1999). In acknowledging the potential importance of these other processes, computational models can always be improved to test new hypotheses in conjunction with observational data.
6. Conclusions
Using numerical simulations, we show that carbonate platform geometry on the Great Barrier Reef margin directly preconditions the formation of several key geomorphological features on the shelf, slope, and in the basin. To demonstrate this, we run model simulations both with carbonate platforms present and platforms absent in the initial topographic surface. Using a variety of observations from multibeam data, seismic sec-tions, backscatter imagery, and sediment cores, we show that several features appear when platforms are present. However, their distribution and occurrence are not reproduced when platforms are removed. From these data‐model comparisons, we propose several platform‐mediated mechanisms that form specific features in the Noggin region (central Great Barrier Reef):
1. On the inner to mid‐shelf, platforms reduce the stream power of lowstand rivers, facilitating mounding and deposition around local topographic highs (i.e., the exposed karstified hills) and within local topo-graphic depressions. Mounds are further constructed and reworked by wave‐driven longshore currents during the transgression.
2. On the outer shelf, lowstand rivers are re‐routed and siphoned between gaps in the platforms. Rivers locally regain their stream power within these gaps, incising paleochannels through knickpoint retreat. Shelf‐edge deltas are also deposited by a combination of fluvial sources and local knickpoint retreat. 3. On the slope, steep platform topography locally increases stream power at the outer shelf edge during
lowstand, eroding sediments and triggering turbidity currents that incise submarine canyons. Dendritic canyon morphologies are reproduced only when platforms are present in simulations. 4. In the surrounding basin, platforms act as conduits forfluvial and shelf‐derived sediments. Lowstand
tur-bidites are deflected north‐westward by the Queensland Trough. Submarine fans do not appear due to low supply and the deepening geometry of the Queensland Trough.
We also identify areas where observations and model simulations diverge, suggesting mechanisms that are presently unaccounted for but may be influential in shaping the margin's geomorphological features. Our study demonstrates that numerical simulations can provide crucial place‐specific insight into processes that operate on continental margins, particularly when they are unaccounted for within conventional sequence stratigraphic models.
References
Abbey, E., Webster, J. M., & Beaman, R. J. (2011). Geomorphology of submerged reefs on the shelf edge of the Great Barrier Reef: The influence of oscillating Pleistocene sea‐levels. Marine Geology, 288(1), 61–78. https://doi.org/10.1016/j.margeo.2011.08.006
Australian Bureau of Meteorology (2001). Map of climate zones of Australia. Melbourne, Australia: Commonwealth of Australia. Retrieved November 13, 2019, from www.bom.gov.au/climate/how/newproducts/images/zones.shtml
Australian Bureau of Meteorology (2019). Decadal and multi‐decadal rainfall. Melbourne, Australia: Commonwealth of Australia. Retrieved from http://www.bom.gov.au/jsp/ncc/climate_averages/rainfall/index.jsp
Baztan, J., Berné, S., Olivet, J. L., Rabineau, M., Aslanian, D., Gaudin, M., et al. (2005). Axial incision: The key to understand submarine canyon evolution (in the western Gulf of Lion). Marine and Petroleum Geology, 22(6‐7), 805–826. https://doi.org/10.1016/j.
marpetgeo.2005.03.011
Beaman, R. J. (2010). Project 3D‐GBR: A high‐resolution depth model for the Great Barrier Reef and Coral Sea. Cairns, Australia: Project 2.5i.1a Final Report, Marine and Tropical Sciences Research Facility. Retrieved from https://www.deepreef.org/bathymetry/65 ‐-3dgbr‐bathy.html
Belperio, A. P. (1979). The combined use of wash load and bed material load rating curves for the calculation of total load: An example from the Burdekin River, Australia. CATENA, 6(3‐4), 317–329. https://doi.org/10.1016/0341‐8162(79)90027‐4
Bostock, H. C., Brooke, B. P., Ryan, D. A., Hancock, G., Pietsch, T., Packett, R., & Harle, K. (2007). Holocene and modern sediment storage in the subtropical macrotidal Fitzroy River estuary, Southeast Queensland, Australia. Sedimentary Geology, 201(3‐4), 321–340. https:// doi.org/10.1016/j.sedgeo.2007.07.001
Braithwaite, C. J. R., Dalmasso, H., Gilmour, M. A., Harkness, D. D., Henderson, G. M., Kay, R. L. F., et al. (2004). The Great Barrier Reef: The chronological record from a New Borehole. Journal of Sedimentary Research, 74(2), 298–310. https://doi.org/10.1306/091603740298 Braun, J., Heimsath, A. M., & Chappell, J. (2001). Sediment transport mechanisms on soil‐mantled hillslopes. Geology, 29(8), 683–686.
https://doi.org/10.1130/0091‐7613(2001)029<0683:STMOSM>2.0.CO;2
Bridge, T. C. L., Done, T. J., Friedman, A., Beaman, R. J., Williams, S. B., Pizarro, O., & Webster, J. M. (2011). Variability in mesophotic coral reef communities along the Great Barrier Reef, Australia. Marine Ecology Progress Series, 428, 63–75. https://doi.org/10.3354/ meps09046
Brodie, J., Waterhouse, J., Lewis, S., Bainbridge, Z., & Johnson, J. (2009). Current loads of priority pollutants discharged from Great Barrier Reef Catchments to the Great Barrier Reef. Townsville, Australia: ACTFR Report 9.02, Australian Centre for Tropical Freshwater Research.
Burrows, M. A., Heijnis, H., Gadd, P., & Haberle, S. G. (2016). A new late Quaternary palaeohydrological record from the humid tropics of northeastern Australia. Palaeogeography, Palaeoclimatology, Palaeoecology, 451, 164–182. https://doi.org/10.1016/j.palaeo.2016.03.003 Carson, M. A., & Kirkby, M. J. (1972). Hillslope form and process. New York: Cambridge University Press.
Carter, R. M., Johnson, D. P., & Hooper, K. G. (1993). Episodic post‐glacial sea‐level rise and the sedimentary evolution of a tropical con-tinental embayment (Cleveland Bay, Great Barrier Reef shelf, Australia). Australian Journal of Earth Sciences, 40(3), 229–255. https:// doi.org/10.1080/08120099308728077
Daly, R. A. (1936). Origin of submarine canyons. American Journal of Science, 31(186), 401–420. https://doi.org/10.2475/ajs.s5-31.186.401 Davies, P. J., & Marshall, J. F. (1980). A model of epicontinental reef growth. Nature, 287, 37–38. https://doi.org/10.1038/287037a0 Davies, P. J., & McKenzie, J. A. (1993). Controls on the Pliocene–Pleistocene evolution of the northeastern Australian continental margin.
In Proceedings of the Ocean Drilling Program, Scientific Results, (Vol. 133, pp. 755–762). College Station: TX (Ocean Drilling Program. Davies, P. J., Symonds, P. A., Feary, D. A., & Pigram, C. J. (1989). The evolution of the carbonate platforms of northeast Australia. In P. D.
Crevello, J. L. Wilson, J. F. Sarg, & J. F. Read (Eds.), Controls on Carbonate Platforms and Basin Development (Vol. 44, pp. 233–258). Special Publications of the Society of Economic Paleontologists and Mineralogists.
Department of Natural Resources and Mines. (2009). Drainage basins Queensland. Queensland Government. Retrieved from http:// qldspatial.information.qld.gov.au/catalogue/custom/detail.page?fid=%7BF79B22E5‐7BD4‐44AF‐98EB‐AC1A46513EDD%7D Dietrich, W. E., Reiss, R., Hsu, M.‐L., & Montgomery, D. R. (1995). A process‐based model for colluvial soil depth and shallow landsliding
using digital elevation data. Hydrological Processes, 9(3–4), 383–400. https://doi.org/10.1002/hyp.3360090311
Acknowledgments
Thran was supported by the University of Sydney DBH Scholarship. Salles was supported by both the ARC Training Centre in Data Analytics for Resources and Environments (DARE) and the ARC Research Hub for Basin GEodyNamics and Evolution of SedImentary Systems (GENESIS). Backscatter imagery was collected during a survey on the HMAS Cook, July 1989. Coastal background satellite imagery was provided with the backscatter imagery by the Australian Centre for Remote Sensing. Inland satellite imagery was provided by Google through the QGIS OpenLayers plug‐in. The version of pyBadlands used in this study can be found online (zenodo.org/badge/latestdoi/ 192655024). The seismic boomer profile displayed in Figure 55a was reproduced under a CC BY 4.0 Creative Commons license (http://creativecommons.org/ licenses/by/4.0/legalcode), where it was originally published by a predecessor of Geoscience Australia. This work was supported by Pawsey through the use of advanced computing resources. We thank Stephen Gallagher, Xiaoping Yuan, and editor Peter van der Beek for their careful and constructive reviews, which greatly improved the quality of the manuscript.