HAL Id: hal-03044535
https://hal.archives-ouvertes.fr/hal-03044535
Submitted on 6 Jan 2021
HAL is a multi-disciplinary open access
archive for the deposit and dissemination of
sci-entific research documents, whether they are
pub-lished or not. The documents may come from
teaching and research institutions in France or
abroad, or from public or private research centers.
L’archive ouverte pluridisciplinaire HAL, est
destinée au dépôt et à la diffusion de documents
scientifiques de niveau recherche, publiés ou non,
émanant des établissements d’enseignement et de
recherche français ou étrangers, des laboratoires
publics ou privés.
From the star to the transiting exoplanets:
Characterisation of the HD 219134 system
R. Ligi, C. Dorn, A. Crida, Y. Lebreton, O. Creevey, F. Borsa, N. Nardetto, I.
Tallon-Bosc, F. Morand, E. Poretti
To cite this version:
R. Ligi, C. Dorn, A. Crida, Y. Lebreton, O. Creevey, et al.. From the star to the transiting exoplanets:
Characterisation of the HD 219134 system. SF2A 2019, May 2019, NICE, France. �hal-03044535�
FROM THE STAR TO THE TRANSITING EXOPLANETS :
CHARACTERISATION OF THE HD 219134 SYSTEM
R. Ligi
1, C. Dorn
2, A. Crida
3, 4, Y. Lebreton
5, 6, O. Creevey
3, F. Borsa
1, D. Mourard
3, N. Nardetto
3, I.
Tallon-Bosc
7, F. Morand
3and E. Poretti
1Abstract.
Exoplanets’ properties are directly linked to that of their host star. This is even more true in the case of transiting exoplanets, where the planetary radius cannot be derived if the stellar radius is unknown. Interferometry seems the best technique in this context, as it provides in a quasi-direct way and with exquisite precision the stellar radii. Moreover, the transit light curve can be used to directly obtain the stellar density, and thus the stellar mass.
We apply this technique to the system of HD 219134, which hosts two transiting super-Earths. Using these observa-tional techniques and the correlations between the measured parameters, we directly derive new stellar radius, density and mass : R?= 0.726 ± 0.014 R , ρ?= 1.82 ± 0.19 ρ , M?= 0.696±0.078 M . This yields new planetary parameters,
and in particular, we find that the two transiting exoplanets show different densities despite similar masses. This can be explained by three hypothesis, among which one suggests that tides heat the internal part of the innermost planet, leading to a molten mantle with lower density.
Keywords: Stars: fundamental parameters, Stars:individual: HD 219134, Planetary systems, Techniques: interferomet-ric, Methods: numerical, Planets and satellites: fundamental parameters
1 Introduction
After thousands of exoplanets discoveries, we have now entered the era of their characterisation. In this context, transiting exopanets can be considered as the most interesting targets because the knowledge of the stellar radius directly leads to the knowledge of the planetary one. This parameter, along with the mass and density, are the basics to infer exoplanets’ internal composition. In a previous work (Crida et al. 2018b,a), we showed that using the transit light curve to measure the stellar density, interferometry to measure the stellar radius, and the combination of both with the computation of the correlation between M? and R? is a very powerful technique. It was applied to the system of 55 Cnc, for which we provided a radius and mass with 2% and 6.6% precision respectively (Ligi et al. 2016; Crida et al. 2018b). This yielded the characterisation of the transiting exoplanet 55 Cnc e and allowed to show that its atmosphere is thinner than previously expected (Crida et al. 2018b,a). The system of HD 219134 hosts two transiting rocky exoplanets and at least two additional exoplanets. We report a new analysis of the star and its transiting exoplanets, which led to a new estimation of their interior, showing than planet b could have a molten mantle. The analysis is described in detail in Ligi et al. (2019) 2 Revisiting stellar parameters
2.1 Interferometric observations
We observed HD 219134 with the VEGA/CHARA interferometer (Mourard et al. 2009; Ligi et al. 2013) from 2016 to 2018. We used the baselines S1S2, E1E2, W1W2 and W2E2 (Fig. 1) to insure a wide (u, v) coverage. In total, we collected
1
INAF-Osservatorio Astronomico di Brera, Via E. Bianchi 46, I-23807 Merate, Italy
2University of Zurich, Institut of Computational Sciences, University of Zurich, Winterthurerstrasse 190, CH-8057, Zurich, Switzerland 3Universit´e Cˆote d’Azur, Observatoire de la Cˆote d’Azur, CNRS, Laboratoire Lagrange, Bd de l’Observatoire, CS 34229, 06304 Nice cedex 4,
France
4Institut Universitaire de France, 103 Boulevard Saint-Michel, 75005 Paris, France 5
LESIA, Observatoire de Paris, PSL Research University, CNRS, Universit´e Pierre et Marie Curie, Universit´e Paris Diderot, 92195 Meudon, France
6Institut de Physique de Rennes, Universit de Rennes 1, CNRS UMR 6251, 35042 Rennes, France
7Univ Lyon, Univ Lyon1, Ens de Lyon, CNRS, Centre de Recherche Astrophysique de Lyon UMR5574, F-69230 Saint-Genis-Laval, France
442 SF2A 2019
0.0 0.5 1.0 1.5 2.0
Spatial frequency (in 108/rad) 0.0 0.2 0.4 0.6 0.8 1.0 Squared visibility S1S2 E1E2 W1W2 W2E2
Fig. 1: Left : Squared visibilities obtained with VEGA/CHARA for HD 219134. The different colours represent the data points obtained with different baselines. The solid line represents the model of LD diameter. Right : Joint likelihood of the radius and mass of the star HD 219134. The nine contour lines separate 10 equal-sized intervals between 0 and the maximum of the joint likelihood of the radius and mass.
36 data points at wavelengths ranging from 685 to 725 nm that led to squared visibilities ranging from 0.111 ± 0.050 to 0.987 ± 0.085 (Ligi et al., subm.). Using the LITpro software (Tallon-Bosc et al. 2008), we first fitted our data taking a model of uniform disk to derive a uniform-disk diameter of θUD= 0.980 ± 0.020 mas. However, a limb-darkened (LD)
diameter is more realistic, and we thus used this representation to derive our final diameter. We used Claret & Bloemen (2011) tables to obtain a limb-darkening coefficient corresponding to Teff,SED = 4839 ± 25K (the effective temperature
derived from the the SED, see Sec. 2.2), gravity log (g) = 4.57 ± 0.14 dex (average of the log(g) found in the litterature from 2000), and metallicity [Fe/H] = 0.07 ± 0.1 (idem) in the R and I filters by making interpolations of the surrounding values present in the tables (see Ligi et al., subm. for details). Finally, we obtain a LD diameter of θLD= 1.035±0.021 mas.
2.2 Stellar parameters
We applied the method described by Crida et al. (2018b) to compute the probability density function (PDF) of the stellar mass M?and radius R?(noted fR?). fR?can be expressed as a function of the PDF of θLDand the distance d, yielding R?
= 0.726 ± 0.014 R with d= 6.533 ± 0.038 pc (Gaia Collaboration et al. 2018). In case of a planetary transit, Seager &
Mall´en-Ornelas (2003) show that the stellar density ρ?can be derived from the transit duration, period and depth. Using
the transit data from Gillon et al. (2017), we computed the stellar density independently for both transits, and then their average which is ρ? = 1.82 ± 0.19 ρ . Finally, we computed the joint likelihood of M?and R?, which depends on fR?,
and the PDF of ρ?. This yields M?= 0.696±0.078 M , with a correlation between M?and R?of 0.46. This correlation
is clearly seen in Fig. 1 (right) ; we obtain an inclined ellipse in the (M?, R?) plane, reducing the possible values of M?that relate on R? and ρ?. We note that this value of M?is lower than previous estimates from Gillon et al. (2017, 0.81 ± 0.03M ) and Boyajian et al. (2012, 0.763 ± 0.076M ) who used indirect methods to infer it.
To derive the bolometric flux of HD 219134, we used the photometry from the VizieR Photometry tool*while selecting
non-redundant points. We fitted our data with the BaSeL empirical library of spectra (Lejeune et al. 1997) with a nonlinear least-squared minimisation algorithm (Levenberg-Marquardt), and perform a Monte-Carlo like simulation on fλ, E(B-V), Teff, log (g), [M/H] to compute the final Fbol. We then derived Teff from Fboland θLD. With Fbol= (19.86 ± 0.21) · 10−8
erg s−1 cm−2, we obtain Teff = 4858 ± 50 K, a value close to the effective temperature directly derived from the SED
Teff,SED= 4839 ± 25 K and to the Tefffrom Gaia (4787+92−73K).
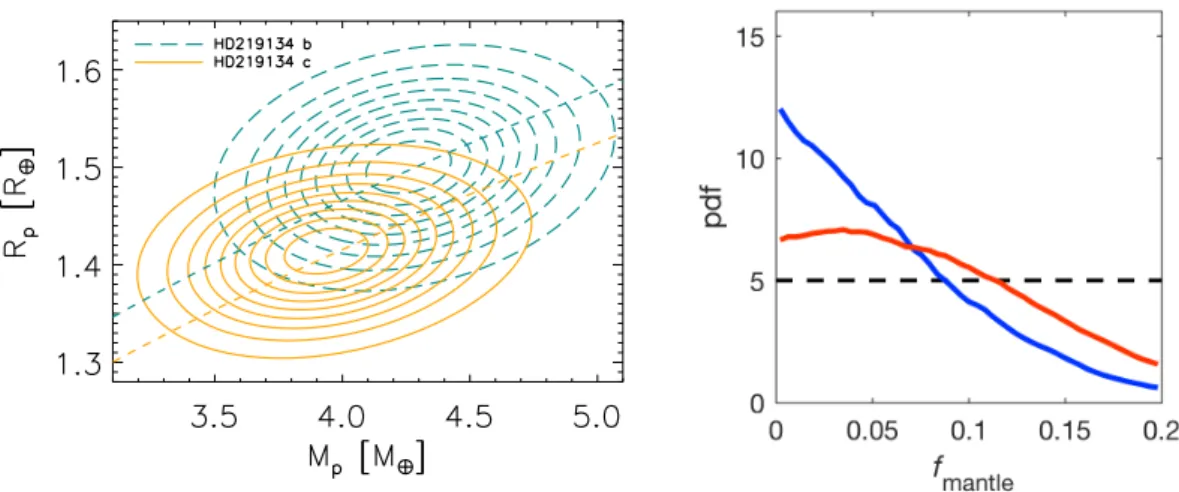
Fig. 2: Left : Joint likelihood of the planetary mass and radius for planet b (green long-dashed line) and planet c (yellow solid line). The dashed lines show the iso-densities corresponding to the mean densities of planets b and c. The nine contour lines separate 10 equal-sized intervals between 0 and the maximum of the joint likelihood of the radius and mass. Right: PDF of the fudge factor for planets b (solid red line) and c (solid blue line), and the prior (black dashed line).
Table 1: Parameters of the transiting exoplanets of the system HD 219134. Param. HD 219134 b HD 219134 c Rp[R⊕] 1.500 ± 0.057 1.415 ± 0.049 Mp[M⊕] 4.27 ± 0.34 3.96 ± 0.34 Corr(Rp,Mp) 0.22 0.23 ρp[ρ⊕] 1.27 ± 0.16 1.41 ± 0.17 a[au] 0.037 0.062
3 Properties of the transiting exoplanets HD 219134 b& c 3.1 Radius, mass and density
The system of HD 219134 hosts two transiting exoplanets, HD 219134 b & c. Since R?and M?are now well known,
we can derive Mp and Rp from the light curves and radial velocity measurements. More precisely, Crida et al. (2018b)
showed that for any pair of Mpand M?, one can derive the associated semi-amplitude K following Kepler’s law. Similarly,
at any pair of Rp and R? can be associated the transit depth∆F. These values are used to compute the PDF of Rp and
Mp(see Crida et al. 2018b, for details and Ligi et al., subm.), which are presented in Tab. 1. Then, the density of each
exoplanet is computed from Rpand Mptaking into account the correlation between both parameters (Fig. 2, left). We note
that the new determinations of planetary radii are smaller than the previous estimates (for example by Gillon et al. 2017) because of our smaller stellar radius. We point out that these new Rpvalues clearly locate the two transiting exoplanets in
the super-Earths part of the exoplanets radii distribution separated by the Fulton gap (Fulton et al. 2017), which enforce their super-Earth nature. More interestingly, planet b has a lower density while a higher mass than planet c. Computing the ratio of the planets’ densities by using the transit and RV parameters yields ρb/ρc= 0.905 ± 0.131. This means that
there is a 10% difference between both densities with 50% probability, or that there is a 70% chance that the difference be higher than 5%. We investigate in the next section the possible origin of this difference.
3.2 Internal compositions
First, it is worth noticing that the uncertainty in the density ratio also allows for no interior difference between both transiting exoplanets. But if there is a difference, the lower density of planet b can be associated to secondary atmospheres or a rock composition that is enriched in very refractory elements (Dorn et al. 2018; Dorn & Heng 2018). Moreover, this difference in density can also be associated to different melt fractions as demonstrated by Bower et al. (2019). To investigate these possibilities, we use the inference scheme developed by Dorn et al. (2017) which calculates the possible
444 SF2A 2019
interiors and their confidence ranges from the planetary mass, radius, stellar irradiation and abundances. We also consider that the two planets are made of iron-rich cores, silicate mantles, and terrestrial-type atmospheres since they are considered as super-Earths. In addition to the regular interior parameters, we consider a fudge factor that accounts for the decrease in density (see Ligi et al., subm. for details). As a result, we find mantle compositions and core sizes in agreement with bulk densities and stellar abundances constraints. In particular, the core fraction of both planets is close to that of Venus and Earth ((rcore/rcore+mantle)⊕= 0.53), which again validates their super-Earth nature. More interestingly, planet b’s lower
density of 10% is attributed to a 10% lower core and a 45% higher fuge factor (Fig. 2, right), meaning that a significantly stronger reduction of mantle density is plausible given the data.
3.3 Dynamical solutions
The possible large molten fraction of planet b cannot be explained by its equilibrium temperature (1036K), which is below the melting temperature of silicates. Therefore, we investigate if it could be due to tidal heating caused by an excited eccentricity of the planet. Using the SyMBA N-body code (Duncan et al. 1998), we ran simulations of the planets of the HD 219134 system.
We took the orbital parameters of the four inner planets from Gillon et al. (2017), and found that the system is stable over 1 Gyr and that eboscillates from 0. to 0.13 with a period of a few thousand years. However, with initial eccentricities
set to 0 for all planets, the system remains stable during 500 Myrs, which is in desagreement with Gillon et al. (2017)’s observations and suggests that the four inner planets may have not acquired their final mass and/or semi-major axes during the proto-planetary disc phase. Adding dissipation, planet b drifts inwards and planet c as well but less significantly. Both planets cross the 2 : 1 mean motion resonance, kicking their eccentricity. But they are quickly damped and ecconverges
to 0.025 while ebends up oscillating between 0.005 and 0.037 with a period of ∼ 3000 years when it reaches its present
semi-major axis. In that case, planet b would endure episodes of hundred times more heating per mass unit than Io. In contrast, planet c is never heated as musch as the Jovian satellite.
4 Conclusions
We report here a new analysis of the HD 219134 system, which hosts two transiting exoplanets known to date. Using the VEGA/CHARA interferometer, we measured the angular diameter of the star and then its radius using the Gaia distance. We used the transit light curve to obtain a direct measurement of the stellar density and then of the stellar mass. We find a radius and mass lower than previous estimates, but an effective temperature consistent with that derived from SED and from Gaia. Our new stellar parameters directly impact the properties of the transiting exoplanets. We used (Gillon et al. 2017)’s orbital solutions to compute the PDF of Rp, Mpand ρp, confirming that planets b and c belong to the super-Earths
population. We show that planet b has a smaller density while a higher mass than planet c. Using an inference scheme, we find that these difference can be due to possible difference in the volatile layer or the rock composition. But this can also come from a different molten fraction. We investigate this possibility using a N-body code simulation, which reveals that a perfectly circular orbit for planets b and c is unlikely. Planet b in particular can experience excentricity of ∼ 0.02 with possible large oscillations, that could provoke a large tidal heating causing the melt of the mantle.
Exoplanetary systems are generally complex and need a deep analysis of both stellar and planetary properties. In particular, direct measurements of the stellar parameters and improving the precision of the transit light curves allow a better knowledge and can lead to insights of planetary formation.
R.L. has received funding from the European Union’s Horizon 2020 research and innovation program under the Marie Skłodowska-Curie grant agree-ment n. 664931. C.D. acknowledges support from the Swiss National Science Foundation under grant PZ00P2 174028. This work is based upon observations obtained with the Georgia State University Center for High Angular Resolution Astronomy Array at Mount Wilson Observatory. The CHARA Array is supported by the National Science Foundation under Grants No. AST-1211929 and AST-1411654. This research has made use of the SIMBAD database, operated at CDS, Strasbourg, France. This research has made use of the Jean-Marie Mariotti Center SearchCal service†
co-developped by LAGRANGE and IPAG, and of CDS Astronomical Databases SIMBAD and VIZIER‡. This work has made use of data from the
European Space Agency (ESA) mission Gaia (https://www.cosmos.esa.int/gaia), processed by the Gaia Data Processing and Analysis Consor-tium (DPAC, https://www.cosmos.esa.int/web/gaia/dpac/consorConsor-tium). Funding for the DPAC has been provided by national institutions, in particular the institutions participating in the Gaia Multilateral Agreement.
†Available at http://www.jmmc.fr/searchcal ‡Available at http://cdsweb.u-strasbg.fr/
References
Bower, D. J., Kitzmann, D., Wolf, A. S., et al. 2019, arXiv preprint arXiv:1904.08300 Boyajian, T. S., von Braun, K., van Belle, G., et al. 2012, ApJ, 757, 112
Claret, A. & Bloemen, S. 2011, A&A, 529, A75
Crida, A., Ligi, R., Dorn, C., Borsa, F., & Lebreton, Y. 2018a, Research Notes of the American Astronomical Society, 2, 172 Crida, A., Ligi, R., Dorn, C., & Lebreton, Y. 2018b, ApJ, 860, 122
Dorn, C., Harrison, J. H., Bonsor, A., & Hands, T. O. 2018, Monthly Notices of the Royal Astronomical Society, 484, 712 Dorn, C. & Heng, K. 2018, The Astrophysical Journal, 853, 64
Dorn, C., Venturini, J., Khan, A., et al. 2017, Astronomy & Astrophysics, 597, A37 Duncan, M. J., Levison, H. F., & Lee, M. H. 1998, AJ, 116, 2067
Fulton, B. J., Petigura, E. A., Howard, A. W., et al. 2017, AJ, 154, 109 Gaia Collaboration, Brown, A. G. A., Vallenari, A., et al. 2018, ArXiv e-prints Gillon, M., Demory, B.-O., Van Grootel, V., et al. 2017, Nature Astronomy, 1, 0056 Lejeune, T., Cuisinier, F., & Buser, R. 1997, VizieR Online Data Catalog, 412, 50229 Ligi, R., Creevey, O., Mourard, D., et al. 2016, A&A, 586, A94
Ligi, R., Dorn, C., Crida, A., et al. 2019, A&A, 631, A92
Ligi, R., Mourard, D., Nardetto, N., & Clausse, J.-M. 2013, Journal of Astronomical Instrumentation, 02, 1340003 Mourard, D., Clausse, J. M., Marcotto, A., et al. 2009, A&A, 508, 1073
Seager, S. & Mall´en-Ornelas, G. 2003, ApJ, 585, 1038
Tallon-Bosc, I., Tallon, M., Thi´ebaut, E., et al. 2008, in Society of Photo-Optical Instrumentation Engineers (SPIE) Conference Series, Vol. 7013