HAL Id: hal-02352935
https://hal.archives-ouvertes.fr/hal-02352935
Submitted on 12 Nov 2019HAL is a multi-disciplinary open access archive for the deposit and dissemination of sci-entific research documents, whether they are pub-lished or not. The documents may come from teaching and research institutions in France or abroad, or from public or private research centers.
L’archive ouverte pluridisciplinaire HAL, est destinée au dépôt et à la diffusion de documents scientifiques de niveau recherche, publiés ou non, émanant des établissements d’enseignement et de recherche français ou étrangers, des laboratoires publics ou privés.
Male Vocal Quality and Its Relation to Females’
Preferences
Alexandre Suire, Michel Raymond, Melissa Barkat-Defradas
To cite this version:
Alexandre Suire, Michel Raymond, Melissa Barkat-Defradas. Male Vocal Quality and Its Relation to Females’ Preferences. Evolutionary Psychology: an International Journal of Evolutionary Ap-proaches to Psychology and Behavior, Ian Pitchford, Ed.& Pub., 2019, 17 (3), pp.147470491987467. �10.1177/1474704919874675�. �hal-02352935�
1 Title: Male vocal quality and its relation to females’ preferences
1
Authors: Alexandre Suire1*, Michel Raymond1, Melissa Barkat-Defradas1 2
*Corresponding author: Alexandre Suire 3 E-mail: alexandre.suire@umontpellier.fr 4 Fax: +33 4 67 14 36 22 5 Tel: +33 4 67 14 49 66 6 1
ISEM, Univ. Montpellier, CNRS, EPHE, IRD, Montpellier, France. 7
Email addresses: michel.raymond@umontpellier.fr; melissa.barkat-defradas@umontpellier.fr 8 9 10 11 12 13 14 15 16 17 18 19 20 21 22 23 24 25 26
2 Abstract
27
In both correlational and experimental settings, studies on women’s vocal preferences have 28
reported negative relationships between perceived attractiveness and men’s vocal pitch, 29
emphasizing the idea of an adaptive preference. However, such consensus on vocal 30
attractiveness has been mostly conducted with native English speakers, but a few evidence 31
suggest that it may be culture-dependent. Moreover, other overlooked acoustic components of 32
vocal quality, such as intonation, perceived breathiness and roughness may influence vocal 33
attractiveness. In this context, the present study aims to contribute to the literature by 34
investigating vocal attractiveness in an underrepresented language (i.e., French) as well as 35
shedding light on its relationship with understudied acoustic components of vocal quality. 36
More specifically, we investigated the relationships between attractiveness ratings as assessed 37
by female raters and male voice pitch, its variation, the formants’ dispersion and position, and 38
the harmonics-to-noise and jitter ratios. Results show that women were significantly more 39
attracted to lower vocal pitch and higher intonation patterns. However, they did not show any 40
directional preferences for all the other acoustic features. We discuss our results in light of the 41
adaptive functions of vocal preferences in a mate choice context. 42
Keywords 43
Attractiveness; fundamental frequency; formants; intonation; breathiness; roughness; mate 44 choice. 45 46 47 48 49 50 51
3 Introduction
52
Voice is one of the fundamental aspects of human communication. Indeed, research has 53
reported that acoustic signals provide listeners with information on the quality or condition of 54
the speaker such as sex (Bachorowski and Owren, 1999; Gelfer and Bennett, 2013; Gelfer and
55
Mikos, 2005; Hillenbrand and Clark, 2009), age (Linville and Fisher, 1985; Ptacek, and
56
Sander, 1966; Shipp, Qi, Huntley, and Hollien, 1992), sexual orientation (Lyons, Lynch, 57
Brewer, and Bruno, 2014; Munson, McDonald, DeBoe, and White, 2006), physical strength 58
(Sell, Bryant, Cosmides, Tooby, Sznycer, von Rueden, Krauss and Gurven, 2010), sexual 59
behavior and body configuration (Hughes, Dispenza, and Gallup, 2004). In this context, 60
numerous studies have explored the relationships between acoustic features of speech and 61
several auditory impressions, among which, attractiveness as assessed by opposite-sex 62
members. Focus has especially been given to sexually dimorphic acoustic traits such as the 63
fundamental frequency (i.e., F0, the acoustic correlate of voice pitch) and the formant 64
frequencies (i.e., the resonances of the vocal tract, the acoustic correlate of perceived timbre) 65
(Titze, 1989). 66
In both correlational and experimental settings, most studies have reported a consistent 67
negative relationship between men’s F0 and attractiveness, that is, women are attracted to 68
relatively low-pitched voices (Bruckert, Lienard, Lacroix, Kreutzer, and Leboucher, 2006;
69
Collins, 2000; Feinberg, Jones, Little, Burt, and Perrett, 2005; Hodges-Simeon, Gaulin, and
70
Puts, 2010; Hughes, Farley, and Rhodes, 2010; Jones, Feinberg, DeBruine, Little, and
71
Vukovic, 2010; Pisanski and Rendall, 2011; Vukovic, Feinberg, Jones, DeBruine, Welling,
72
Little and Smith, 2008; Xu, Lee, Wu, Liu, and Birkholz, 2013). Relatively lower formants’
73
dispersion (i.e., Df, the relative distance between two consecutive formants, which is 74
correlated to the vocal tract length), were also found to be more attractive in male voices 75
(Hodges-Simeon et al., 2010; Pisanski and Rendall, 2011). Although two studies have found 76
4 non-significant relationships (Babel, McGuire, and King, 2014; Feinberg et al., 2005), the 77
former reported that larger females tended to prefer increased apparent vocal tract size (which 78
positively correlates with a larger body size) while the latter reported that lower first 79
formants’ frequencies for the vowels /i/ and /u/ were judged as more attractive; still, both 80
studies suggested that apparent vocal tract size influences vocal attractiveness. Additionally, 81
although it has received little attention compared to the F0 and Df, one study has reported that 82
lower F0-SD (i.e., the evolution of F0 through time, which acoustically correlates to micro 83
variations of intonation patterns in continuous speech) was more attractive in men (Hodges-84
Simeon et al., 2010), although two other studies have reported the opposite relationship 85
(Bruckert et al., 2006; Leongómez, Binter, Kubicová, Stolařová, Klapilová, Havlíček, and
86
Roberts, 2014). 87
Under the scope of human sexual selection, three ultimate accounts can be invoked to 88
explain the relationships between females’ preferences and men’s voices. Firstly, there is 89
intersexual selection, which corresponds to the selection exerted by one sex over another. For 90
instance, lower F0s were found to be positively associated to higher circulating testosterone 91
levels in men (Dabbs and Mallinger, 1999; Evans, Neave, Wakelin, and Hamilton, 2008;
92
Hodges-Simeon, Gurven, and Gaulin, 2015; Jost, Fuchs, Loeffler, Thiery, Kratzsch, Berger,
93
and Engel, 2018; although see Arnocky, Hodges-Simeon, Ouellette, and Albert, 2018; 94
Bruckert et al., 2006; Puts, Apicella, and Cardenas, 2012), which is known to act as an 95
immunosuppressant (Foo, Nakagawa, Rhodes, and Simmons, 2017). As men possessing high 96
testosterone levels should have a better immune system to bear its costs, lower F0s may thus 97
signal health status as a result of possessing ‘good genes’ (Folstad and Karter, 1992). If so, 98
females may then be attracted to such men as they represent higher genetic quality mates 99
(Arnocky et al., 2018; Hodges-Simeon et al., 2015). Secondly, there is intrasexual selection, 100
which corresponds to competition among same-sex individuals. For instance, it has been 101
5 regularly shown that lower F0s and Dfs were perceptually associated to larger, stronger, more 102
masculine and more socially and physically dominant men (Hodges-Simeon et al., 2010;
103
Pisanski, Fraccaro, Tigue, O’Connor, and Feinberg, 2014a; Puts, Gaulin, and Verdolini, 2006;
104
Puts, Hodges, Cárdenas, and Gaulin, 2007; Rendall, Vokey, and Nemeth, 2007; Sell et al.,
105
2010), with F0 being recently argued to signal formidability (Puts and Aung, 2019; although 106
see Feinberg, Jones, and Armstrong, 2019). Additionally, lower F0-SD (i.e., monotonous 107
voices) has been hypothesized to be a marker of self-confidence and experience and is also 108
associated to perceived dominance in men (Hodges-Simeon et al., 2010). In this context, if 109
women are attracted to more dominant and formidable men, then the formers might display a 110
preference for lower F0s and Dfs. Lastly, a sensory bias may explain vocal attractiveness 111
relationships. Humans possess a cognitive bias to associate deeper vocal frequencies to 112
perceptually larger individuals (Pisanski and Rendall, 2011; Rendall, Vokey, and Nemeth, 113
2007; Xu et al., 2013), although the relationships between vocal pitch and resonant 114
frequencies with height and weight are relatively weak (Pisanski, Fraccaro, Tigue, O’Connor, 115
Röder, Andrews, Fink, DeBruine, Jones, and Feinberg, 2014b). Nonetheless, if women 116
actually prefer larger men as mates, then they might also prefer men with perceptually deeper 117
vocal features. 118
According to the source-filter theory of speech production (Taylor and Reby, 2010), 119
the underlying mechanisms of phonation in humans rests on the larynx (the source) and the 120
subsequent filtering of vocal signals by the supralaryngeal vocal tract (the filter). The airflow 121
expelled from the lungs and forced out through the glottis causes mechanical oscillations of 122
the vocal folds within the larynx (i.e., Bernoulli’s principle). The tension, length and thickness 123
of vocal folds determine the vocal height, which acoustically correlates to the fundamental 124
frequency (i.e., F0). Namely, the sound waves produced by the vocal folds’ oscillations travel 125
through the pharyngeal, the oral and (possibly) the nasal cavities before being expelled. 126
6 During this process, the vocal tract configuration filters the laryngeal flow generated at the 127
glottis by amplifying some frequencies to the detriment of others and, thereby, producing the 128
formant frequencies that lead to the perception of vocal timbre. Moreover, the movements of 129
the articulatory organs involved in speech production such as the tongue, the lips and the 130
palate modify the shape of the vocal tract, which determine the frequencies associated to the 131
different speech sounds. In humans, both pitch and resonant frequencies display salient sex 132
differences. Indeed, at puberty, males experience a significant influence of androgens, 133
especially testosterone, which entails important consequences on larynx size and vocal folds 134
thickness and length, which acoustically lower the voice pitch, deepen the resonant 135
frequencies and reduce their spacing. This proximate mechanism explains why before 136
puberty, boys and girls exhibit similar vocal frequencies (Fitch, 1999), until the former 137
practically do not overlap with those of adults females (Titze, 1989). Additionally, in the adult 138
life, inter-individual variations in vocal features are influenced by age (Linville and Fisher, 139
1985; Shipp et al., 1992), circulating androgens level (Abitbol, Abitbol, and Abitbol, 1999; 140
Akcam, Bolu, Merati, Durmus, Gerek, and Ozkaptan, 2004; Dabbs and Mallinger, 1999) and, 141
possibly, to the exposure of testosterone in-utero (Fouquet, Pisanski, Mathevon, and Reby, 142
2016). 143
Fundamental and formant frequencies aside, a few understudied vocal features also 144
seem to contribute to vocal quality, such as vocal breathiness and vocal roughness. Firstly, 145
vocal breathiness can be captured by the harmonics-to-noise ratio (HNR), which corresponds 146
to a ratio between periodic components (i.e., the harmonics, which are multiple integer of the 147
F0) and a non-periodic component (i.e., noise) comprising a segment of voiced speech 148
(Teixeira, Oliveira, and Lopes, 2013). More specifically, this ratio reflects the efficiency of 149
speech production. The greater the airflow expelled from the lungs into energy of vibration of 150
the vocal folds, the higher the HNR, which is perceptually associated with a more sonorant 151
7 and harmonic voice. Conversely, a lower HNR is generally associated with a perceptually 152
asthenic, dysphonic and breathier voice. Secondly, vocal roughness can be captured by the 153
jitter, a measure of the F0 disturbance, which is defined as the parameter capturing the 154
frequency variation at the glottis from cycle to cycle in the sound wave (Hillenbrand, 1988;
155
Rabinov, Kreiman, Gerratt, and Bielamowicz, 1995; Wendahl, 1966). More specifically, the 156
jitter measures the regularity of the vocal folds during successive periods of oscillations. The 157
higher the jitter, the “rougher” sounds the voice. Although little is known about their 158
physiological mechanisms, it has been suggested that both acoustic components may be 159
sensitive to hormonal influx as they both relate to the oscillations of the vocal folds, which 160
possess receptors to circulating androgens (Pisanski, Jones, Fink, O'Connor, DeBruine, Röder, 161
and Feinberg, 2016). 162
Vocal breathiness has been suggested to be an important component of vocal 163
attractiveness in female voices (Babel et al., 2014; Van Borsel, Janssens, and De Bodt, 2009), 164
but significant relationships have been reported in both sexes (Šebesta, Kleisner, Tureček, 165
Kočnar, Akoko, Třebický, and Havlíček, 2017; Xu et al., 2013). Thus, lower HNR profiles 166
(i.e., breathy voices) have been suggested be more attractive. Additionally, it has been 167
suggested to soften the aggressiveness of males with larger body size (Xu et al., 2013), which 168
in turn could increase their overall attractiveness towards females. On the other hand, little 169
evidence is actually known on whether vocal roughness (as measured with the jitter) 170
significantly contributes to perceived vocal attractiveness as studies that have directly tackled 171
the topic have led to mixed results (Babel et al., 2014; Hughes, Mogilski, & Harrison, 2014; 172
Hughes, Pastizzo, & Gallup, 2008). 173
Interestingly, experimental consensus regarding the F0 strongly suggests that women’s 174
vocal preferences are consistent independently of the culture under study. Negative 175
relationships have been mostly reported in English-speaking populations such as Americans 176
8 (Hodges-Simeon et al., 2010), Canadians (Feinberg et al., 2005; Pisanski and Rendall, 2011), 177
British (Jones et al., 2010; Vukovic et al., 2008), Scottish (Saxton, Debruine, Jones, Little, 178
and Roberts, 2009), and Australians (Simmons, Peters, and Rhodes, 2011), but also in Dutch 179
(Collins, 2000), German (Weiss and Burkhardt, 2010), Czech (Valentová, Roberts, and
180
Havlíček, 2013), Latvians (Skrinda, Krama, Kecko, Moore, Kaasik, Meija, Lietuvietis, 181
Rantala, and Krams, 2014) and in a small sample of French speakers (Bruckert et al., 2006). 182
Although evidence is scarce, a few findings challenges this view, suggesting that vocal 183
attractiveness may rest on different acoustic cues depending on the culture under study. For 184
instance, one study reported that in a Filipino-speaking group sample, both nulliparous and 185
breastfeeding women showed a preference for feminized (i.e., higher F0) rather than 186
masculinized voice pitch (i.e., lower F0) (Shirazi, Puts, and Escasa-Dorne, 2018). In the 187
Hadzas, it has also been reported that women who are breastfeeding prefer men with higher 188
pitch voices as mates, those who are not breastfeeding preferring lower pitch male voices 189
(Apicella and Feinberg, 2009). Interestingly, another study found that Namibian men’s vocal 190
attractiveness could be predicted by their degree of vocal breathiness (measured through the 191
HNR) and not by their voice pitch (Šebesta et al., 2017). 192
In this context, the aim of this replication study is to investigate culture-dependency 193
for vocal attractiveness in an underrepresented language (i.e., French) as well as investigating 194
attractiveness relationships with understudied acoustic features of vocal quality. 195
Material and Methods 196
This study was conducted in Montpellier, France. The French National Commission of 197
Informatics and Liberty approved the experimental designs of the present study (CNIL 198
number 2-17029). Prior to the study, all participants provided the investigator with their 199
written consent. 200
a. Stimuli 201
9 An aggregate of 58 male participants (mean age = 23; SD = 3.36), native speakers of French, 202
produced the vocal stimuli. These participants were drawn from another study (Suire, 203
Raymond, and Barkat-Defradas, 2018; two of which were not included in that study). They 204
were seated in a quiet, anechoic, soundproof room equipped with a Sennheiser™ BF 515 205
microphone connected to a PC located in another room. Vocal samples consisted in the 206
recording of a short utterance ‘Dans la vie, je pense toujours prendre les bonnes decisions et 207
c’est pour cela que je vais gagner’ (i.e., ‘In life, I always think I’ll make the right decision 208
and that is why I will win’). To control for intensity, participants were asked to speak at a 209
constant distance of 15 cm from the microphone. All recordings were encoded using the 210
Adobe© Audition CS6 at a sampling rate of 44 kHz – 32 bit – mono then saved as .wav files. 211
b. Acoustic analyses 212
All recordings were analyzed using the Praat© voice analysis software (version 6.0.31, 213
Boersma and Weenink, 2018). The mean fundamental frequency (F0) and its variation (F0-214
SD) were measured using the autocorrelation method with a pitch floor of 75 Hz and a ceiling 215
of 300 Hz (Praat’s recommendation), with other settings kept as default. The harmonics-to-216
noise ratio (HNR, in dB) and the local jitter (%), which corresponds to the average absolute 217
difference between consecutive periods, divided by the average period, and calculated in 218
percentage, were measured across the entire utterance using the same settings as the F0. The 219
local jitter corresponds to the jitter ratio, which is commonly used to describe vocal 220
perturbations (Jones, Trabold, Plante, Cheetham, and Earis, 2001). Additionally, intensity 221
(dB) was retrieved using Praat’s default settings. Formant frequencies (F1 to F4) were 222
measured at each glottal pulse, targeting voiced speech only, using a formant ceiling of 5000 223
Hz (Praat’s recommendation), then averaged across the entire utterance. Then, the formants’ 224
dispersion (Df) was calculated using the following formula (Fitch, 1997): 225
10 where Df is the formant dispersion (in Hz), N is the total number of formants measured, and 226
Fi is the frequency (in Hz) of formant i. Lastly, we computed the formants’ position (Pf) 227
using the method described in Puts et al. (2012), which has been argued to be sexually more 228
dimorphic than Df. To compute the formants’ position, we used female vocal stimuli that 229
were drawn from the same study of the male vocal stimuli (nfemale = 68, Suire et al. 2018).
230
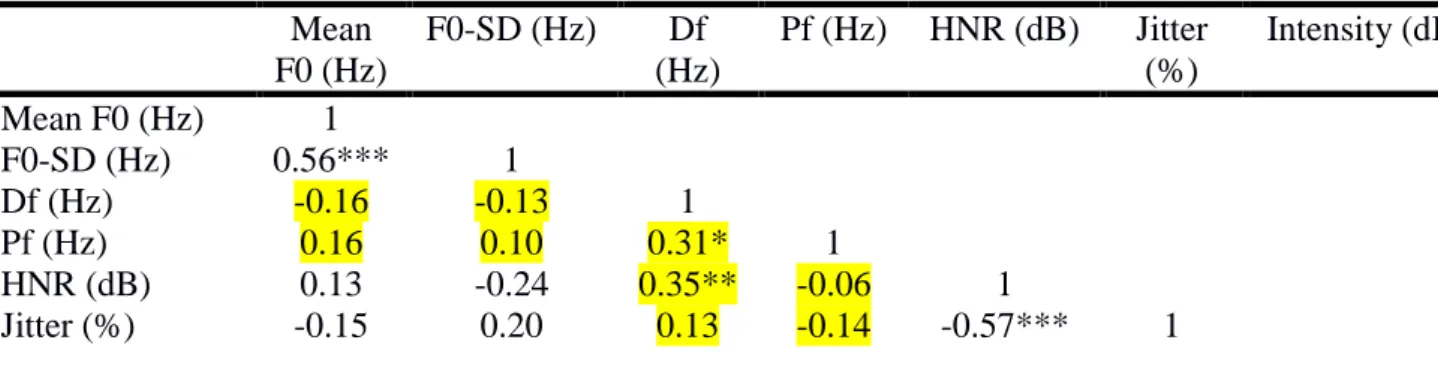
Descriptive statistics of the male vocal stimuli for each acoustic feature are reported in 231
Table 1 and their zero-order correlations in Table 2. Mean F0 was positively correlated with 232
F0-SD (r = 0.56, p < 0.001). Df was positively associated to Pf (r = 0.31, p = 0.019) and HNR 233
(r = 0.35, p = 0.008). Lastly, HNR was negatively correlated with jitter (r = -0.57, p < 0.001). 234
All these correlations are consistent with those reported in the literature (for F0 and F0-SD, 235
see Hodges-Simeon et al., 2010; for Df and Pf see the open data of Han, Wang, Fasolt, Hahn, 236
Holzleitner, Lao, DeBruine, Feinberg and Jones, 2018; for jitter and HNR, see de Krom, 237
1993), except the correlation between Df and HNR, which to our knowledge was not reported 238 elsewhere. 239 n = 58 Mean SD Ranges Mean F0 (Hz) 114.47 11.84 85.44 – 140.07 F0-SD (Hz) 15.16 5.06 6.97 – 28.31 Df (Hz) 1086.78 36.60 1005 – 1181 Pf (Hz) -1.61 0.47 -2.47 – -0.65 HNR (dB) 11.32 1.37 7.93 – 14.94 Jitter (%) 2.68 0.47 1.83 – 4.41 Intensity (dB) 64.73 3.61 53.96 – 76. 93
Table 1. Descriptive statistics of the acoustic characteristics of the vocal stimuli. 240 241 Mean F0 (Hz) F0-SD (Hz) Df (Hz) Pf (Hz) HNR (dB) Jitter (%) Intensity (dB) Mean F0 (Hz) 1 F0-SD (Hz) 0.56*** 1 Df (Hz) -0.16 -0.13 1 Pf (Hz) 0.16 0.10 0.31* 1 HNR (dB) 0.13 -0.24 0.35** -0.06 1 Jitter (%) -0.15 0.20 0.13 -0.14 -0.57*** 1
11
Intensity (dB) 0.13 0.02 0.24 0.05 0.22 -0.08 1
Table 2. Zero-order correlations between each acoustic feature for the vocal stimuli. 242
Significance code: *** p < 0.001; ** p < 0.01; * p < 0.05. 243
c. Experimental procedure 244
The experimental procedure was automated on an online computer-interfaced program. 224 245
French female raters participated in a perceptual study after they self-reported in a 246
questionnaire their age, origins of parents and grandparents (to control for potential cultural 247
preferences), sexual orientation (to control for sexual preferences) and whether they suffered 248
from a hearing impairment (note that other information were reported but are not used in the 249
present study). After filling out the questionnaire, female raters were presented with a series 250
of 11 choices each including a pair of voices. For each pair, two stimuli were randomly 251
selected from the whole pool of vocal stimuli. The two vocal stimuli were randomized in their 252
position presented in each pair (left or right position) on the computer screen. Judges were 253
asked to choose the most attractive vocal stimulus by clicking on it. Participants were allowed 254
to listen to the stimuli as much as they wanted. However, when the female judge made her 255
choice, she could not go back to the previous one anymore. To measure intra-rater reliability, 256
the second and third pairs were the same as the tenth and eleventh pairs. 257
Although a forced choice paradigm is usually implemented with experimentally 258
manipulated vocal stimuli (e.g. Jones et al., 2010; Re, O’Connor, Bennett, and Feinberg, 259
2012), there is fundamentally no advantage or disadvantage between a forced-choice 260
paradigm and a correlational rating study for either manipulated or non-manipulated stimuli. 261
Crucially, it does not yield different results (e.g. for women’s preferences of men’s F0, for 262
experimental designs see: Vukovic et al. 2008; Jones et al. 2010; Re et al. 2012; and for 263
correlational designs see: Feinberg et al. 2005; Hodges-Simeon et al. 2010; Pisanski and 264
Rendall 2011). 265
We stopped collecting data when each voice of the 58 voices was heard at least 40 266
12 times in order to obtain statistically relevant data. In the end, the mean number of times a 267
voice has been heard is M ± SD = 54.14 ± 6.55, with 72 and 42 times respectively for the 268
most and least heard voices. 269
Out of the 225 female participants who completed the questionnaire, 137 participants 270
completed all 11 decisions, 28 participants skipped some of the decisions (mean number of 271
skipped decisions = 8.75), for a total of 1570 decisions in our analyses. Description of the 272
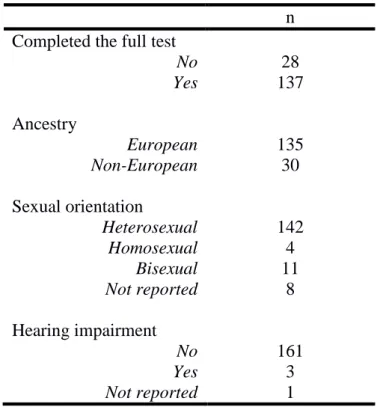
judges’ characteristics that completed at least one pair (n = 165, M ± SD = 28.95 ± 14.16) are 273
given in Table 3. 274
n
Completed the full test No Yes 28 137 Ancestry European Non-European 135 30 Sexual orientation Heterosexual Homosexual Bisexual Not reported 142 4 11 8 Hearing impairment No Yes Not reported 161 3 1
Table 3. Number of judges for each of the following categories: those who completed the full 275
test (i.e., heard all the pairs), grandparents’ ancestry, sexual orientation and hearing 276
impairments. 277
d. Data analysis 278
To analyze women’s preferences for men’s voices, a generalized linear mixed model 279
(GLMM) was used with the response variable being if the female judge chose or not the voice 280
presented to her on the left position. The GLMM was fitted with a binomial error structure 281
since the response variable consisted in a discrete probability distribution of the number of 282
13 successes in a sequence of several independent trials. In order to explore acoustics’ 283
preferences, seven predictor variables were computed and corresponded to the differences 284
observed in mean F0, F0-SD, Df, Pf, HNR, jitter and intensity between the two vocal stimuli 285
(numerical variables that were standardized). Judges’ age (standardized variable), ancestry 286
(i.e., European or non-European grandparents’) and sexual orientation (i.e., heterosexual and 287
non-heterosexual) were added as control variables and put in interaction with the differences 288
in acoustics characteristics to assess their influence on voice preferences. Judges’ identities 289
and the vocal stimuli were added as random effects as intercepts only. A symbolic 290
representation of the GLMM is given in the supplementary material. 291
GLMMs with and without the control variables were performed to explore any 292
statistical differences. Moreover, we performed two additional GLMMs, one without 293
individuals with hearing impairment and one without individuals who did not report sexual 294
orientation (these individuals were treated as non-heterosexual in the main GLMM). The 295
significance of each predictor in all GLMMs was assessed from the comparison of the model 296
excluding the predictor with the model including all the other predictors (i.e., likelihood-ratio 297
chi-square tests, ANOVA type III). Additionally, since some acoustic variables are highly 298
correlated (see Table 2), we conducted multicollinearity checks on the GLMMs using the 299
variation inflation factors (VIFs). 300
All statistical analyses were performed under the R software (version 3.4.0), using the 301
following packages: ‘lme4’ to build the generalized linear models with random effects (Bates,
302
Mächler, Bolker, and Walker, 2014), ‘car’ to compute the statistical significance of each 303
predictor and check potential multicollinearity problems for the GLMMs (Fox, Weisberg, and 304
Fox, 2011) and ‘MuMIn’ to compute the pseudo-R2 (Bartoń, 2018). In order to illustrate the 305
results with figures, we used ‘boot’ to transform the coefficients of the GLMMs back into 306
probabilities (Canty and Ripley, 2012), ‘dplyr’ to compute the predictions of the model 307
14
(Wickham, François, Henry, and Müller, 2018) and ‘ggplot2’ for the resulting figures 308
(Wickham, 2009). 309
Results 310
Descriptive statistics of the mean difference in acoustic features are reported in Table 4. 311 Mean SD Ranges Difference in mean F0 -0.38 16.70 -53.28 – 49.84 Difference in F0-SD -0.066 6.89 -20.79 – 20.43 Difference in Df 1.25 51.73 -176.66 – 176.66 Difference in Pf 0.003 0.66 -1.81 – 1.81 Difference in HNR -0.0086 1.91 -5.73 – 5.58 Difference in jitter 0.013 0.64 -2.58 – 2.58 Difference in intensity 0.065 5.06 -20.63 – 22.97
Table 4. Descriptive statistics for the unstandardized mean difference for each acoustic feature 312
summarized over the total number of observations (n = 1570). 313
We computed intra-rater reliability scores by calculating the proportion of identical 314
chosen vocal stimuli between the second and third first pairs with the tenth and eleventh pairs. 315
Intra-rater reliability was high: M ± SD = 0.791 ± 0.257, i.e., judges considered on average 316
more than 2/3 the same voices as attractive. 317
Results of the main GLMM are reported in Table 5. VIFs were all inferior to 4, 318
indicating no problems of multicollinearity. When presented with two voices, women 319
preferred lower F0 ( = 24.89, p < 0.001), higher F0-SD profiles ( = 34.00, p < 0.001) and 320 louder stimuli ( = 7.52, p = 0.006). 321 Estimate SE χ2 p value Intercept 0.09 0.06 / / Difference in mean F0 -0.49 0.10 24.89 <0.001 Difference in F0-SD 0.53 0.09 34.00 <0.001 Difference in Df 0.18 0.10 3.26 0.070 Difference in Pf -0.06 0.08 0.56 0.452 Difference in HNR -0.12 0.10 1.23 0.266 Difference in jitter -0.04 0.09 0.27 0.602 Difference in intensity 0.18 0.06 7.52 0.006
Interactions with age
15 Difference in F0-SD 0.04 0.09 0.25 0.616 Difference in Df 0.13 0.09 2.06 0.151 Difference in Pf -0.06 0.07 0.70 0.399 Difference in HNR -0.11 0.09 1.31 0.251 Difference in jitter 0.10 0.08 1.61 0.204 Difference in intensity 0.15 0.06 5.65 0.017
Interactions with ancestry
Difference in F0 -0.008 0.22 0.001 0.968 Difference in F0-SD -0.41 0.20 3.97 0.046 Difference in Df 0.04 0.23 0.03 0.863 Difference in Pf -0.17 0.18 0.82 0.364 Difference in HNR -0.01 0.25 0.003 0.953 Difference in jitter 0.06 0.21 0.09 0.752 Difference in intensity -0.10 0.17 0.37 0.539
Interactions with sexual orientation
Difference in F0 0.15 0.24 0.38 0.534 Difference in F0-SD -0.54 0.23 5.49 0.019 Difference in Df -0.14 0.23 0.36 0.544 Difference in Pf -0.10 0.18 0.28 0.593 Difference in HNR -0.11 0.28 0.15 0.691 Difference in jitter 0.18 0.24 0.60 0.436 Difference in intensity 0.27 0.18 2.29 0.130
Table 5. Results of the GLMM predicting women’s preferences for men’s voices, (nstimuli =
322
58, njudges = 165, nobservations = 1570). For each variable, the χ2 and the p values associated from
323
the likelihood-ratio chi-square test of the comparison between the full model and the model 324
without the predictors and the control variables are given (ANOVA type III). For the 325
categorical variables’ ‘ancestry’ and ‘sexual orientation’, the estimates are given compared to
326
the reference category (1 = European ancestry and 1 = heterosexual). P values are considered 327
significant at the 0.05 threshold (in bold). The degrees of freedom is 1 for every test. 328
For easier understanding of the model’s output, the predicted probabilities of 329
considering a voice more attractive than the other within the same pair were plotted against 330
the range of differences in mean F0, F0-SD and intensity between the two voices (Figure 1). 331
Figure 1. Probabilities of being picked as more attractive plotted against the standardized 332
differences between the two voices heard in a) mean F0, b) F0-SD and c) intensity. The black 333
curves represent the model’s predictions associated with 95% confidence intervals (in grey). 334
335 336
16 a) b) 337 338 c) 339 340
We also computed the predicted probability that a voice would be considered more 341
attractive when it is 1 standard deviation lower and 1 standard deviation higher than the 342
opposite one on the basis of their F0, F0-SD and intensity (Figure 2). A voice with a mean F0 343
that is one standard deviation lower than the other in the same pair has a probability of being 344
picked as more attractive up to ~65%, likewise, a voice with a F0-SD which is 1 standard 345
deviation higher has a probability of being picked as more attractive up to ~65%. 346
Figure 2. Barplots of the predicted probabilities that a voice would be considered more 347
attractive when it is 1 standard deviation lower and 1 standard deviation higher than the other 348
voice, as a function of its a) mean F0, b) F0-SD and c) intensity. Bars are associated with 95%
349
confidence intervals.
350 351
17 a) b) 352 353 c) 354 355
Additionally, female judges did not show directional preferences for Df, Pf, HNR or 356
jitter (all p values > 0.05). Judges’ age had a significant influence on their preferences for 357
intensity ( = 7.52, p = 0.006), i.e., relatively older women preferred louder vocal profiles. 358
Women with non-European ancestry and non-heterosexual women showed a preference for 359
lower F0-SD profiles (respectively = 3.97, p = 0.046; = 5.49, p = 0.019). The model 360
explained 12% of the variance in vocal preferences, including fixed and random effects. 361
Lastly, the variance of the random intercept for judges was higher than the vocal stimuli 362
(judges = 0.07; stimuli = 0.01).
363
The model without ancestry and the one without sexual orientation were not 364
18 statistically different from the full model (respectively = 10.42, p = 0.165; = 9.96, p = 365
0.190). Removing age from the model was statistically different from the full model ( = 366
18.74, p = 0.009). The models without judges with hearing impairment and without judges 367
who did not report sexual orientation did not qualitatively change the results. In all models, 368
the main results remained the same: female judges still considered voices with lower F0, 369
higher F0-SD and higher intensity as more attractive. All models without the control variables 370
are given in the supplementary material. 371
Discussion 372
Women significantly preferred lower vocal pitch in men. This result is consistent with 373
previous findings in English-speaking populations (Feinberg et al., 2005; Hodges-Simeon et
374
al., 2010; Hughes et al., 2010; Jones et al., 2010; Pisanski and Rendall, 2011; Vukovic et al.,
375
2008) and several other languages (Bruckert et al., 2006; Skrinda et al., 2014; Valentová et
376
al., 2013; Weiss and Burkhardt, 2010). Moreover, this finding has been replicated with a 377
similar or higher number of stimuli and judges than most of these studies (see Hodges-Simeon 378
et al., 2010 for an example of a study with a higher number of stimuli). As vocal height 379
correlates to several biological and social information about men, such as testosterone levels 380
(Dabbs and Mallinger, 1999; Evans et al., 2008; Hodges-Simeon et al., 2015), sexually related 381
behaviors (Hughes et al., 2004), body size assessments (Pisanski et al., 2014a), as well as 382
signaling social dominance (Puts et al., 2007) and social rankings (Cheng, Tracy, Ho, and 383
Henrich, 2016), women may rely on this salient acoustic cue as an assessment of sexual 384
partner quality. Several studies have reported that men exhibiting relatively low-pitched 385
voices reported a higher mating success in industrialized societies (Hodges-Simeon, Gaulin, 386
and Puts, 2011; Puts, 2005; Puts et al., 2006; although see Suire et al., 2018) and a higher 387
reproductive success in a hunter-gatherer society (Apicella, Feinberg, and Marlowe, 2007; 388
although see Smith, Olkhov, Puts, and Apicella, 2017). 389
19 Moreover, French women also significantly preferred higher F0-SD profiles in men, 390
that is, more expressive (or less monotonous) voices. Although our study had a higher number 391
of judges and stimuli than the two others that reported the same relationship (Bruckert et al.,
392
2006; Leongómez et al., 2014), another study had a higher number of stimuli but less judges 393
(Hodges-Simeon et al., 2010). Nonetheless, while self-confidence and experience can be 394
expressed through monotonous voices, to which some women may be more attracted to 395
(Hodges-Simeon et al., 2010), our results do not follow the same tendency. A possible 396
explanation may be that more marked intonation patterns might be perceived as more 397
attractive as it is a marker of perceived state-dependent qualities such as positive emotions 398
(e.g. joy and happiness) (Banse and Scherer, 1996), conversational interest as well as 399
emotional activation (i.e., arousal) and intensity (Laukka, Juslin, and Bresin, 2005). 400
Ultimately, expressive voices could reflect the speaker’s current mental-health state since it 401
has been previously reported that clinically depressed patients show typically reduced F0-SD 402
values (Ellgring and Scherer, 1996). Thus, higher F0 variability may be associated to more 403
enthusiastic and extroverted individuals, to which women may be more attracted. In this 404
sense, our result is consistent with previous findings in both men and women (Bruckert et al.,
405
2006; Leongómez et al., 2014). Although it has been suggested to be a cue of femininity, as 406
women display twice as much F0 variation, we suggest that irrespective of sex, higher F0-SD 407
profiles should be perceived as more attractive. 408
No directional preferences were observed for the formants’ dispersion and position, 409
which corroborates some previous findings (Babel et al., 2014; Feinberg et al., 2005), using a 410
higher or similar number of stimuli and a higher number of judges. Several studies have 411
suggested that Df may be a more important vocal cue to assess in human competitive settings. 412
Indeed, it has been reported that lower Df patterns were associated to perceived dominance in 413
men (Puts et al., 2007; Wolff and Puts, 2010). This can be explained by the fact that lower Df 414
20 patterns are associated to larger body size (Pisanski et al., 2016) and to perceived larger 415
individuals (Bruckert et al., 2006; Collins, 2000; Rendall et al., 2007). Interestingly, females 416
were also found to be more sensitive to this vocal cue than men after hearing women’s voices 417
(Puts, Barndt, Welling, Dawood, and Burriss, 2011). Such results emphasize the idea that 418
same-sex individuals may use Df to track competitor’s masculinity and/or femininity. 419
Similarly, some research suggest that the formants’ position may signal threat potential 420
among men (Puts et al., 2012), although a recent study found no correlations to physical 421
strength (Han et al., 2018). 422
Our results also indicated that vocal breathiness and roughness (assessed respectively 423
through the HNR and the jitter ratio) did not significantly contribute to men’s vocal 424
attractiveness, using a higher number of stimuli and judges than previous studies (Babel et al., 425
2014; Hughes et al., 2014, 2008). Although one study reported that breathier voices were 426
found to be more attractive in Namibian men, ours did not (Šebesta et al., 2017). Another 427
study found that perceived ‘breathy’ voices were significantly more attractive in both sexes 428
(Xu et al., 2013), although the underlying acoustic component was not clearly identified in 429
this study. Lack of significant findings for breathiness suggests that it is more associated with 430
feminine vocal quality, as previously suggested (Henton and Bladon, 1985; Van Borsel et al., 431
2009). It is also possible that when assessing attractiveness, women may be particularly 432
attuned to the vocal features that are indicative of one’s heritable mate quality, such as the F0. 433
In this context, breathiness and roughness may not reliably indicate mate or competitor 434
quality for listeners, at least in men. Although they are correlated to other body features (see 435
Pisanski et al., 2016 for an extensive study on that matter), further studies are needed to 436
understand whether these two acoustic components of the human voice are perceptually 437
salient in influencing vocal attractiveness. Otherwise, it has been suggested that HNR and 438
jitter may be indicative of current hormonal profiles as both parameters relate to the 439
21 oscillations of the vocal folds, which possess many cellular receptors to androgens (Pisanski 440
et al., 2016). 441
An important limitation to the current study is that we did not investigate the effects of 442
women’s menstrual cycle upon perceived vocal attractiveness. Indeed, there was more 443
variations between females judges than between vocal stimuli (judges = 0.07; stimuli = 0.01),
444
suggesting, for example, that the timing of the ovulatory cycle may play a role. In fact, it has 445
been long suggested that menstrual phase and mating contexts may influence women’s 446
preferences for masculine vocal attributes (Feinberg et al., 2006; Pisanski, Hahn, Fisher, 447
DeBruine, Feinberg, and Jones, 2014c; Puts, 2005). Under the ‘good genes ovulatory shift 448
hypothesis’, women in their fertile phase are predicted to shift their preferences towards mates 449
indicating high genetic quality (i.e., more masculine men, to which women may be 450
particularly attracted to for a short-term relationship, such as a one-night stand), as opposed to 451
mates indicating high parental investment in their non-fertile phase (i.e., less masculine men, 452
to which women may be particularly attracted to for a long-term, committed and romantic 453
relationship) (Jünger, Kordsmeyer, Gerlach, and Penke, 2018). These shifting preferences 454
have been suggested to be an adaptive strategy in order to maximize fitness benefits for 455
women. 456
For instance, Puts (2005) found that females judged lowered pitch voices more 457
attractive than the same voices raised in pitch in their fertile phase of their ovulatory cycle 458
with respect to a short-term context. Similarly, Feinberg et al. (2006) found that women’s 459
masculinity preferences for low-pitched voices were stronger during the fertile phase. 460
Although the effect was not significant, Pisanski et al. (2014c) also reported stronger 461
preferences for masculinized voice pitch. Lastly, one study has reported that women in their 462
fertile phase significantly preferred lowered Df when questioned for both short- and long-term 463
relationships (Hodges-Simeon et al., 2010). The authors also found that mean F0 and 464
22 attractiveness was strongest for fertile-phase women rating short-term attractiveness, while 465
F0-SD was more attractive for non-fertile phase female rating short-term attractiveness and 466
fertile females rating long-term attractiveness. However, recent evidence have suggested that 467
women menstrual cycle does not influence their preferences for masculinized bodies and 468
faces (Jones, Hahn, Fisher, Wang, Kandrik, Han, Fasolt, Morrison, Holzleitner, O'Shea,
469
Roberts, Little, and DeBruine, 2017; Marcinkowska, Galbarczyk, and Jasienska, 2018). Using 470
a large sample size and a more methodologically grounded procedure, Jünger et al. (2018)
471
found no effect of the cycle phase, conception risk and steroid hormone levels on women’s 472
auditory preferences for men’s voices. Further research is thus needed to reliably investigate 473
if the menstrual cycle has a significant effect over shifted preferences. In any case, not 474
controlling for this factor will only provide conservative results, under the hypothesis that the 475
time of the menstrual cycle is randomly distributed among the participating women. 476
Other limitations include the difference in age between men who provided the vocal 477
stimuli and the female judges. However, in our sample both the youngest individual who 478
provided the vocal stimuli and the youngest female judge were aged 18, which is largely 479
above the age where mate preferences develop and become relevant (age 13-15, Saxton, 480
Caryl, and Craig Roberts, 2006; Saxton, DeBruine, Jones, Little and Roberts, 2009). 481
Moreover, an interesting perspective for future research would be to investigate possible non-482
linear effects of preferences as a function of vocal parameters. Indeed, extreme values for a 483
particular vocal parameter may be perceived as pathological (as it is the case for high values 484
of jitter and low values of HNR, Teixeira et al., 2013) or perceived as immature and/or too 485
feminine (e.g. high F0). To our knowledge, only one study has tackled this topic in women’s 486
preferences for men’s F0, and it was found that women did not prefer vocal pitches below the 487
~96 Hz threshold. This suggests that preferences may contribute to stabilizing selection 488
pressure for low pitch in men’s voices (Re et al., 2012 IL Y AUSSI LETUDE DE SAXTON). 489
23 Interestingly, in men’s preferences for the F0 of women, one study reported a non-linear 490
relationship with attractiveness ratings starting to decrease when the F0 is higher than ~260 491
Hz (Borkowski and Pawlowski 2011), although two studies have reported that there was no 492
upper limit (Feinberg, DeBruine, Jones, and Perrett, 2008; Re et al., 2012). 493
Conclusions 494
The current study adds to the body of literature on vocal attractiveness in an 495
underrepresented language (i.e., French). Although voice pitch findings were replicated, 496
confirming women’s preferences for low-pitched masculine voices, most of the other acoustic 497
features investigated in this study did not yield to significant results, leading us to conclude 498
that variations in resonant frequencies’ spacing, breathiness and roughness do not seem to be 499
important contributors of men’s vocal attractiveness, at least in a French-speaking sample. 500
Further studies should explore these relationships in other cultures so as to reaffirm these 501
findings. 502
Funding sources 503
This research did not receive any specific grant from funding agencies in the public, 504
commercial, or not-for-profit sectors. 505
Declaration of conflicting interests 506
The authors declare that there is no conflict of interest. 507
Data availability 508
The data and the R code from this study can be found at: 509
https://figshare.com/s/cab62d1e411503982c91
510
References 511
Abitbol, J., Abitbol, P., & Abitbol, B. (1999). Sex hormones and the female voice. Journal of 512
Voice, 13(3), 424‑ 446. https://doi.org/10.1016/S0892-1997(99)80048-4
513
Akcam, T., Bolu, E., Merati, A. L., Durmus, C., Gerek, M., & Ozkaptan, Y. (2004). Voice 514
24 Changes after Androgen Therapy for Hypogonadotrophic Hypogonadism: The Laryngoscope, 515
114(9), 1587‑ 1591. https://doi.org/10.1097/00005537-200409000-00016
516
Apicella, C. L., & Feinberg, D. R. (2009). Voice pitch alters mate-choice-relevant perception 517
in hunter-gatherers. Proceedings of the Royal Society B: Biological Sciences, 276(1659), 518
1077‑ 1082. https://doi.org/10.1098/rspb.2008.1542 519
Apicella, C. L., Feinberg, D. R., & Marlowe, F. W. (2007). Voice pitch predicts reproductive 520
success in male hunter-gatherers. Biology Letters, 3(6), 682‑ 684.
521
https://doi.org/10.1098/rsbl.2007.0410 522
Arnocky, S., Hodges-Simeon, C. R., Ouellette, D., & Albert, G. (2018). Do men with more 523
masculine voices have better immunocompetence? Evolution and Human Behavior. 524
https://doi.org/10.1016/j.evolhumbehav.2018.06.003 525
Babel, M., McGuire, G., & King, J. (2014). Towards a More Nuanced View of Vocal 526
Attractiveness. PLoS ONE, 9(2), e88616. https://doi.org/10.1371/journal.pone.0088616 527
Bachorowski, J. A., & Owren, M. J. (1999). Acoustic correlates of talker sex and individual 528
talker identity are present in a short vowel segment produced in running speech. The Journal 529
of the Acoustical Society of America, 106(2), 1054‑ 1063.
530
Banse, R., & Scherer, K. R. (1996). Acoustic profiles in vocal emotion expression. Journal of 531
personality and social psychology, 70(3), 614.
532
Bartoń, K. (2018). MuMIn : Multi-Model Inference. R package version 1.42.1. Consulté à 533
l’adresse https://CRAN.R-project.org/package=MuMIn 534
Bates, D., Mächler, M., Bolker, B., & Walker, S. (2014). Fitting Linear Mixed-Effects Models 535
using lme4. ArXiv:1406.5823 [Stat]. Consulté à l’adresse http://arxiv.org/abs/1406.5823 536
Bruckert, L., Lienard, J.-S., Lacroix, A., Kreutzer, M., & Leboucher, G. (2006). Women use 537
voice parameters to assess men’s characteristics. Proceedings of the Royal Society B: 538
Biological Sciences, 273(1582), 83‑ 89. https://doi.org/10.1098/rspb.2005.3265
25 Canty, A., & Ripley, B. (2012). boot : Bootstrap R (S-Plus) functions. (Version R package 540
version, 1(7).). 541
Cheng, J. T., Tracy, J. L., Ho, S., & Henrich, J. (2016). Listen, follow me : Dynamic vocal 542
signals of dominance predict emergent social rank in humans. Journal of Experimental 543
Psychology: General, 145(5), 536‑ 547. https://doi.org/10.1037/xge0000166
544
Collins. (2000). Men’s voices and women’s choices. Animal Behaviour, 60(6), 773‑ 780. 545
Dabbs, J. M., & Mallinger, A. (1999). High testosterone levels predict low voice pitchamong 546
men. Personality and Individual Differences, 27(4), 801‑ 804. https://doi.org/10.1016/S0191-547
8869(98)00272-4 548
de Krom, G. D. (1993). A cepstrum-based technique for determining a harmonics-to-noise 549
ratio in speech signals. Journal of Speech, Language, and Hearing Research, 36(2), 254‑ 266. 550
Ellgring, H., & Scherer, K. R. (1996). Vocal indicators of mood change in depression. 551
Journal of Nonverbal Behavior, 20(2), 83‑ 110. https://doi.org/10.1007/BF02253071
552
Evans, S., Neave, N., Wakelin, D., & Hamilton, C. (2008). The relationship between 553
testosterone and vocal frequencies in human males. Physiology & Behavior, 93(4‑ 5), 554
783‑ 788. https://doi.org/10.1016/j.physbeh.2007.11.033 555
Feinberg, David R, DeBruine, L. M., Jones, B. C., & Perrett, D. I. (2008). The Role of 556
Femininity and Averageness of Voice Pitch in Aesthetic Judgments of Women’s Voices. 557
Perception, 37(4), 615‑ 623. https://doi.org/10.1068/p5514
558
Feinberg, D.R., Jones, B. C., & Armstrong, M. M. (2019). No Evidence That Men’s Voice 559
Pitch Signals Formidability. Trends in Ecology & Evolution, 34(3), 190‑ 192. 560
https://doi.org/10.1016/j.tree.2018.12.014 561
Feinberg, D.R., Jones, B. C., Law Smith, M. J., Moore, F. R., DeBruine, L. M., Cornwell, R. 562
E., … Perrett, D. I. (2006). Menstrual cycle, trait estrogen level, and masculinity preferences 563
in the human voice. Hormones and Behavior, 49(2), 215‑ 222.
26 https://doi.org/10.1016/j.yhbeh.2005.07.004
565
Feinberg, D.R., Jones, B. C., Little, A. C., Burt, D. M., & Perrett, D. I. (2005). Manipulations 566
of fundamental and formant frequencies influence the attractiveness of human male voices. 567
Animal Behaviour, 69(3), 561‑ 568. https://doi.org/10.1016/j.anbehav.2004.06.012
568
Fitch, W. T. (1997). Vocal tract length and formant frequency dispersion correlate with body 569
size in rhesus macaques. The Journal of the Acoustical Society of America, 102(2), 570
1213‑ 1222. 571
Foo, Y. Z., Nakagawa, S., Rhodes, G., & Simmons, L. W. (2017). The effects of sex 572
hormones on immune function : A meta-analysis: Sex hormones and immune function. 573
Biological Reviews, 92(1), 551‑ 571. https://doi.org/10.1111/brv.12243
574
Fouquet, M., Pisanski, K., Mathevon, N., & Reby, D. (2016). Seven and up : Individual 575
differences in male voice fundamental frequency emerge before puberty and remain stable 576
throughout adulthood. Royal Society Open Science, 3(10), 160395.
577
https://doi.org/10.1098/rsos.160395 578
Fox, J., Weisberg, S., & Fox, J. (2011). An R companion to applied regression (2nd ed). 579
Thousand Oaks, Calif: SAGE Publications. 580
Gelfer, M. P., & Bennett, Q. E. (2013). Speaking Fundamental Frequency and Vowel Formant 581
Frequencies : Effects on Perception of Gender. Journal of Voice, 27(5), 556‑ 566. 582
https://doi.org/10.1016/j.jvoice.2012.11.008 583
Gelfer, M. P., & Mikos, V. A. (2005). The Relative Contributions of Speaking Fundamental 584
Frequency and Formant Frequencies to Gender Identification Based on Isolated Vowels. 585
Journal of Voice, 19(4), 544‑ 554. https://doi.org/10.1016/j.jvoice.2004.10.006
586
Han, C., Wang, H., Fasolt, V., Hahn, A., Holzleitner, I. J., Lao, J., … Jones, B. (2018). No 587
clear evidence for correlations between handgrip strength and sexually dimorphic acoustic 588
properties of voices. BioRxiv. https://doi.org/10.1101/227165 589
27 Henton, C. G., & Bladon, R. A. (1985). Breathiness in normal female speech : Inefficiency 590
versus desirability. Language & Communication. 591
Hillenbrand, J. (1988). Perception of aperiodicities in synthetically generated voices. The 592
Journal of the Acoustical Society of America, 83(6), 2361‑ 2371.
593
https://doi.org/10.1121/1.396367 594
Hillenbrand, J. M., & Clark, M. J. (2009). The role of f 0 and formant frequencies in 595
distinguishing the voices of men and women. Attention, Perception, & Psychophysics, 71(5), 596
1150‑ 1166. https://doi.org/10.3758/APP.71.5.1150 597
Hodges-Simeon, C. R., Gaulin, S. J. C., & Puts, D. A. (2010). Different Vocal Parameters 598
Predict Perceptions of Dominance and Attractiveness. Human Nature, 21(4), 406‑ 427. 599
https://doi.org/10.1007/s12110-010-9101-5 600
Hodges-Simeon, C. R., Gaulin, S. J. C., & Puts, D. A. (2011). Voice Correlates of Mating 601
Success in Men : Examining “Contests” Versus “Mate Choice” Modes of Sexual Selection. 602
Archives of Sexual Behavior, 40(3), 551‑ 557. https://doi.org/10.1007/s10508-010-9625-0
603
Hodges-Simeon, C. R., Gurven, M., & Gaulin, S. J. C. (2015). The low male voice is a costly 604
signal of phenotypic quality among Bolivian adolescents. Evolution and Human Behavior, 605
36(4), 294‑ 302. https://doi.org/10.1016/j.evolhumbehav.2015.01.002
606
Hughes, S. M., Dispenza, F., & Gallup, G. G. (2004). Ratings of voice attractiveness predict 607
sexual behavior and body configuration. Evolution and Human Behavior, 25(5), 295‑ 304. 608
https://doi.org/10.1016/j.evolhumbehav.2004.06.001 609
Hughes, S. M., Farley, S. D., & Rhodes, B. C. (2010). Vocal and Physiological Changes in 610
Response to the Physical Attractiveness of Conversational Partners. Journal of Nonverbal 611
Behavior, 34(3), 155‑ 167. https://doi.org/10.1007/s10919-010-0087-9
612
Hughes, S. M., Mogilski, J. K., & Harrison, M. A. (2014). The Perception and Parameters of 613
Intentional Voice Manipulation. Journal of Nonverbal Behavior, 38(1), 107‑ 127. 614
28 https://doi.org/10.1007/s10919-013-0163-z
615
Hughes, S. M., Pastizzo, M. J., & Gallup, G. G. (2008). The Sound of Symmetry Revisited : 616
Subjective and Objective Analyses of Voice. Journal of Nonverbal Behavior, 32(2), 93‑ 108. 617
https://doi.org/10.1007/s10919-007-0042-6 618
I. Folstad, & Karter A.J. (1992). Parasites, bright males, and the immunocompetence 619
handicap. The America Naturalist, 139(3), 603‑ 622. 620
Jones, B. C., Feinberg, D. R., DeBruine, L. M., Little, A. C., & Vukovic, J. (2010). A domain-621
specific opposite-sex bias in human preferences for manipulated voice pitch. Animal 622
Behaviour, 79(1), 57‑ 62. https://doi.org/10.1016/j.anbehav.2009.10.003
623
Jones, B. C., Hahn, A. C., Fisher, C. I., Wang, H., Kandrik, M., Han, C., … DeBruine, L. M. 624
(2017). No compelling evidence that preferences for facial masculinity track changes in 625
women’s hormonal status. BioRxiv. https://doi.org/10.1101/136549 626
Jones, T. M., Trabold, M., Plante, F., Cheetham, B. M. G., & Earis, J. E. (2001). Objective 627
assessment of hoarseness by measuring jitter. Clinical Otolaryngology and Allied Sciences, 628
26(1), 29‑ 32. https://doi.org/10.1046/j.1365-2273.2001.00413.x
629
Jost, L., Fuchs, M., Loeffler, M., Thiery, J., Kratzsch, J., Berger, T., & Engel, C. (2018). 630
Associations of Sex Hormones and Anthropometry with the Speaking Voice Profile in the 631
Adult General Population. Journal of Voice, 32(3), 261‑ 272.
632
https://doi.org/10.1016/j.jvoice.2017.06.011 633
Jünger, J., Kordsmeyer, T. L., Gerlach, T. M., & Penke, L. (2018). Fertile women evaluate 634
male bodies as more attractive, regardless of masculinity. Evolution and Human Behavior, 635
39(4), 412‑ 423. https://doi.org/10.1016/j.evolhumbehav.2018.03.007
636
Jünger, J., Motta-Mena, N. V., Cardenas, R., Bailey, D., Rosenfield, K. A., Schild, C., … 637
Puts, D. A. (2018). Do women’s preferences for masculine voices shift across the ovulatory 638
cycle? Hormones and Behavior, 106, 122‑ 134. https://doi.org/10.1016/j.yhbeh.2018.10.008 639
29 Laukka, P., Juslin, P., & Bresin, R. (2005). A dimensional approach to vocal expression of 640
emotion. Cognition & Emotion, 19(5), 633‑ 653. https://doi.org/10.1080/02699930441000445 641
Leongómez, J. D., Binter, J., Kubicová, L., Stolařová, P., Klapilová, K., Havlíček, J., & 642
Roberts, S. C. (2014). Vocal modulation during courtship increases proceptivity even in naive 643
listeners. Evolution and Human Behavior, 35(6), 489‑ 496.
644
https://doi.org/10.1016/j.evolhumbehav.2014.06.008 645
Linville, S. E., & Fisher, H. B. (1985). Acoustic characteristics of perceived versus actual 646
vocal age in controlled phonation by adult females. The Journal of the Acoustical Society of 647
America, 78(1), 40‑ 48. https://doi.org/10.1121/1.392452
648
Lyons, M., Lynch, A., Brewer, G., & Bruno, D. (2014). Detection of Sexual Orientation 649
(“Gaydar”) by Homosexual and Heterosexual Women. Archives of Sexual Behavior, 43(2), 650
345‑ 352. https://doi.org/10.1007/s10508-013-0144-7 651
Marcinkowska, U. M., Galbarczyk, A., & Jasienska, G. (2018). La donna è mobile ? Lack of 652
cyclical shifts in facial symmetry, and facial and body masculinity preferences—A hormone 653
based study. Psychoneuroendocrinology, 88, 47‑ 53. 654
Munson, B., McDonald, E. C., DeBoe, N. L., & White, A. R. (2006). The acoustic and 655
perceptual bases of judgments of women and men’s sexual orientation from read speech. 656
Journal of Phonetics, 34(2), 202‑ 240. https://doi.org/10.1016/j.wocn.2005.05.003
657
Pisanski, K., Fraccaro, P. J., Tigue, C. C., O’Connor, J. J. M., & Feinberg, D. R. (2014a). 658
Return to Oz : Voice pitch facilitates assessments of men’s body size. Journal of 659
Experimental Psychology: Human Perception and Performance, 40(4), 1316‑ 1331.
660
https://doi.org/10.1037/a0036956 661
Pisanski, K., Fraccaro, P. J., Tigue, C. C., O’Connor, J. J. M., & Feinberg, D. R. (2014b). 662
Return to Oz : Voice pitch facilitates assessments of men’s body size. Journal of 663
Experimental Psychology: Human Perception and Performance, 40(4), 1316‑ 1331.
30 https://doi.org/10.1037/a0036956
665
Pisanski, K., Fraccaro, P. J., Tigue, C. C., O’Connor, J. J. M., Röder, S., Andrews, P. W., … 666
Feinberg, D. R. (2014). Vocal indicators of body size in men and women : A meta-analysis. 667
Animal Behaviour, 95, 89‑ 99. https://doi.org/10.1016/j.anbehav.2014.06.011
668
Pisanski, K., Hahn, A. C., Fisher, C. I., DeBruine, L. M., Feinberg, D. R., & Jones, B. C. 669
(2014). Changes in salivary estradiol predict changes in women’s preferences for vocal 670
masculinity. Hormones and Behavior, 66(3), 493‑ 497. 671
Pisanski, K., Jones, B. C., Fink, B., O’Connor, J. J. M., DeBruine, L. M., Röder, S., & 672
Feinberg, D. R. (2016). Voice parameters predict sex-specific body morphology in men and 673
women. Animal Behaviour, 112, 13‑ 22. https://doi.org/10.1016/j.anbehav.2015.11.008 674
Pisanski, K., & Rendall, D. (2011). The prioritization of voice fundamental frequency or 675
formants in listeners’ assessments of speaker size, masculinity, and attractiveness. The 676
Journal of the Acoustical Society of America, 129(4), 2201‑ 2212.
677
https://doi.org/10.1121/1.3552866 678
Ptacek, P. H., & Sander, E. K. (1966). Age recognition from voice. Journal of speech and 679
hearing Research, 9(2), 273‑ 277.
680
Puts, D. A., Apicella, C. L., & Cardenas, R. A. (2012). Masculine voices signal men’s threat 681
potential in forager and industrial societies. Proceedings of the Royal Society B: Biological 682
Sciences, 279(1728), 601‑ 609. https://doi.org/10.1098/rspb.2011.0829
683
Puts, David A., & Aung, T. (2019). Does Men’s Voice Pitch Signal Formidability? A Reply 684
to Feinberg et al. Trends in Ecology & Evolution, 34(3), 189‑ 190. 685
https://doi.org/10.1016/j.tree.2018.12.004 686
Puts, David A., Barndt, J. L., Welling, L. L. M., Dawood, K., & Burriss, R. P. (2011). 687
Intrasexual competition among women : Vocal femininity affects perceptions of attractiveness 688
and flirtatiousness. Personality and Individual Differences, 50(1), 111‑ 115. 689
31 https://doi.org/10.1016/j.paid.2010.09.011
690
Puts, David Andrew. (2005). Mating context and menstrual phase affect women’s preferences 691
for male voice pitch. Evolution and Human Behavior, 26(5), 388‑ 397. 692
https://doi.org/10.1016/j.evolhumbehav.2005.03.001 693
Puts, David Andrew, Gaulin, S. J. C., & Verdolini, K. (2006). Dominance and the evolution 694
of sexual dimorphism in human voice pitch. Evolution and Human Behavior, 27(4), 283‑ 296. 695
https://doi.org/10.1016/j.evolhumbehav.2005.11.003 696
Puts, David Andrew, Hodges, C. R., Cárdenas, R. A., & Gaulin, S. J. C. (2007). Men’s voices 697
as dominance signals : Vocal fundamental and formant frequencies influence dominance 698
attributions among men. Evolution and Human Behavior, 28(5), 340‑ 344. 699
https://doi.org/10.1016/j.evolhumbehav.2007.05.002 700
Rabinov, C. R., Kreiman, J., Gerratt, B. R., & Bielamowicz, S. (1995). Comparing Reliability 701
of Perceptual Ratings of Roughness and Acoustic Measures of Jitter. Journal of Speech 702
Language and Hearing Research, 38(1), 26. https://doi.org/10.1044/jshr.3801.26
703
Re, D. E., O’Connor, J. J. M., Bennett, P. J., & Feinberg, D. R. (2012). Preferences for Very 704
Low and Very High Voice Pitch in Humans. PLoS ONE, 7(3), e32719. 705
https://doi.org/10.1371/journal.pone.0032719 706
Rendall, D., Vokey, J. R., & Nemeth, C. (2007). Lifting the curtain on the Wizard of Oz : 707
Biased voice-based impressions of speaker size. Journal of Experimental Psychology: Human 708
Perception and Performance, 33(5), 1208‑ 1219.
https://doi.org/10.1037/0096-709
1523.33.5.1208 710
Saxton, T. K., Caryl, P. G., & Craig Roberts, S. (2006). Vocal and Facial Attractiveness 711
Judgments of Children, Adolescents and Adults : The Ontogeny of Mate Choice. Ethology, 712
112(12), 1179‑ 1185. https://doi.org/10.1111/j.1439-0310.2006.01278.x
713
Saxton, T. K., Debruine, L. M., Jones, B. C., Little, A. C., & Roberts, S. C. (2009). Face and 714