HAL Id: hal-03052901
https://hal.archives-ouvertes.fr/hal-03052901
Submitted on 10 Dec 2020HAL is a multi-disciplinary open access archive for the deposit and dissemination of sci-entific research documents, whether they are pub-lished or not. The documents may come from teaching and research institutions in France or abroad, or from public or private research centers.
L’archive ouverte pluridisciplinaire HAL, est destinée au dépôt et à la diffusion de documents scientifiques de niveau recherche, publiés ou non, émanant des établissements d’enseignement et de recherche français ou étrangers, des laboratoires publics ou privés.
Financial development and macroeconomic
sustainability: modeling based on a modified
environmental Kuznets curve
Adel Ben Youssef, Sabri Boubaker, Anis Omri
To cite this version:
Adel Ben Youssef, Sabri Boubaker, Anis Omri. Financial development and macroeconomic sustainabil-ity: modeling based on a modified environmental Kuznets curve. Climatic Change, Springer Verlag, 2020, 163 (2), pp.767-785. �10.1007/s10584-020-02914-z�. �hal-03052901�
Financial development and macroeconomic sustainability:
1
Modeling based on a modified environmental Kuznets curve
2 3
Adel Ben Youssef 4
University Côte d'Azur, France, ISEM 24, Avenue des Diables Bleus, 06300 Nice, France 5
Sabri Boubaker 6
EM Normandie Business School, Métis Lab, France 7
& 8
International School, Vietnam National University, Hanoi, Vietnam 9 10 Anis Omri 11 (Corresponding author) 12
Department of Business Administration, College of Business and Economics, Qassim University, KSA 13
E-mail address: [email protected] 14
15 16
Abstract 17
Sustainability has become an important and widely applied concept in the environmental economics 18
literature. Despite the numerous studies employing an environmental Kuznets curve (EKC) this model 19
has been critiqued for its incompleteness. This article builds a modified EKC model to examine the 20
contribution of financial development for achieving sustainable development. Using data for 14 21
selected Middle East and North Africa (MENA) countries during 1990-2017, the empirical results 22
show that the EKC hypothesis is valid for per capita CO2 emissions and ecological footprint. The 23
results provide evidence also of the presence of linear and non-linear relationships between financial 24
development and non-sustainability and indicate that financial development is likely to have a small 25
long-term impact on sustainable development. This suggests that current efforts aimed at protecting 26
the environment and achieving sustainability will be ineffective given the extent of the problem. 27
28
Keywords: Financial development; Sustainable development; Modified EKC-model 29 30 31 32 33 34
35
1. Introduction
36
Meeting the sustainable development goals (SDGs) has become a global issue. It has 37
been suggested that their achievement will require a well-developed financial sector to 38
stimulate economic growth, determine efficient resource allocation, and contribute to 39
protecting the environment by financing viable and environmentally friendly projects. Several 40
studies suggest that lack of a well-developed financial sector is a major barrier to sustainable 41
development (e.g. Painuly and Wohlgemuth, 2006; García, 2013; Kayani et al., 2020). 42
Drawing on this research, we contribute to this debate by examining how financial 43
development contributes to macroeconomic sustainability in the MENA countries. 44
45
The present paper has three motivations: (i) the importance of the financial sector from a 46
sustainability perspective, (ii) the strong need for the MENA economies to achieve 47
sustainable development, and (iii) the need for the MENA countries to accelerate their energy 48
transition and acknowledge the importance of the financial sector in advancing economic 49
growth and enhancing sustainability. 50
First, financial development is essential for promoting stable and strong economic 51
growth (Benhabib and Spigel, 2000; Ross, 2004; Thorsten et al., Ross 2004; Federici and 52
Caprioli, 2009). The financial sector allocates capital among economic sectors and contributes 53
to the management of risk. It provides investors with the capital needed to invest in the 54
production of goods and services. However, there is considerable room for financial 55
development in the MENA countries. For instance, in Algeria and Egypt, there is a high 56
proportion of the population that does not have a bank account and a large proportion of the 57
financial transactions in the MENA countries are made in cash. In their approach to 58
addressing sustainable development issues such as climate change, global warming, and 59
environmental pollution, policymakers could exploit this potential for financial development. 60
Second, environmental sustainability has been high on policy agendas since 2010. 61
Most MENA countries signed the Paris agreement during COP 21 and need now to 62
implement more environment-friendly policies. Taking advantage of financial development to 63
implement such policies would be an innovative way to improve the situation in these 64
countries. Global warming and climate change are causing natural disasters and increasing the 65
vulnerability of this region, making greater environmental sustainability an urgent priority for 66
the financial sector. The “greening” of the financial sector and the development of new 67
financial instruments and markets to achieve sustainable development could be part of the 68
solution to the global environmental problem. Sustainable development should become a 69
management priority. Investment and management decisions should consider sustainability 70
(UNEP Finance Initiative, 2007) and the modern financial industry should take into account 71
the constraints on economic sustainability. Environmental awareness among consumers and 72
investors in the developed economies has triggered many and rapid changes in the financial 73
sectors of these countries. In contrast, regulation is driving the greening of the financial sector 74
in the MENA countries. Therefore, understanding the contribution of the financial sector to 75
achieving sustainability in the MENA region has become an urgent issue at the economic and 76
political levels. 77
Finally, our study is driven by the need for the MENA countries to accelerate their 78
energy transition and acknowledge the important role of the financial sector for advancing 79
economic growth and enhancing sustainability. All the MENA countries have set renewable 80
energy and energy efficiency targets. For instance, Morocco aims to reach 30% of renewables 81
in electricity production by 2020 while Algeria has set a target of 27% (22 GW) by 2030 82
(Belaïd and Youssef, 2017). Financial sector growth is correlated to this economic 83
transformation and energy transition. Thus, it is assumed that financial development –based 84
on an efficient banking system and availability of capital through the financial markets– will 85
have a major impact on the speed of energy transition and the sustainability of the MENA 86
economies. The financial sector is expected to play a key role in shaping energy transition and 87
enhancing sustainability in the MENA countries. 88
This study extends the literature in several ways. First, it proposes a modified EKC 89
model which incorporates financial development and genuine savings as a measure of 90
sustainable development. The model examines the contribution of the financial sector to the 91
achievement of sustainable development by the MENA countries. To the best of our 92
knowledge, there are no empirical studies of the relationship between financial development 93
and sustainable development. Second, the study shows that the relationship between financial 94
development and unsustainability is non-linear i.e. initially unsustainability increases with 95
financial development but after a given level of financial development it begins to decline. 96
Third, among the various indicators of financial development, we use principal component 97
analysis (PCA) to select among three indicators of financial development: M2 (broad money 98
as a percentage of GDP), M3 (liquid liabilities as a percentage of GDP), and total credit to the 99
private sector as a percentage of GDP. Our choice of PCA is that (i) it addresses the 100
multicollinearity problem and the high correlation among various financial development 101
indicators, and (ii) it overcomes the problem of lack of consensus on the appropriate measures 102
of financial sector development. 103
The paper is organized as follows. Section 2 describes how sustainability and green 104
growth affect financial market and investor decisions and reviews the macroeconomic 105
literature linking financial development to sustainability. Section 3 presents the empirical 106
methodology and section 4 summarizes and analyzes the results. Section 5 concludes with 107
some policy implications. 108
2. Finance and sustainability
109
2.1. What is green finance and sustainable finance?
110 111
Green finance includes future-oriented financial processes, products, and services 112
which combine environmental improvement, economic growth, and financial industry 113
developments. Sustainable finance refers to more comprehensive and inclusive investments 114
which take account of environmental, social, and governance aspects (Noh, 2018). 115
Sustainable financial tools include among others, green bonds, green lending, and green 116
equity investment. Green bonds are used to finance green projects. There are many types of 117
green bonds including climate bonds which are related to climate change adaptation or 118
mitigation projects (Croce, et al., 2011). In 2017, global green bonds accounted for $121.9 119
billion, representing 87.1% of the world’s sustainable finance market (HSBC, 2018). In 120
addition to green bonds, banks offer green loans mostly used to finance projects aimed at 121
protecting the environment. At the same time, investors are adopting various sustainable 122
investment strategies such as green equity investments involving mainly equity funds and 123
index investing (Kahlenborn et al., 2017). 124
Obtaining funding and raising capital in the context of the green economy requires 125
developed financial markets. Many green economy projects are associated to high returns but 126
should not be seen as mere commercial opportunities; they allows the financial industry to 127
behave in a socially responsible way by contributing to the shift to a low-carbon economy and 128
a more sustainable world. Mitigation of climate change and adaptations to reduce the effects 129
of climate change require the participation of various organizations and sectors including 130
financial services. In the period to 2035 some $90 trillion of investment in sustainable 131
infrastructure will be needed to reduce world carbon emissions (Bhattacharya et al., 2015). 132
The United Nations Environment Program (UNEP) estimates that the transition to a low 133
carbon world will cost $60 trillion by 2050 with $35 trillion going to support decarbonization 134
of energy and the remaining $25 trillion to supporting climate change adaptation. Additional 135
investment in green sectors will be needed to advance the move towards a low carbon and 136
climate resilient economy (Campiglio, 2016). For instance, the integration of green and 137
sustainable finance requires financial professionals to have green finance knowledge and 138
skills and availability of a wide range of innovative products and services especially in the 139
insurance sector. Thus, green finance must shift from the provision of financial services to 140
becoming a primary banking and finance provider. Environmental sustainability remains a 141
long way off since significant funding continues to be allocated to destructive environmental 142
activities including use of fossil fuel which has long-term catastrophic effects on climate 143
change. Green financing and sustainability can be tackled only through the provision of 144
significant investment in low-carbon technologies to reduce the impact of climate change. 145
The emergence of the green economy is providing investors with new opportunities 146
and the possibility to identify optimal green portfolios. According to Noh (2018), green 147
investors benefit compared to traditional investors. Firms that create green value offer better 148
financing opportunities and the value of green investments has increased more than traditional 149
investments. Policy efforts and opportunities for green investors should be encouraged. Green 150
financing is important for several reasons (Noh, 2018) including the increasing risk linked to 151
environmental degradation and reduced availability of natural resources. Firms need to deal 152
with these risks to avoid potential economic losses. Stakeholders are requiring firms and 153
financial agencies to be socially responsible and there is greater social awareness about 154
climate change, exhaustion of natural resources, and environmental degradation which is 155
promoting stricter international agreements and environmental regulation. Finally, firms’ 156
management strategies are emphasizing sustainability. Green finance has two effects (Noh, 157
2018), namely, (i) mitigation of environmental damage, in particular the effects of climate 158
change on human capital and economic systems, and (ii) support for green growth. The green 159
growth paradigm combines economic growth and environmental protection which require 160
capital financing. 161
The financing of green industries will involve several problems. First, there is a high 162
level of uncertainty related to investment in green industries whose assets tend to be more 163
intangible. Second, green industry enterprises feature high information asymmetry (Noh, 164
2018). From the investor’s point of view, the risks linked to sustainability and climate change 165
incidents in recent years are a concern, and stakeholders in equity markets and credit rating 166
agencies consider such investments and financing decision risks as non-trivial(Weber, 2014; 167
Weber, Scholz, & Michalik, 2010). Also, Lopez and Toman (2006) point out that failure to 168
achieve sustainability is often the result of weak legal systems and financial markets, 169
underinvestment in human and social capital, corruption, and rent seeking behavior. 170
171
2.2. The role of financial development in decarbonization and sustainability
172 173
The EKC literature includes analyses of the link between financial development and 174
carbon emissions. This body of work is reviewed in detail since it is connected to the topic of 175
our study The EKC hypothesis is based on the link between environmental degradation and 176
income. It assumes that up to a certain level carbon emissions increase with per capita income 177
beyond which the relationship reverses and environmental pollution starts decreasing1. 178
Grossman and Krueger’s (1991) pioneering study tests Kuznets’s (1955) assumptions and 179
their findings have become the basis of much EKC research. However, the results of these 180
empirical studies are inconclusive (Omri et al., 2015). Some find a linear link between income 181
growth and CO2 emissions (Shafik, 1994; Omri, 2013) while others report an N-shaped 182
(Friedl and Getzner, 2003; Onafowora and Owoye, 2014), a U-shaped (Omri, 2018), or no 183
relationship (Richmond and Kaufmann, 2006; Tiba and Omri, 2017). Tamazian et al. (2009) 184
show that there are other variables that might affect environmental quality and should be 185
included in the EKC model. They consider financial sector development to be a major 186
contributor to sustainable development. Frankel and Romer (1999) also include financial 187
development in the EKC function and find that improved environmental quality is sensitive to 188
the level of financial development which attracts more foreign investment and in turn 189
enhances economic growth and reduces environmental quality through the consumption of 190
more energy (Islam et al., 2013). In contrast, financial development leads to use of 191
environmentally friendly technology which decreases pollution and promotes economic 192
growth (Omri et al., 2019). 193
Moreover, Steffen et al. (2015) update the great acceleration graphs and consider the joint 194
presence of foreign direct investment, international tourism, and telecommunications as 195
leading to increased globalization and connectivity. Primary energy use is a key indicator 196
related directly to the carbon footprint and its effect on the functioning of the earth system; it 197
1Most of the EKC literature assumes weak sustainability and does not take account of irreversibility and other
issues linked to “strong sustainability”. Th studies in this strand of work use“CO2 emissions, SO2 emissions or GHG emissions in general” to proxy for environmental quality. Few papers extend the EKC framework to consider more complex indexes. In our work, despite these limitations we use Genuine savings (GS) as proxy for environmental quality (sustainability). This construct considers more environmental assets in its composition and tries to examine different facets of environmental degradation. However, the construct is still considered as a construct of a weak sustainability. These shortcomings should be considered when interpreting our results.
is considered a key feature of contemporary society. Lagoarde-Segot and Martinez (2020, p. 198
14) consider ecological finance theory which states that “the world has entered the 199
Anthropocene and posits that the fairness and efficacy of a financial system cannot be 200
evaluated based on the monetary signals that it generates internally, but by examining 201
feedbacks with the biophysical and socioeconomic spheres” . According to Nystrom (2019), it 202
is necessary to redirect finance, increase transparency and traceability in supply chains, and 203
involve a multitude of players in order to steer the global production ecosystem towards a 204
sustainable trajectory. 205
Several works examine the financial development-environmental quality nexus but the 206
findings are mixed . For example, Jalil and Feridn (2011) use Chinese data to investigate the 207
effects of financial development, energy use, and income on environmental quality and find 208
that financial sector development has no impact on reducing CO2 emissions in China. Ozturk 209
and Acaravci (2013) employ the ARDL approach and find no significant effect of financial 210
sector development on CO2 emissions although in the case of Pakistan, Javid and Sharif 211
(2016) find a quadratic link between financial development and environmental degradation 212
i.e. that financial development initially increases CO2 emissions but beyond a certain level of 213
financial development, the effect becomes negative. Dar and Asif (2018) find similar results 214
for Turkey. and Haseeb et al. (2018) analyze the effect of financial sector development on 215
environmental quality for the BRICS economies using a standard EKC model. They show that 216
financial development increases carbon emissions in these economies. 217
218
2.3. The case of the MENA region countries
219
Only a few studies assess the link between financial development and environmental 220
degradation in the MENA countries. However, the effect of financial development on the 221
environment in the countries is of concern. Arouri et al. (2012) examine the relationship 222
between CO2 emissions, energy consumption, and real GDP in the MENA countries and find 223
no confirmation of an EKC except in the case of Jordan.In almost all countries the estimated 224
long-run coefficient of income and its square support the EKC hypothesis. However, in some 225
cases the turning points of the EKC are very low in some cases they are very high which 226
provides only weak support for the EKC hypothesis. Omri et al. (2015) examine 12 MENA 227
countries using a simultaneous equation modeling approach which includes financial 228
development in the standard EKC function. They show that financial development decreases 229
carbon emissions only in Jordan. Omri et al. (2019) examine the non-linear link between 230
financial development, human development, FDI, trade, and environmental sustainability in 231
the case of Saudi Arabia and find that financial sector development initially increases carbon 232
emissions but after a certain level they decline. They suggest that the level of financial 233
development in Saudi Arabia should be boosted to a certain level to achieve a positive effect 234
on environmental sustainability. 235
Charfeddine and Kahia (2019) employ a panel vector autoregressive (PVAR) model to 236
investigate the impact of renewable energy and financial development on CO2 emissions and
237
economic growth in 24 MENA countries. They show that renewable energy consumption and 238
financial development have a minor influence and only explain a small part of CO2 emissions
239
and economic growth. Their findings suggest that the financial and renewable energy sectors 240
in MENA countries need to be strengthened to improve the contribution to economic growth 241
and environmental quality. Gaies et al. (2019) examine the relationship between financial 242
development and energy consumption in the MENA countries and find that financial 243
development has positive impact on energy demand in these countries. They suggest that 244
when modeling energy demand, financial development variables need to be included to 245
address energy reduction and greenhouse gas emissions issues. Muhammad (2019) also finds 246
a positive relationship between financial development and energy consumption in the MENA 247
countries. 248
Ekwueme and Zoaka (2020) use FMOLS (fully modified ordinary least squares) and 249
DOLS (dynamic ordinary least squares), to examine the influence of financial development, 250
willingness to trade, and utilization of energy on CO2 emissions in the case of 10 MENA 251
countries. Their main finding is of a negative relationship between financial development and 252
CO2 emissions, meaning that higher levels of financial development result in reduced CO2
253
emissions. Nathaniel et al. (2020) employ an augmented mean group algorithm, to examine 254
the impact on the environment of renewable and non-renewable energy consumption in the 255
MENA countries, accounting for financial development. They suggest that urbanization, 256
economic growth, and financial development contribute to environmental degradation in the 257
region, pointing to the need for environmentally-friendly energy sources. Similarly, Saidi 258
(2020) found that CO2 emissions are driven by growth, urbanization, openness to trade, and
259
financial development. 260
Awan et al. (2020) investigated the impact of globalization and financial development 261
on CO2 emissions in six MENA countries. Using panel data, they show that globalization and
262
financial development have an adverse and significant impact on the environment. Their 263
results also support the EKC hypothesis for the MENA countries included in their study. 264
Yilanci and Gorus (2020) examine the impact of economic globalization on the ecological 265
footprint of 14 MENA countries. Their findings indicate that financial globalization can 266
predict the environmental degradation in MENA countries. 267 268 269 3. Empirical methodology 270 3.1. Model specifications 271
Critique of the standard EKC formulation has promoted intense discussion over 272
alternatives ways to illustrate the causality between income growth and per capita CO2 273
emissions. For example, Tamazian et al. (2009) indicate that to avoid omitted variables bias in 274
the econometric estimations, other variables than income, energy use, and CO2 emissions 275
need to be included in the EKC function. Several studies include other major determinants of 276
carbon emissions such as trade liberalization to test the “pollution haven hypothesis”2 (Ang, 277
2009; Omri et al., 2015). Other works argue that the inclusion of control variables such as the 278
manufacturing sector, human development indicators (Ben Youssef et al., 2016), and the 279
financial sector (Pata, 2018; Omri e al., 2019) would increase the representativeness of the 280
EKC model. 281
Based on the above, we propose the following EKC function 282
(1) 283
In equation (1), we include MHDI (a modified HDI) to substitute for HDI which does 284
not include per capita GDP. Also in excluding income, the MHDI avoids multicollinearity 285
between the human development index (HDI) and economic growth (Y). Instead of 286
controlling for omitted variables by including additional explanatory variables in the standard 287
EKC model, we build a more sustainably oriented EKC model which includes financial 288
development as an explanatory variable and as a sustainability instrument. Financial 289
development allows investors to use advanced environmentally friendly technologies for 290
production which improves both environmental quality and economic development (Shahbaz 291
et al. 2013a). Financial development also has an impact on environmental degradation (Omri 292
et al., 2015). Using data for Indonesia, Shahbaz et al. (2013b) investigate the determinants of 293
environmental degradation and find that the link between financial development and 294
2
Indicates that globalization (foreign direct investment and trade liberalization) increases pollution levels in host countries (Omri and Belhadj, 2020).
2
it 0 1 it 2 it 3 it 4 it 5 it 6 it 7 it it
environmental degradation takes a quadratic form. This implies that a less developed financial 295
sector reduces environmental quality, and vice versa. 296
Following Shahbaz et al. (2013b), a first modification to the EKC model is given by: 297
(2) 298
The linear and non-linear terms for financial development (F and F2) are introduced 299
into the model to assess the existence of an EKC between financial development and 300
pollution. To provide a more general framework for sustainability, we (i) include a more 301
comprehensive measure of development in the EKC model i.e. human development to replace 302
GDP (Y) with, (ii) replace the dependent variable (E) by an economic sustainable variable 303
(i.e. genuine saving -GS), and (iii) incorporate rule of law (RL) as a main determinant of 304
sustainability (Ben Youssef et al., 2018). 305
Based on the works of Ben Youssef et al. (2018), the macroeconomic sustainable 306
variable (GS) is described as follows 307
308
(3) 309
where K, FR fr R, g, b, e, d denote respectively economic capital formation, resource rental 310
rates net of the marginal costs of extraction, resources extracted, natural growth rate for 311
renewables, the marginal cost of abatement,pollution, and natural dissipation. 312
Genuine saving (GS) is based on the hypothesis of a limit and a perfect value of 313 sustainability where 314 315 Non-sustainability(–GS)GS < 0 316
Minimum level of sustainability GS = 0 317
Sustainability(+GS)GS > 0 318
319
The quadratic link between per capita income and carbon emissions in equation 1 can 320
be reformulated using a modified EKC to introduce the non-linear terms of financial sector 321
development, substituting the environmental degradation-related dependent variable (E) with 322
a negative GS (–GS) as a measure of non-sustainability, and replacing GDP by HDI. 323
Therefore, the modified HDI is the sum of the education and life expectancy indices. Also, 324 . R r GS K (F f )(R g) b(e d) 2 it 0 1 it 2 it 3 it 4 it 5 it 6 it 7 it it E F F Y E T MAN MHDI
excluding GDP from the modified HDI mitigates the multicollinearity problem between 325
GS saving and HDI. 326
The incorporation of additional variables in the standard EKC function allows the 327
effect of financial development on sustainable development to be analyzed. Thus, the standard 328
and modified EKC models are given respectively by equations 4 and 5 329 (4) 330 (5) 331 332 333
where i (i = 1…N) is country and t (t = 1…T) is the time period. α1 …,α7 are the elasticities of 334
environmental degradation with respect to GDP, squared GDP, energy use, trade, 335
manufacturing, MHDI, and financial development respectively. In the first model, we use 336
CO2 emissions and ecological footprintas measures of environmental degradation (E) 4. 337
In equations 4 and 5, the expected signs of dY/dE>0; dF/dGS>0 and dY2/dE<0; 338
dF2/dE<0 suggest a quadratic relationship between income and CO2 emissions, and financial 339
development and sustainability. The signs of α3 and λ3 are expected to be positive because 340
more energy use results in greater economic activity and leads to more environmental 341
pollution. The signs of α4 and λ4 are expected to change depending on the stage of 342
development. The signs of α5 and λ5 are expected to be positive indicating that a higher 343
manufacturing value added is associated to higher levels of environmental degradation and– 344
GS per capita. The sign of α7 depends a priori on the stage of development. In the early 345
stages, the financial sector is less concerned with environmental degradation. However, once 346
the economy matures, financial sector development benefits the environment through lending 347
for environmentally-friendly technologies to support domestic production. This implies that a 348
less developed (efficient) financial sector reduces (improves) environmental quality. The sign 349
on rule of law is expected to be negative, implying that greater control over corruption 350
reduces negative genuine saving. Finally, the presence of financial development and genuine 351
saving in the MEKC allows assessment of the link between financial development and 352
sustainable development. 353
3.2. Data description and financial development measures
354
4
Most studies use CO2 emissions to measure environmental degradation but these represent a small proportion
of total environmental degradation (Al-Mulali et al., 2015).
2 it 0 1 it 2 it 3 it 4 it 5 it 6 it 7 it it E Y Y EC T MAN MHDI F 2 it 0 1 it 2 it 3 it 4 it 5 it 6 it 7 it it GS F F EC T MAN MHDI RL
3.2.1. Data description
355
To study the contribution of financial development to sustainable development using a 356
MEKC, we analyze 14 MENA countries over 1990-2017. These countries are Algeria, 357
Bahrain, Egypt, Iran, Jordan, Kuwait, Morocco, Oman, Qatar, Saudi Arabia, Syria, Tunisia, 358
Turkey, and United Arab Emirates. We include CO2 emissions (C) and ecological footprint 359
(ECL) as dependent variables to allow comparison between the standard and modified EKC. 360
The models include: CO2 emissions (C) and ecological footprint (ECL) to measure 361
environmental degradation (E), per capita income (GDP, Y) to measure economic growth, per 362
capita energy use (EC), per capita trade defined as total exports plus imports, manufacturing 363
value added as a proportion of GDP (MAN), financial development (F) measured by total 364
credit to the private sector as a proportion of GDP, per capita –GS as a measure of sustainable 365
development, institutional quality measured by the rule of law, and MHDI measured as 366
secondary education plus life expectancy but excluding the GDP index (Y) to avoid 367
multicollinearity between GDP and HDI and between GDP and negative real saving (–GS). 368
Each country’s human development index is calculated as the simple arithmetic average of the 369
???, ???? and ???? (Sagar and Najam, 1998; UNDP, 2008). The HDI formula depends on 370
these three indexes: 371
HDI = 372
Several studies modify the conventional HDI by subtracting the share of GDP. In this 373
case, the MHDI does not include an income factor and multicollinearity remains a potential 374
problem in the regression analysis. Costantini and Monni (2008) used a similar approach to 375
examine the linkage between sustainable development and economic growth for 179 countries 376
and Dhahri and Omri (2018) use it to explore the relationship between entrepreneurship and 377
sustainable development for the case of 20 developing countries. 378
MHDI is presented as follows: MHDI = 379
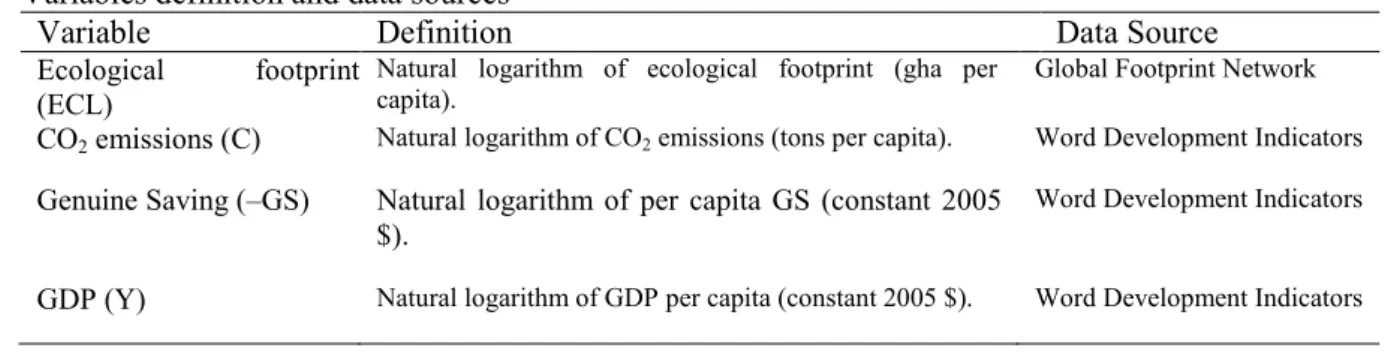
Table 1 reports the source and definition of the used variables. 380
Table 1
381
Variables definition and data sources 382
Variable Definition Data Source
Ecological footprint (ECL)
Natural logarithm of ecological footprint (gha per
capita). Global Footprint Network
CO2 emissions (C) Natural logarithm of CO2 emissions (tons per capita). Word Development Indicators
Genuine Saving (–GS) Natural logarithm of per capita GS (constant 2005 $).
Word Development Indicators
Financial development (F) Natural logarithm of Board money (M2) as share of GDP.
Word Development Indicators Natural logarithm of liquid liabilities (M3) as share of
GDP.
Natural logarithm of total credit to the private sector as a share of GDP.
Foreign trade (T) Natural logarithm of trade (imports and exports) as a
share of GDP Word Development Indicators
Energy consumption (E) Natural logarithm of energy use (oil equivalent per
capita). Word Development Indicators
Human development (MHDI)
Measured by the Modified Human Development Index. The MHDI measures the average achievements in a country in two basic dimensions of human development (Education index and Life expectancy index).
Calculated using data from World Development Indicators
Manufacture (MAN) Natural logarithm of manufacture value added as share
of GDP. Word Development Indicators
Institutional quality Rule of law Word Development Indictors
383
3.2.2. Financial development measure: Principal component analysis
384 385
PCA is used to select the best indicators of financial development among M2 (broad 386
money as a share of GDP), M3 (liquid liabilities as a share of GDP), and total credit to private 387
sector as a proportion of GDP (see e.g. Ang and McKibbin, 2007). We chose PCA because 388
(i) it addresses the multicollinearity problem and the high correlation among the various 389
indicators of financial development, and (ii) there is no consensus on the most appropriate 390
measure of financial development. 391
The PCA results are reported in table 2. The eigenvalue related to the first component 392
is greater than 1 (2.533). It accounts for around 84.4% of the standardized variance. The 393
second (third) principal component explains another 13.4% (0.022%) of the standardized 394
variation but with eigenvalues less than 1. In this case, the first principal component is related 395
to total credit to the private sector and is the best indicator of financial development. 396
Table 2 397
Results of the principal component analysis (PCA). 398
Component Eigenvalue Difference Proportion Cumulative
1 2.533 2.132 0.844 0.844 2 0.401 0.335 0.134 0.978 3 0.066 – 0.022 1.000 399 3.3. Estimation procedures 400
We use a five-step empirical methodology to estimate equations 4 and 5: (i) checking 401
cross-section dependence (CD) for residuals using various statistic tests, (ii) examining the 402
stationary properties of our variables, (iii) testing for the presence of cointegration among the 403
variables, (iv) estimating the long run parameters of the two models considered, and (v) 404
examining short- and long-term causality among the variables. 405
406
4. Empirical results and discussion
407
Three CD statistical tests data (Friedman (1937); Frees (1995); Pesaran (2004, 2006, 408
2015) are used to check the presence of cross-section dependence in our. The results of these 409
tests are reported in table 3 and show that the null hypothesis of cross-section independence is 410
rejected. In this case, the first-generation panel unit root tests could produce biased results 411
(due to size distortions) (Apergis and Payne, 2014). Thus, it is desirable to implement second-412
generation panel unit root tests (Chudik et al., 2011). Accordingly, we use a second-413
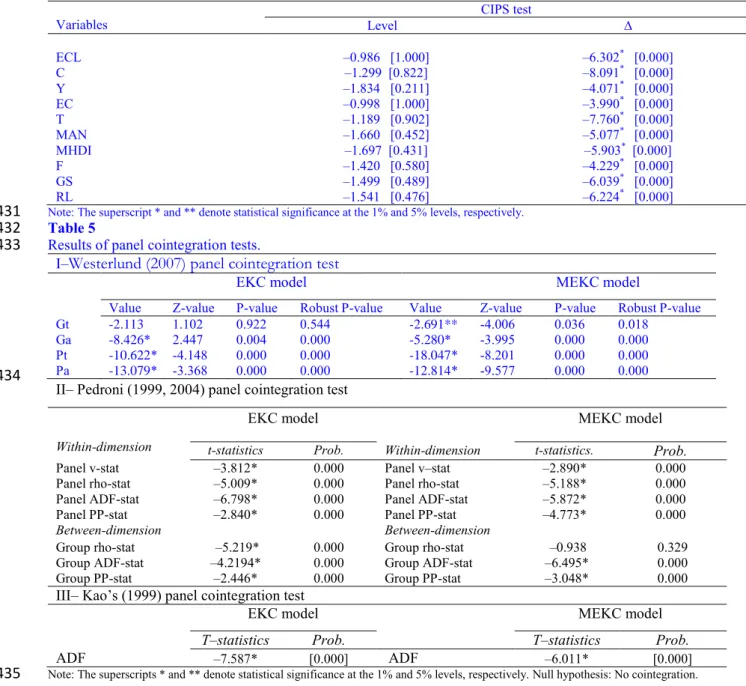
generation panel unit root test, a cross-section augmented IPS (CIPS) which accounts for the 414
presence of cross-section dependence. Table 4 shows that at level, all the variables are non-415
stationary but in first differences they are all integrated, indicating that our variables are 416
integrated at the order 1 (I(1)). Given the above results of the panel unit root tests, it is 417
possible to investigate the existence of long-run relationships among the variables using the 418
Westerlund (2007) panel cointegration test.Pedroni's (1999, 2004) and Kao's (1999) tests are 419
used as robustness checks for long-run relationships among the variables. The results in table 420
5 confirm the existence of long-run associations among the variables in both the EKC and 421
MEKC models. Thus, these statistical tests suggest that the variables included are 422 cointegrated. 423 424 425 Table 3 426
Results of cross-sectional dependence (CD) tests.
427 Friedman (1937) Frees (1995) Pesaran (2004) Pesaran (2006) Pesaran (2015) LM LM adj* LM CD* EKC model Statistics 121.493 11.622 8.770 10.006 309.226 103.329 6.061 Prob. 0.000* 0.000* 0.000* 0.000* 0.000* 0.000* 0.000* MEKC model Statistics 78.042 18.803 5.296 7.178 511.739 94.084 4.920 Prob. 0.000* 0.000* 0.004* 0.000* 0.000* 0.000* 0.000*
Note: The superscript * denotes statistical significance at the 1% level. Null hypothesis: Cross-sectional independence.
428
Table 4
429
CIPS unit root tests.
Variables CIPS test Level ∆ ECL –0.986 [1.000] –6.302* [0.000] C –1.299 [0.822] –8.091* [0.000] Y –1.834 [0.211] –4.071* [0.000] EC –0.998 [1.000] –3.990* [0.000] T –1.189 [0.902] –7.760* [0.000] MAN –1.660 [0.452] –5.077* [0.000] MHDI –1.697 [0.431] –5.903* [0.000] F –1.420 [0.580] –4.229* [0.000] GS –1.499 [0.489] –6.039* [0.000] RL –1.541 [0.476] –6.224* [0.000]
Note: The superscript * and ** denote statistical significance at the 1% and 5% levels, respectively.
431
Table 5
432
Results of panel cointegration tests.
433
I–Westerlund (2007) panel cointegration test
EKC model MEKC model
Value Z-value P-value Robust P-value Value Z-value P-value Robust P-value
Gt -2.113 1.102 0.922 0.544 -2.691** -4.006 0.036 0.018
Ga -8.426* 2.447 0.004 0.000 -5.280* -3.995 0.000 0.000
Pt -10.622* -4.148 0.000 0.000 -18.047* -8.201 0.000 0.000
Pa -13.079* -3.368 0.000 0.000 -12.814* -9.577 0.000 0.000
434
II– Pedroni (1999, 2004) panel cointegration test
Within-dimension
EKC model
Within-dimension
MEKC model
t-statistics Prob. t-statistics. Prob.
Panel v-stat –3.812* 0.000 Panel v–stat –2.890* 0.000
Panel rho-stat –5.009* 0.000 Panel rho-stat –5.188* 0.000
Panel ADF-stat –6.798* 0.000 Panel ADF-stat –5.872* 0.000
Panel PP-stat –2.840* 0.000 Panel PP-stat –4.773* 0.000
Between-dimension Between-dimension
Group rho-stat –5.219* 0.000 Group rho-stat –0.938 0.329
Group ADF-stat –4.2194* 0.000 Group ADF-stat –6.495* 0.000
Group PP-stat –2.446* 0.000 Group PP-stat –3.048* 0.000
III– Kao’s (1999) panel cointegration test
EKC model MEKC model
T–statistics Prob. T–statistics Prob.
ADF –7.587* [0.000] ADF –6.011* [0.000]
Note: The superscripts * and ** denote statistical significance at the 1% and 5% levels, respectively. Null hypothesis: No cointegration. 435
436 437
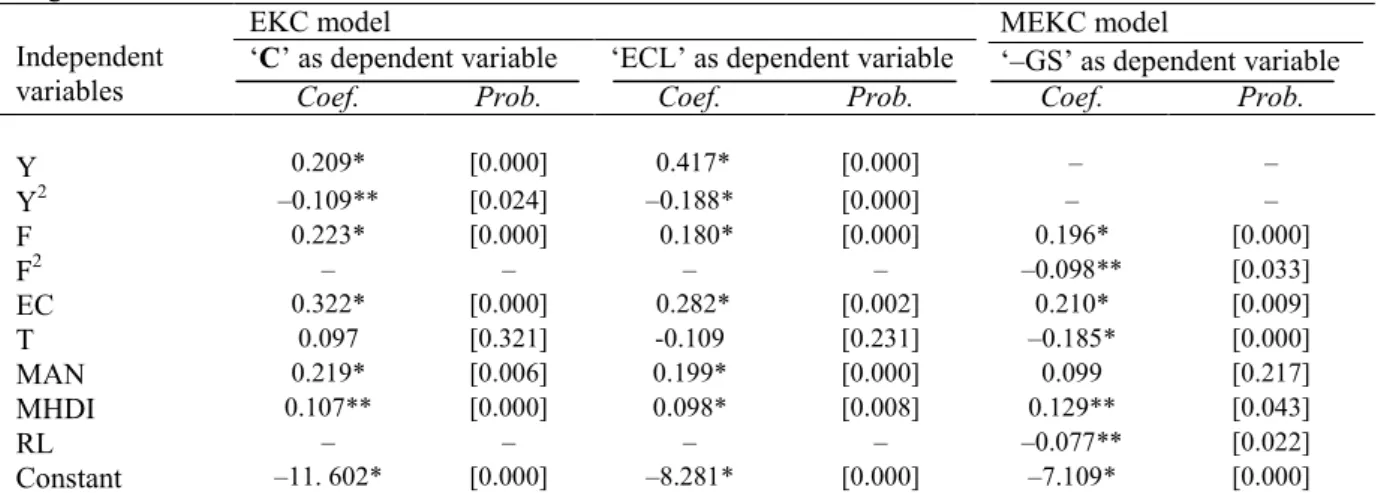
Table 6 presents the results of the long-run estimates of equations (4) and (5). The 438
results of the EKC model show that economic growth has a positive effect on both CO2 439
emissions and ecological footprint. The respective values 0.209 and 0.417 indicate that a 1% 440
rise in economic growth raises carbon emissions and ecological footprint by 0.21% and 441
0.42%; thus, an increase in economic growth is expected to lead to an increase in carbon 442
emissions. However, the coefficient of income squared is negative and significant for both 443
environmental variables. The positive (negative) effects of per capita income (and its square) 444
support the EKC hypothesis that environmental degradation initially increases but then begins 445
to decrease as per capita income goes above a certain level which confirms Omri et al.’s 446
(2015) findings for the MENA countries and Paramati et al.’s (2018) results for Vietnam. 447
Table 6 shows also that financial development contributes positively to per capita 448
carbon emissions and per capita ecological footprint. A 1% rise in total credit to the private 449
sector raises per capita CO2 emissions and ecological footprint by around 0.22% and 0.18%, 450
respectively. This finding contrasts with the results in Tamazian et al. (2009) that higher 451
levels of financial development in the BRICS economies reduces environmental degradation. 452
However, it supports the results in Zhang et al. (2011) that bank loans help Chinese 453
companies to access external finance and enhances their investment levels, hence improving 454
economic growth and environmental quality. The negative effect of financial sector 455
development on carbon emissions in the MENA region suggests that a well-developed 456
financial sector leads to lower CO2 emissions and a reduced ecological footprint. Therefore, 457
financial development could reduce carbons emissions by providing incentives for firms to 458
use advanced-environmentally-friendly technologies in their production processes (Ben 459
Youssef et al., 2018). A stable financial system which allows adoption of new technologies 460
should improve environmental quality although this might not apply in periods of economic 461
and financial instability. Governments in the MENA region need to balance improving 462
environmental quality with development of their financial sectors. 463
We show also that energy use has the expected positive and significant impact on the 464
two indicators of environmental degradation. A 1% increase in the use of energy increases 465
carbon emissions and ecological footprint by around 0.32% and 0.28% respectively. The 466
findings for the other control variables show that international trade and manufacturing value-467
added contribute positively to carbon emissions and ecological footprint, confirming the 468
findings in Tiba and Omri (2015) for less developed countries which show that trade 469
liberalization is accompanied by higher levels of environmental degradation due to 470
delocalization of polluting industries and the pollution haven effect (Costantini and Monni, 471
2008). 472
One of the objectives of this study was to examine the effectiveness of financial 473
development for achieving sustainable development. The MEKC estimates show that 474
financial development increases unsustainability (-GS). The coefficient of financial 475
development shows that a 1% increase in financial sector development increases -GS by 476
0.34%. However, the square of financial development reduces unsustainability (-GS). These 477
positive and negative impacts of financial development show a quadratic relationship between 478
financial development and -GS, meaning that initially non-sustainability increases with 479
financial development up to a certain level after which it starts to reduce –GS and increase 480
sustainability. Despite the non-linear link between non-sustainability and development of the 481
financial sector, since the financial sector coefficient (F) is superior to its squared value (F2), 482
an increase in financial development is likely to have only a small long-term impact on 483
sustainable development. Hence, given the scale of the problem there is no expectation that 484
current sustainable development efforts will be very effective. Many of the MENA economies 485
have large reserves of natural resources whose deployment does not contribute to 486
sustainability. We found also that foreign trade and rule of law decrease -GS by around 0.19% 487
and 0.04%, respectively similar to the findings in Costantini and Monni (2008). 488
Table 6 presents the short- and long-run Granger causality results for the EKC and 489
MEKC models. The coefficients of the error correction term (ECT) are significant which is 490
evidence of a stable long-run relationship among the variables. For the lagged ECT, we find a 491
long-run relationship among the variables considered in both models. The results show that all 492
the coefficients are statistically significant, and that there is bidirectional causality among 493
most of our considered variables. 494
Table 5
495
Long-run estimates for EKC and MEKC models.
496
Independent variables
EKC model MEKC model
‘–GS’ as dependent variable ‘C’ as dependent variable ‘ECL’ as dependent variable
Coef. Prob. Coef. Prob. Coef. Prob.
Y 0.209* [0.000] 0.417* [0.000] – – Y2 –0.109** [0.024] –0.188* [0.000] – – F 0.223* [0.000] 0.180* [0.000] 0.196* [0.000] F2 – – – – –0.098** [0.033] EC 0.322* [0.000] 0.282* [0.002] 0.210* [0.009] T 0.097 [0.321] -0.109 [0.231] –0.185* [0.000] MAN 0.219* [0.006] 0.199* [0.000] 0.099 [0.217] MHDI 0.107** [0.000] 0.098* [0.008] 0.129** [0.043] RL – – – – –0.077** [0.022] Constant –11. 602* [0.000] –8.281* [0.000] –7.109* [0.000]
Notes: P–values are reported in brackets. C and ECL denote per capita CO2 emissions and per capita ecological footprint, respectively. The
497
superscripts * and ** denote statistical significance at the 1% and 5% levels, respectively. 498
499
500
The results of the standard and the modified EKC show that per capita GDP, financial 501
development, energy use, manufacturing, trade, and human development have significant 502
causal impacts on CO2 emissions and ecological footprint. In addition, in both models the 503
ECT is statistically significant, indicating that the speed of adjustment of all the variables to 504
the long-run equilibrium is relatively slow. 505
We found short and long-term causality among most of the variables considered in the 506
models, and a significant ECT for the remaining variables. These relationships suggest some 507
general implications related to the sustainability process. First, in line with work on the 508
standard EKC, achieving a sufficient level of sustainability with a positive effect of financial 509
development is difficult in the initial stages of economic development. Financial system 510
development is a crucial condition for achieving this goal. However, the modified EKC shows 511
that it is possible to invert and reduce non-sustainable growth in the mid term phases of 512
economic development. Second, financial development facilitates achievement and 513
maintenance of higher levels of future sustainable development . The positive impact of 514
financial development is much higher than the negative impact of natural resources 515
endowments. The resources curse can be nullified by appropriate financial system 516
development with positive effects on sustainability and environmental quality. Third, higher 517
quality institutions promote higher sustainable development. An economy with higher 518
resources exploitation combined with poor institutions is expected to experience rent-seeking 519
or Dutch disease effects resulting in reduced economic growth, and therefore, low levels of 520
financial and human development (Ben Youssef et al., 2018). Excessive resources 521
exploitation in the initial stages of development, associated to lower development of the 522
financial system and poor institutional quality is expected to lead to non-sustainable 523 development. 524 525 526 527 528 529 530 531 532 533 534
535 536
Table 6 537
Results of causality test. 538
Dependent variables Short-run sources of causation (independent variables) Long-run
EKC model
∆E ∆Y (∆Y2) ∆EC ∆T ∆MAN ∆MHDI ∆F ECT
∆C ∆ECL ∆E ∆C – – 0.994* [0.000] 0.272*** [0.080] 0.481* [0.000] 0.352* [0.000] 0.287* [0.000] 0.330* [0.001] –0.119* [0.007] ∆ECL – – 0.691* [0.000] 0.278* [0.000] 0.197** [0.030] 0.591* [0.000] 0.206* [0.000] 0.196** [0.014] –0.213** [0.010] ∆Y (∆Y2) 0.198* [0.000] 0.189** [0.013] – 0.521** [0.021] 1.902* [0.000] 0.428* [0.000] 0.321** [0.026] 0.778* [0.000] –0.052** [0.030] ∆EC 0.160 [0.211] 0.098 [0.302] 0.237** [0.040] – 0.093 [0.271] 1.046* [0.000] 0.079 [0.111] 0.527* [0.000] –0.229* [0.000] ∆T 0.092 [0.244] 0.209* [0.000] 0.176 [0.285] 0.388 [0.109] – 0.389** [0.048] 0.106 [0.128] 0.293* [0.000] –0.401* [0.000] ∆MAN 0.288** [0.000] 0.179** [0.020] 0.665* [0.000] 0.429* [0.000] 0.991* [0.000] – 0.309* [0.000] 0.129* [0.006] –0.179** [0.011] ∆MHDI 0.430* [0.000] 0.222* [0.000] 0.771* [0.000] 0.155***[0.082] 0.370*** [0.052] 0.176 [0.120] – 0.289* [0.000] –0.290* [0.000] ∆F 0.920* [0.000] 1.955* [0.000] 1.089* [0.000] 0.118 [0.227] 0.280* [0.000] 0.440* [0.000] 0.339* [0.000] – –0.196* [0.000]
MEKC model ∆(–GS) ∆F (∆F2) ∆EC ∆T ∆MAN ∆MHDI ∆RL ECT
∆(–GS) – 2.981* [0.000] 0.542* [0.000] 0.922* [0.000] 1.019* [0.000] 1.156* [0.000] 0.472* [0.000] –1.508** [0.018] ∆F (∆F2) 0.319* [0.000] – 0.339* [0.000] 0.356* [0.000] 0.218** [0.017] 0.312* [0.001] 0.801* [0.000] –3.978* [0.000] ∆EC 0.549* [0.000] 0.892* [0.000] – 1.091** [0.035] 0.880* [0.000] 0.198** [0.020] 0.501* [0.000] –2.020* [0.000] ∆T 0.228* [0.009] 0.517* [0.000] 0.189 [0.156] – 0.318* [0.000] 0.075 [0.219] 0.400* [0.008] –0.925* [0.000] ∆MAN 0.362* [0.000] 3.210* [0.000] 0.227** [0.027] 0.289* [0.000] – 0.861* [0.000] 1.008* [0.000] –2.144* [0.000] ∆MHDI 0.224** [0.017] 0.331** [0.012] 0.176 [0.154] 0.587* [0.000] 0.544* [0.000] – 0.609* [0.000] –2.509* [0.000] ∆RL 0.415* [0.000] 0.438* [0.000] 0.078 [0.364] 0.433* [0.000] 0.210 [0.135] 0.470* [0.000] – –3.008* [0.000]
Notes: P–values are in brackets. The superscript *, ** and *** denote statistical significance at the 1%, 5% and 10% levels, respectively.
539 540 541 542
5. Concluding remarks and policy implications
543 544
Although the relationship between financial sector development and environmental 545
quality has been analyzed in the EKC literature little attention has been paid to its impact on 546
sustainable development. The lack of empirical work on this issue was the motivation for our 547
proposed modified EKC model which integrates both financial development and 548
macroeconomic sustainability and allows examination of the impact of the financial sector on 549
sustainable development in the case of 14 selected MENA countries during 1990-2017. 550
Our findings show (i) the validity of the EKC hypothesis for both per capita CO2
551
emissions and ecological footprint, (ii) the presence of a non-linear link between per capita 552
financial development and the two indicators of environmental degradation i.e. the level of 553
environmental degradation initially increases with financial sector development but after a 554
certain level becomes positive as more energy-efficient technologies and more efficient 555
infrastructures are implemented in the country's development process. Our findings show also 556
that despite the non-linear link between unsustainability and financial sector development, the 557
larger coefficient of financial sector development compared to its squared value indicates that 558
financial development is likely to have only a small long-term impact on sustainable 559
development. Therefore, current efforts aimed at protecting the environment and achieving 560
sustainability are expected to be ineffective given the extent of the problem. 561
Our paper has several implications for policy in the MENA region in particular and in 562
developing countries more general. 563
First, an efficient financial sector increases the amount of capital available to 564
investors, provides economic agents with liquidity, and allocates capital more efficiently 565
among economic sectors. Financial sector development would help MENA countries 566
transform their economies and move to a post-oil era. 567
Second, the ethics and values of financial sectors worldwide are changing and the 568
environment is being seen as an opportunity rather than a constraint. Green financing provides 569
funding for investors who want to invest in green sectors and is encouraging traditional 570
sectors to reduce their carbon emissions. By helping to diffuse these new values worldwide a 571
developed financial sector could promote the move to less polluting economies. Since most 572
MENA region financial organizations have branches in other parts of the world and belong to 573
multinationals with social and environmental responsibility programs the diffusion of these 574
values and good practices should be ensured. Social and environmental responsibility 575
programs are encouraging new behaviors in the MENA region and helping local entrepreneurs 576
to see the environment as offering green opportunities in their sectors. Governments in the 577
MENA region must encourage their financial sectors to improve economic and ecological 578
conditions by including provisions related to government loans and warranties, and interest 579
rates for responsible environmental and social investments. 580
Third, the financial sector could play a crucial role in persuading investors to consider 581
environmental and ecological sectors, such as recycling, sanitation, water, water purification, 582
and renewable energies. Many MENA region entrepreneurs are failing to recognize the 583
opportunities offered by climate change and consumers’ increased environmental awareness. 584
For example, most MENA countries have important oil and gas resources and therefore, are 585
neglecting the potential of green energies especially solar. It has been estimated that installing 586
solar panels on just 20% of the surface of the Sahara desert in Algeria could satisfy world 587
demand for electricity. Algeria’s solar energy potential is 60 times that of current European 588
Union electricity consumption (Bélaïd and Abderrahmani, 2013). Financial sectors working 589
with governments could help firms to exploit these sectors and reduce the risks for newborn 590
firms. Policy makers in the MENA countries should see their financial sectors as part of the 591
solution and should involve them in the definition of environmental policies, targets, and 592
strategies. 593
Fourth, the ongoing economic, social, and ecological crisis calls for a reconsideration
594
of the relationship between economic growth, finance, and sustainability (Lagoarde-Segot, 595
2015). Strengthening financial sectors and changing their focus from brown to green goals 596
could have an important impact on environmental change in the MENA countries where most 597
financial markets are under-developed. 598
This study has some limitations. The first is related to the sustainable development 599
indicator. A transition from the Millennium Development Goals to the 17 SDGs will require 600
different indicators related for example to food security, well-being, education quality, climate 601
change, and pollution mitigation, among others. Future work should focus on defining these 602
indicators. Second, this study analyzes only the direct effect of financial development on 603
sustainability. Future research could extend this by examining policy thresholds and critical 604
masses at which renewable energy could achieve the environmental, social, and economic 605
objectives of sustainable development simultaneously. 606