HAL Id: hal-02999306
https://hal.archives-ouvertes.fr/hal-02999306
Submitted on 17 Nov 2020HAL is a multi-disciplinary open access archive for the deposit and dissemination of sci-entific research documents, whether they are pub-lished or not. The documents may come from teaching and research institutions in France or abroad, or from public or private research centers.
L’archive ouverte pluridisciplinaire HAL, est destinée au dépôt et à la diffusion de documents scientifiques de niveau recherche, publiés ou non, émanant des établissements d’enseignement et de recherche français ou étrangers, des laboratoires publics ou privés.
Genome-wide analyses reveal drivers of penguin
diversification
Juliana Vianna, Flávia Fernandes, María José Frugone, Henrique Figueiró,
Luis Pertierra, Daly Noll, Ke Bi, Cynthia Wang-Claypool, Andrew Lowther,
Patricia Parker, et al.
To cite this version:
Juliana Vianna, Flávia Fernandes, María José Frugone, Henrique Figueiró, Luis Pertierra, et al.. Genome-wide analyses reveal drivers of penguin diversification. Proceedings of the National Academy of Sciences of the United States of America , National Academy of Sciences, 2020, 117 (36), pp.22303-22310. �10.1073/pnas.2006659117�. �hal-02999306�
BIOLOGICAL SCIENCES 1
2 3
Title: Genome-wide analyses reveal drivers of penguin diversification
4
Authors: Juliana A. Vianna1*, Flávia A. N. Fernandes 2, María José Frugone3, Henrique
5
Figueiró4, Luis R. Pertierra5, Daly Noll1,3, Ke Bi6, Cynthia Y. Wang-Claypool6, Andrew
6
Lowther7, Patricia Parker8, Celine Le Bohec9,10, Francesco Bonadonna11, Barbara
7
Wienecke12, Pierre Pistorius13, Antje Steinfurth14, Christopher Burridge15, Gisele P. M.
8
Dantas16, Elie Poulin3, W. Brian Simison17, Jim Henderson17, Eduardo Eizirik4, Mariana
9
F. Nery2, Rauri C. K. Bowie6*
10
Affiliations:
11
1Pontificia Universidad Católica de Chile, Facultad de Agronomía e Ingeniería Forestal,
12
Departamento de Ecosistemas y Medio Ambiente, Vicuña Mackenna 4860, Santiago, 13
Chile. 14
2Universidade Estadual de Campinas (UNICAMP), Sao Paulo, Brazil.
15
3Instituto de Ecología y Biodiversidad (IEB), Departamento de Ciencias Ecológicas,
16
Facultad de Ciencias, Universidad de Chile, Santiago, Chile. 17
4Pontifícia Universidade Católica do Rio Grande do Sul, Escola de Ciências, Brazil.
18
5Museo Nacional de Ciencias Naturales, Departamento de Ecología Evolutiva, CSIC,
19
C/José Gutiérrez Abascal, 2, 28006 Madrid, Spain. 20
6Museum of Vertebrate Zoology and Department of Integrative Biology, 3101 Valley Life
21
Science Building, University of California, Berkeley, Berkeley, CA 94720, USA. 22
7Norwegian Polar Institute, N-9297 Tromsø, Norway.
23
8University of Missouri St Louis and Saint Louis Zoo, One University Blvd., St. Louis,
24
MO, 63121-4400, USA. 25
9Université de Strasbourg, CNRS, IPHC UMR 7178, 23 rue Becquerel, F-67000
26
Strasbourg, France. 27
10Centre Scientifique de Monaco, Département de Biologie Polaire, 8 quai Antoine 1er,
28
MC 98000 Monaco, Principality of Monaco. 29
11CEFE UMR 5175, CNRS, Université de Montpellier, Université Paul-Valéry
30
Montpellier, EPHE, 1919 route de Mende, 34293 Montpellier cedex 5, France. 31
12Australian Antarctic Division, 203 Channel Highway Kingston, Tasmania 7050,
32
Australia. 33
13DST/NRF Centre of Excellence at the Percy FitzPatrick Institute for African
34
Ornithology, Department of Zoology, Nelson Mandela University, Port Elizabeth, South 35
Africa. 36
14RSPB Centre for Conservation Science, Royal Society for the Protection of Birds,
37
David Attenborough Building, Pembroke Street, Cambridge, Cambridgeshire, CB2 3QZ, 38
United Kingdom. 39
15University of Tasmania, School of Natural Sciences, Private Bag 55, Room 320a Life
40
Sciences Building, Hobart, Tasmania 7001, Australia. 41
16Pontifícia Universidade Católica de Minas Gerais, PPG in Vertebrate Zoology, Belo
42
Horizonte, Brazil. 43
17Center for Comparative Genomics, California Academy of Sciences, San Francisco,
44
CA, 94118, USA. 45
46 47
Author contributions: J.A.V., F.A.N.F., M.N., R.C.K.B. conceived and designed the
48
study and contributed to preparing the manuscript. H.F., K.B., E.E., B.S. and J.H. 49
contributed bioinformatics. L.P. developed the ecological niche models. M.J.F., D.N., 50
and E.P. facilitated analyses and contributed to the interpretation of results. M.A.L., 51
P.P., C.L.B., F.B., C.G., B.W., P.P., A.S., C.B., G.P.M.D, and C.W. undertook field work, 52
provided samples, and contributed to the manuscript. All co-authors revised and 53
commented on the manuscript and approved the final version; 54
Competing interests: The authors declare no competing interests.
Corresponding authors:
56
Juliana A. Vianna, Pontificia Universidad Católica de Chile, Facultad de Agronomía e 57
Ingeniería Forestal, Departamento de Ecosistemas y Medio Ambiente, Vicuña Mackenna 58
4860, Macul, Santiago, Chile, phone 56-988199882, jvianna@uc.cl 59
Rauri C. K. Bowie, Museum of Vertebrate Zoology and Department of Integrative Biology, 60
3101 Valley Life Science Building, University of California, Berkeley, CA 94720, USA. 61
Phone 510-643-1617, bowie@berkeley.edu 62
63
Keywords: Penguin, Antarctica, Genome, Ancestral niche, Ancestral distribution.
ABSTRACT 65
66
Extant penguins are the only flightless family of diving birds. They comprise at least 18 67
modern species, distributed from polar to tropical environments in the Southern 68
Hemisphere. The history of their diversification and adaptation to these diverse 69
environments remains controversial. We employed 22 new genomes from 18 penguin 70
species to reconstruct the order, timing, and location of their diversification, track changes 71
in thermal niche through time, and test for associated adaptation across the genome. The 72
penguin crown-group originated during the Miocene in New Zealand and Australia, and 73
not in Antarctica as previously thought. Aptenodytes appears as sister taxon of all other 74
penguin species. We show that lineage diversification in penguins was driven by changing 75
climatic conditions and by the development of the Antarctica Circumpolar Current (ACC). 76
Changes in thermal niche were accompanied by adaptations in genes that govern 77
thermoregulation and oxygen metabolism. Our reconstruction of changes in ancestral 78
effective population sizes (Ne) recovered three different demographic trajectories in
79
deeper time, the most common (11/18 penguin species) being an increased Ne between
80
0.04 and 0.07 Mya; Ne drops precipitously after the Last Glacial Maximum (LGM) most
81
likely as a consequence of the overall decline in marine productivity following the last 82 glaciation. 83 84 Significance Statement 85
Penguins have long been of interest to the scientific community. However, their 86
evolutionary history is not well understood. Using genomes we investigate macro- and 87
microevolutionary drivers of penguin diversification. Crown-group penguins diverged in 88
the early Miocene in the Australia/New Zealand region. We found that Aptenodytes 89
(emperor and king penguins) form a separated clade, sister of all other penguin lineages, 90
in contrast with previous studies that placed them as sister taxa of Pygoscelis. Analyses 91
suggest that penguins first radiated from temperate environmentsand then occupied cold 92
Antarctic waters. Although the onset of the ACC (35 Mya) was suggested to have a role 93
on penguins diversification, our findings of more recent time estimates of divergence 94
suggest that the intensification of the ACC (11.6 Mya) may have promoted their 95
diversification and geographic expansion. 96
97
Introduction
98 99
Few organisms have been as successful at colonizing the globe as seabirds, a large 100
ecological assemblage of oceanic and nearshore species that undergo some of the most 101
remarkable foraging and migratory journeys on Earth (1, 2). Despite their ubiquitous 102
presence, surprisingly little is known about the mechanisms that spurred their 103
diversification and allowed for their adaptation to diverse and often dynamic oceanic 104
habitats. 105
As the only living clade of flightless diving birds, penguins (order Sphenisciformes) 106
occupy both terrestrial and marine habitats. They forage across a wide range of ocean 107
temperatures and depths, from Antarctic to tropical waters (3). Our understanding of 108
penguin diversification and adaptation is hampered by disagreements about their 109
phylogenetic relationships (4–10) and the chronology of their radiation. When these 110
estimations are made using few genetic markers from different sections of the genome, 111
discordant results are to be expected as genomic regions vary in their mutation rates and 112
evolutionary history, including unknown patterns of gene introgression when different 113
species hybridize (11). Accordingly, estimates of ordinal crown-age vary between the 114
Miocene and Eocene (9.9–47.6 million years ago [Mya]) (4, 5, 8, 9). The earliest crown-115
group fossil dates to the late Miocene (12). 116
In addition, reconstructions of ancestral distributions and climatic niches are critical 117
to extend our knowledge of penguin diversification, but existing hypotheses are 118
conflicting: (i) an Antarctic origin, with later expansion towards warmer areas (5) or (ii) a 119
sub-Antarctic origin, with subsequent colonization of Southern Ocean islands and 120
Antarctica (7, 13). Testing these alternative hypotheses on a broad scale requires 121
accurate knowledge of the evolutionary history of penguins, including branching patterns 122
and timing of diversification. 123
The extent of ice and changes in the currents of the Southern Ocean during 124
repeated glacial cycles likely played a significant role in structuring penguin populations 125
and lineage diversification (14-16). Biogeographic boundaries in the Southern Ocean, 126
particularly the Antarctic Polar Front (APF) and the sub-tropical Front (STF), serve as 127
barriers to dispersal of some penguin species (14, 15, 17, 18). Differences in abiotic (e.g., 128
temperature and salinity) and biotic (e.g., types of food resources) variables on either side 129
of these two fronts may promote local adaptation and enable niche divergence among 130
penguins (19). Furthermore, associated currents have varied significantly over time in 131
latitude and strength in response to changing global circulation patterns (20). These 132
changes have been implicated in the colonization, isolation, and local extinction of some 133
penguin populations and species (4, 9). 134
We report here the reconstruction of the history of penguin diversification and 135
adaptation using 22 newly sequenced genomes representing 18 extant species and one 136
outgroup. We determined phylogenetic relationships and biogeographic histories, and 137
consequently the divergence of niche space through time. Finally, we also assessed the 138
extent of introgression between species that may have contributed to previous 139
disagreements on phylogenetic reconstructions, and adaptations of penguins across 140 environmental gradients. 141 142 Results 143
The penguin and petrel outgroup genomes were sequenced to ~30x coverage (Tables 144
S1–S3). All, but one genome sequences contained >90% of the conserved single-copy 145
genes identified across avian genomes (complete BUSCOs >90%; Table S4, Figs. S1– 146
4). From the assembled genomes we extracted 23,108 loci: Ultra Conserved Elements 147
(UCE: 4,057 loci), coding sequences (CDS: 11,011), and introns (8,040). We applied 148
species tree and concatenation methods to construct a phylogenetic hypothesis for extant 149
penguins using all loci together, and for each set of loci independently (Figs. 1, S5–8, 150
Table S5–S6). 151
152
Phylogenetic history and patterns of introgression of crown-group penguins
All analyses supported a similar phylogenetic hypothesis, all placing Aptenodytes as
154
sister taxon of all other extant penguin species (Fig. 1), distinct from other clades 155
comprising the genera Pygoscelis, Spheniscus+Eudyptula, and Megadyptes+Eudyptes. 156
The phylogeny based on mitogenomes was similar to that retrieved from the genomic 157
datasets, with a few minor differences in Eudyptes penguins that are likely explained by 158
genome-wide introgression among closely related species (Figs. 2, S7, S9, Table S7) as 159
we found evidence that some species may had hybridized during the course of their 160
diversification. Genomic introgressions were detected between i) erect-crested and the 161
ancestral rockhopper penguin species (17–23%); ii) erect-crested and macaroni/royal 162
(25%) penguins (Fig. 2), and iii) an ancestor of the Galápagos/humboldt and magellanic 163
penguins (11%; Fig. 2). Our divergence time estimated the divergence of the crown-group 164
penguins in the early Miocene at 21.9 Mya (95% CI 19.06–25.19; Figs. 1, S10, Table S8). 165
166
Biogeographic history and ancestral niche reconstruction
167
The reconstruction of ancestral geographical occurrence identified the coastlines of 168
Australia, New Zealand, and nearby islands as the most likely range of the ancestor of 169
extant penguins (Figs. 1, S11; Table S9). The first branching event (20.3–19.7 Mya) led 170
to the establishment of the genus Aptenodytes in the Antarctic, and reconstructions of the 171
ancestral Pygoscelis species indicate that they colonized the Antarctic Peninsula (area 172
C; Fig. 1, Table S9) soon after Aptenodytes, pointing to a long history of occupation in 173
Antarctica. In the mid-Miocene, the lineage leading to the Spheniscus/Eudyptula ancestor 174
colonized the South American coast (A), with members of the genera Eudyptes, 175
Eudyptula, Megadyptes, and Spheniscus progressively diversifying and colonizing
176
warmer oceanic environments (Fig. 1). 177
Consistent with the above findings, our reconstruction of sea surface temperatures 178
(SST) as a proxy for ecological niche disparity through time (DTT) suggests that penguins 179
originated from areas with a maximum SST of 9ºC (Figs. 1, S12-S13) which is in 180
alignment with present-day temperatures of sub-Antarctic waters (21). Southern and 181
eastern rockhopper penguins have retained a thermal preference for a maximum SST of 182
9ºC, while other closely related species (northern Rockhopper, fiordland, erect-crested) 183
have shifted towards warmer at-sea conditions (SST of 11–17ºC; Figs. 1, S13). This 184
thermal shift was most likely driven by divergence across the STF over the past 4.5 Mya. 185
In contrast, Macaroni penguins have shifted to occupy colder at-sea conditions to feed in 186
the nutrient-rich waters off Antarctica (Fig. S13). Lower latitude geographical locations, 187
such as the South African continental coasts (G) and the Galápagos Islands (J), were 188
colonized in the Pleistocene (0.59 Mya). Galápagos penguins are present in Pacific 189
tropical waters near the equator, where SST reach up to 27ºC, and exhibit a significant 190
increase in thermal tolerance compared to their sister-species, humboldt penguins (>6ºC 191
higher; DTT results, Fig. 1). 192
193
Genes under positive selection
194
We detected 104 genes under positive selection (BEB value >0.95 and FDR q<0.1) using 195
a site model across all branches of the Spheniscidae (Table S10-12, Fig. S14). Using a 196
gene interaction network analysis, we found that many of these positively selected loci 197
are functionally connected and formed two major clusters (Fig. 3): one primarily related 198
to broad cellular functions, and the other containing genes that affect specific phenotypes 199
including immunity, renal function and cardiovascular activities (e.g., blood pressure, 200
oxygen metabolism, coagulation). Our gene ontology analysis revealed a concordant 201
pattern of pathway enrichment, including terms related to angiotensin regulation, blood 202
pressure, and oxygen metabolism (Fig. 3, Table S11–12). All of these adaptations are 203
related to diving and maintenance of high core body temperatures. 204
205
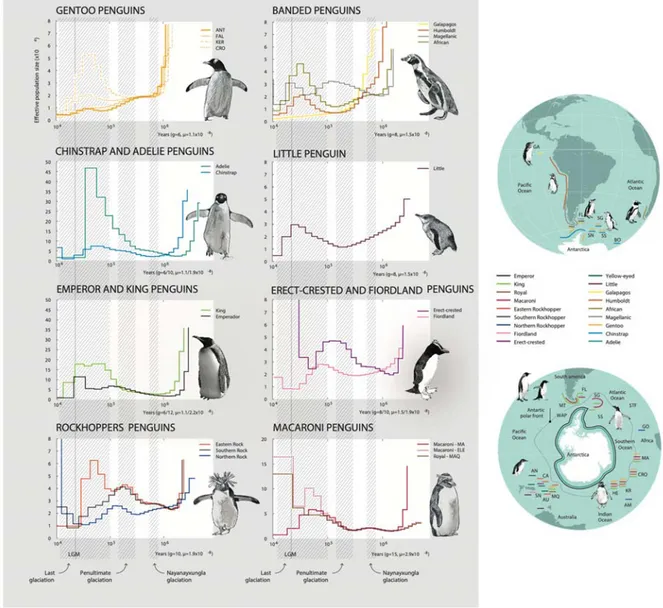
Ancestral effective populations sizes (Ne) 206
Our reconstruction of changes in ancestral effective population sizes (Ne) recovered three
207
different demographic trajectories in deeper time. Eleven species of penguin (emperor, 208
king, Adélie, chinstrap, gentoo [Kerguelen Population], humboldt, magellanic, African, 209
eastern rockhopper, little) increased Ne between 0.04 and 0.07 Mya, with Ne dropping
210
precipitously during the Last Glacial Maximum. In contrast, three species (northern 211
rockhopper, southern rockhopper, erect-crested) increased Ne during the Penultimate
212
Glaciation Period (PGP) between 0.130–0.194, but were in decline by 0.07 Mya. Finally, 213
two species (gentoo [Antarctica, Falkland Is. populations], Galápagos) have been in 214
steady decline since at least the Naynayxungla Glaciation (0.50–0.72 Mya; Fig. 4, S16). 215
Why Galápagos penguins and southern populations of gentoo penguins have been in 216
decline over such a considerable period of time remains uncertain, as there are no large 217
life-history or ecological differences that distinguishes these two species from other 218
penguins (Table S2). One possibility is that both Galápagos penguins and southern 219
populations of gentoo penguins represent recent divergence events (Fig 1. S7, S10), and 220
hence, the demographic reconstructions may be reflective of a founder event with larger 221
deep time Ne reflecting ancestral population sizes.
222
For erect-crested, southern and northern rockhoppers, and magellanic penguins 223
distributed around the tip of South America and on islands north of the APF, Ne was
224
highest during the PGP with a decline starting in or shortly after the subsequent 225
interglacial. This pattern could reflect changes in ecosystem productivity over deep time, 226
but it could be an artifact of the inability of the PSMC method to account for introgression. 227
Our analyses suggest that for these four species ancestral introgression (Fig. S9) would 228
have elevated estimates of Ne and could have offset the time interval when a peak in Ne
229
occurred (Fig. S16). The largest ancestral Ne we observed was for Adélie penguins
230
(>105), a primarily cold-water species (Fig. 1) widely distributed south of the APF;
231
decreases in temperatures and increases in ice cover may have promoted the expansion 232
of that population. Smaller historical peaks for Ne (~2-3*104) were recovered for island
233
endemic species, such as fiordland (southern New Zealand) and northern rockhopper 234
penguins (Tristan da Cunha and Gough Island). 235
236
Discussion
237
Phylogenetic reconstructions recovered by this study show that the large emperor and 238
king penguins (i.e., Aptenodytes) are sister to all other extant penguins, refuting the 239
hypothesis that Aptenodytes and Pygoscelis are sister-taxa (4, 8, 9). While genome-wide 240
data used in our trees allowed for the detection of the deep lineage split between 241
Aptenodytes and all other penguins, the short internal branch recovered by our analysis
242
at this split likely indicates a rapid diversification event (<1 Mya) (22). Such rapid 243
speciation events may explain the discrepancies among the previous proposed 244
phylogenetic hypothesis generated using that few molecular markers, which are known 245
to be insufficient in resolving such deep and short branches (23). As the clades become 246
more divergent, the phylogenetic position of the remaining genera and species are 247
consistent with phylogenetic hypotheses generated in other studies (4–10). Reticulated 248
evolution may also have contributed to some inconstancies in penguin phylogenetic 249
reconstructions. Genome analyses detected deep and shallow introgression events 250
across the phylogeny of extant penguins. Species of crested penguins (Eudyptes) appear 251
to have exchanged genes throughout much of their evolutionary history. The directionality 252
of introgression among these linages is consistent with the clockwise direction of the 253
Antarctic Circumpolar Current (ACC) connecting sub-Antarctic islands and promoting 254
dispersal. We also detected extensive genomic introgression between an ancestor of the 255
galápagos/humboldt penguin and the magellanic penguin; such introgression is still 256
observed at present between magellanic and humboldt penguins for which hybridization 257
has been reported in the wild (24). 258
Our divergence time estimates are consistent with the fossil record (12), placing 259
the ancestor of crown-group penguins in the early Miocene. Our biogeographic 260
reconstruction for crown-group penguins pointed to the coastlines of Australia and New 261
Zealand and nearby islands as the most likely range of the ancestor of extant penguins, 262
supporting earlier suggestion (7), rather than Antarctica as place of origin (5). Because of 263
the recency of most diversification events (2–9 Mya), we propose an alternative 264
hypothesis regarding their geographic expansion, namely that the opening of the Drake 265
Passage around the tip of South America led eventually to the full development of a deep, 266
strong ACC by ~11.6 Mya (26) which in turn may have contributed to colonization of new 267
areas and diversification of penguins, rather than the initial formation of the ACC ~35 Mya 268
(26)(Fig. 1). Global climate cooling intensified with the strengthening of the ACC and 269
possibly led to the extinction of several species inhabiting Antarctica (20, 27). The ACC 270
also reinforced the isolation of taxa inhabiting Antarctica from those on continental 271
shelves and islands to the north (20, 27), while promoting eastward colonization of 272
available sub-Antarctic islands. 273
Acceleration of the decline in surface temperatures since the Pliocene (20) may 274
have facilitated the colonization of new areas such as islands in the Indian Ocean. This 275
hypothesis is supported by our analysis of the divergence of the four gentoo penguin 276
lineages across thermal and salinity gradients to the north and south of the APF (Figs. 277
S5–S8). The Pliocene-Pleistocene cooling, along with the expansion of ice shelves 278
across the Southern Ocean (20), would have reduced connectivity among penguin 279
populations and facilitated speciation across Pygoscelis, Spheniscus, Eudyptes and 280
Aptenodytes between 2 and 5.5 Mya (Fig. 1).
281
During the Quaternary glaciations (1.8–0.01 Mya), sea-ice is thought to have 282
reached c. 40oS at the coast of South America (28). This extent of sea-ice would have
283
promoted the northern expansion of Spheniscus to the subtropics, and subsequently 284
enabled colonization of the Galápagos Islands, home to rich feeding resources for 285
penguins due to the upwelling of cooler, nutrient rich waters. Strong north-flowing currents 286
– the Humboldt Current and the Benguela Current – would have further facilitated penguin 287
colonization of subtropical habitats in the Pacific (Galápagos) and Atlantic (southern 288
Africa), respectively. Neither of these current systems penetrate beyond the equator; this, 289
together with their sub-Antarctic origins and preference for cooler waters, may explain 290
why crown-group penguins never successfully colonized the Northern Hemisphere. 291
The genes for which signals of positive selection were detected are associated with 292
thermoregulation (e.g., vasoconstriction/vasodilation: ENPEP, MME, BDKRB2), 293
osmoregulation (e.g., balance of fluids and salt: SCL6A19, ACE2, AGT), and diving 294
capacity (e.g., oxygen storage: MB), thereby reflecting adaptations that enabled penguins 295
to colonize both colder and warmer habitats, away from their ancestral thermal maximum 296
of c. 9ºC (Fig. 1, S12-13). In Antarctica, emperor penguins are exposed to temperatures 297
as low as -40ºC and forage in waters of -1.8ºC (29), whereas Galápagos penguins are 298
exposed to SST >27ºC and air temperatures exceeding 40ºC. These high temperatures 299
are mostly associated with El Niño events, which may cause heat stress, high mortality, 300
and low recovery of the penguin colonies (30, 31). Regulating blood pressure selectively 301
through the constriction of blood vessels can further conserve oxygen consumption and 302
facilitate the maintenance of high core body temperatures (32). 303
Penguins spend most of their lives at sea, often performing prolonged dives while 304
foraging. They store oxygen in their lungs, blood, and muscles (33), and their rates of 305
oxygen consumption can be very low (34). The two largest penguin species, the emperor 306
and king penguins, can achieve depths of >300 meters and maximum dive durations of 307
22 and 8 minutes, respectively (33, 35, 36). Smaller penguin species tend to dive in 308
shallow waters (<50 m) with dives of 1–2 minutes in duration (33), although the chinstrap 309
penguins often dive off-shelf (>200 m, (37)). In this sense, nucleotide differences in 310
Myoglobin (MB, overall positive selection, Z=2.645, p=0.005) across species groups 311
could be associated with differences in diving capacity. For example, we found several 312
non-synonymous substitutions that were common within Pygoscelis, Eudyptes, and 313
Aptenodytes penguins, but differed in their amino acid composition (Fig. S15). It is
314
possible that these non-synonymous mutations encode greater oxygen-binding capacity, 315
which would facilitate the deep and prolonged dives performed by Aptenodytes and some 316
species of Pygoscelis penguins compared with Eudyptes (higher dN/dS ratios, Table 317
S13). 318
Our results suggest that adaptive evolution, implicating genes involved in multiple 319
interconnected genetic pathways, has increased the foraging success and survival of 320
penguin species across diverse temperature and salinity gradients. Foraging success is 321
associated with reproductive success (38, 39) and also with survival during long periods 322
of fasting while caring for eggs and chicks (40). Collectively, such adaptations would have 323
enabled the radiation of penguin species across the Southern Hemisphere. 324
Penguins have a remarkable evolutionary history. Their radiation from the 325
temperate coasts of New Zealand and Australia into other parts of the Southern 326
Hemisphere was facilitated by changes in global circulation patterns over the past 20 327
million years. Our analysis detected positive selection across several gene networks, 328
suggesting that molecular adaptation enabled the establishment of penguin populations 329
in Antarctic and tropical regions, and enhanced the ability of some species to dive deeply. 330
Demographic reconstructions over the past million years show that most penguin species 331
have declined during the severe ice conditions during the LGM in the Southern Ocean, a 332
result concordant with that recovered for several other bird species (41, 42). 333
Our results suggest that penguins originated from areas with a maximum SST of 334
9ºC and diversified over millions of years, occupying colder Antarctic and warmer tropical 335
waters. As such, it seems unlikely that locally adapted species will be able to keep pace 336
with rapid climate change, especially as marine species may be more vulnerable to global 337
warming than terrestrial species (43, 44). This vulnerability is especially pertinent for 338
penguins, as illustrated by the massive mortality of Adélie penguin chicks and by the 339
relocation of emperor penguins in response to suboptimal sea ice conditions (45, 46). As 340
large-scale genomic studies become increasingly feasible and data for more 341
sophisticated global climate models become available for niche modelling, the application 342
of approaches like those in the present study hold significant promise for revealing new 343
insights into the evolutionary history and climatic vulnerability of many of the world’s 344
poorly understood taxonomic groups. 345
346
Materials and Methods
347
Detailed methods for each of the sections below are provided in the supplementary 348
documents. 349
350
Genome sequencing and assembly
351
The genomes of 18 extant penguin species (22 individuals) as well as the southern giant 352
petrel (Macronectes giganteus) were sequenced to ~30x coverage with 150 bp paired-353
end reads using an Illumina HiSeq X platform at MedGenome (USA; Table S1). We used 354
the giant petrel as outgroup for the analyses reported below. Briefly, duplicate sequences 355
were removed using Super Deduper (https://github.com/dstreett/Super-Deduper) and the
356
reads were then filtered. We aligned the resulting cleaned reads of each individual to the 357
emperor penguin reference genome (http://gigadb.org/dataset/100005; scaffold-level 358
assembly) using LAST (http://last.cbrc.jp/). The extent to which genome assemblies were
359
complete was assessed using the Benchmarking Universal Single-Copy Orthologs, 360
BUSCO v2 dataset (47)(Fig. S2) and KAT spectra-cn plots (48)(Fig. S3, S4). The CDS, 361
intron and mitogenome sequences were extracted for each genome using the reference 362
genome GFF. We extracted 120 bp Ultra Conserved Element (UCE) loci with 750 bp of 363
length of the flanking sequence padded to each side with scripts from the PHYLUCE 364
pipeline (49). Sequences were aligned using MAFFT (50). 365
Estimation of phylogeny, divergence times, and interspecific introgression
367
To account for potential genome-wide incompatibilities between taxa and loci, we used 368
Astral III (48) to estimate species tree phylogenies for each of the UCE, intron, and CDS 369
data sets, and for all three data sets combined (Fig S8). We used RAxML-NG (v. 0.5.1b 370
BETA) (51) to generate independent gene trees for each locus of the UCE, intron, and 371
CDS alignments. As input to Astral III, we merged all of the “best” trees generated by 372
RAxML-NG into a single file (Supplement). For the phylogenomic concatenated analysis 373
using all the data from UCEs, CDS, intron, and the mitogenome we carried out maximum 374
likelihood (ML) analyses in IQ-TREE, (52), with 1000 bootstrap replicates (Fig. S5-S7). 375
We estimated divergence times in BEAST v2.5.2 (53) using the computer resources 376
available through the CIPRES Science Gateway (Fig S7, S10) (54) calibrating the 377
topology with five fossils (Table S8). This phylogeny was used for all subsequent analysis 378
that required this information. Analyses to investigate the extent of interspecific 379
introgression across the phylogeny were performed using a partitioned D-statistics 380
approach implemented in DFOIL (55) for possible taxa combinations (eight) respecting 381
the priors of a symmetrical tree composed of four taxa and an outgroup, one ingroup 382
clade being younger than the other (Fig. 2, S9, Table S7). To perform the tests, we split
383
the genome-wide alignments into 100 kb, non-overlapping windows with Bedtools and 384
custom scripts. 385
386
Ancestral Distribution and Niche Reconstruction
387
For the historical biogeographic analysis, we estimated the ancestral range of the extant 388
penguin species in the R package BioGeoBEARS (56) implementing three models of 389
ancestral area reconstruction with and without long distance dispersal (the parameter j: 390
“jump dispersal”). We subdivided the extant penguin geographic distribution into 10 391
different areas. Occurrence records for all penguin species and six marine variables were 392
used to created raw models with MaxEnt–Javascript (57). Niche overlap was estimated 393
between all penguin species for the set of variables considered. We used the package 394
‘Phyloclim’ to create Predicted Niche Occupancy (PNO) profile values and plots. 395
Subsequently we combined this information with the phylogenetic tree to generate the 396
Divergence Through Time (DTT) plots and climatic tolerance chronograms depicted in 397
Figure 1. 398
399
Detection of signatures of positive selection
400
We performed a dN/dS ratio test using the CodeML algorithm implemented in ETE3 (58, 401
59) for all species and sub-groups in the phylogeny. Due to the large number of analyzed 402
genes, we performed a multiple comparisons (false-discovery rate [FDR]) test 403
implemented in R. Genes that persisted on the list (i.e. remained significantly different 404
from neutral expectations, supporting a positive selection regime) were then used to 405
perform a gene ontology analysis using WebGestalt (WEB-based GEne SeT AnaLysis 406
Toolkit) (60) and network analysis performed with StringDB (61) (Figure S14-S15). 407
408
Demographic history
409
To address questions about how climate may have influenced effective population size 410
for each penguin species, we performed a demographic analysis using a pairwise 411
sequential Markovian coalescent (PSMC) method (62). PSMC was run with parameters 412
“-N25 -t15 -r5 -p 4 + 25*2 + 4 + 6”, and an estimated generation time (g) for the different 413
penguin species (Figure 4, S16, Table S2) using a substitution rate derived from chicken 414 pedigrees (63). 415 416 References 417 418
1. Egevang C, et al. (2010) Tracking of Arctic terns <em>Sterna paradisaea</em> reveals
419
longest animal migration. Proceedings of the National Academy of Sciences 107(5):2078-420
2081. 421
2. Péron C & Grémillet D (2013) Tracking through Life Stages: Adult, Immature and
422
Juvenile Autumn Migration in a Long-Lived Seabird. PLOS ONE 8(8):e72713. 423
3. Thomas DB & Fordyce RE (2012) Biological Plasticity in Penguin Heat-Retention
424
Structures. Anatomical Record-Advances in Integrative Anatomy and Evolutionary 425
Biology 295(2):249-256.
426
4. Gavryushkina A, et al. (2017) Bayesian Total-Evidence Dating Reveals the Recent
427
Crown Radiation of Penguins. Systematic Biology 66(1):57-73. 428
5. Baker AJ, Pereira SL, Haddrath OP, & Edge KA (2006) Multiple gene evidence for
429
expansion of extant penguins out of Antarctica due to global cooling. Proc Biol Sci 430
273(1582):11-17. 431
6. Clarke JA, et al. (2007) Paleogene equatorial penguins challenge the proposed 432
relationship between biogeography, diversity, and Cenozoic climate change. Proc Natl 433
Acad Sci U S A 104(28):11545-11550.
434
7. Ksepka D.T. BS, Giannini N. (2006) The phylogeny of the living and fossil
435
Sphenisciformes (penguins). Cladistics 22:412-441. 436
8. Subramanian S, Beans-Picon G, Swaminathan SK, Millar CD, & Lambert DM (2013)
437
Evidence for a recent origin of penguins. Biol Lett 9(6):20130748. 438
9. Cole TL, et al. (2019) Mitogenomes Uncover Extinct Penguin Taxa and Reveal Island
439
Formation as a Key Driver of Speciation. Mol Biol Evol 36(4):784-797. 440
10. Pan H, et al. (2019) High-coverage genomes to elucidate the evolution of penguins.
441
GigaScience 8(9).
442
11. Figueiró HV, et al. (2017) Genome-wide signatures of complex introgression and
443
adaptive evolution in the big cats. Science Advances 3(7):e1700299. 444
12. Degrange FJ, Ksepka DT, & Tambussi CP (2018) Redescription of the oldest crown
445
clade penguin: cranial osteology, jaw myology, neuroanatomy, and phylogenetic 446
affinities of Madrynornis mirandus. Journal of Vertebrate Paleontology 38(2):e1445636. 447
13. Bertelli S & Giannini NP (2005) A phylogeny of extant penguins (Aves:
448
Sphenisciformes) combining morphology and mitochondrial sequences. Cladistics 449
21(3):209-239. 450
14. Vianna JA, et al. (2017) Marked phylogeographic structure of Gentoo penguin reveals an
451
ongoing diversification process along the Southern Ocean. Mol Phylogenet Evol 107:486-452
498. 453
15. Frugone MJ, et al. (2018) Contrasting phylogeographic pattern among Eudyptes penguins
454
around the Southern Ocean. Sci Rep 8(1):17481. 455
16. Munro KJ & Burg TM (2017) A review of historical and contemporary processes
456
affecting population genetic structure of Southern Ocean seabirds. Emu - Austral 457
Ornithology 117(1):4-18.
458
17. Frugone MJ, et al. (2019) More than the eye can see: Genomic insights into the drivers of
459
genetic differentiation in Royal/Macaroni penguins across the Southern Ocean. 460
Molecular Phylogenetics and Evolution 139:106563.
461
18. Clucas GV, et al. (2018) Comparative population genomics reveals key barriers to
462
dispersal in Southern Ocean penguins. Molecular Ecology 27(23):4680-4697. 463
19. Pertierra L, et al. (under review) Integrated phylogenomic and niche analyses reveal
464
cryptic speciation in Gentoo penguins driven by local adaptation. Molecular Ecology. 465
20. Halanych KM & Mahon AR (2018) Challenging Dogma Concerning Biogeographic
466
Patterns of Antarctica and the Southern Ocean. Annual Review of Ecology, Evolution, 467
and Systematics 49:355-378.
468
21. Dunstan PK, et al. (2018) Global patterns of change and variation in sea surface
469
temperature and chlorophyll a. Scientific reports 8(1):14624-14624. 470
22. Weisrock DW, Harmon LJ, & Larson A (2005) Resolving deep phylogenetic
471
relationships in salamanders: analyses of mitochondrial and nuclear genomic data. Syst 472
Biol 54(5):758-777.
473
23. Oliveros CH, et al. (2019) Earth history and the passerine superradiation. Proceedings of
474
the National Academy of Sciences 116(16):7916-7925.
475
24. Simeone A, et al. (2009) Heterospecific Pairing and Hybridization between Wild
476
Humboldt and Magellanic Penguins in Southern Chile (BIOONE) pp 544-550, 547.
25. Goldner A, Herold N, & Huber M (2014) Antarctic glaciation caused ocean circulation 478
changes at the Eocene-Oligocene transition. Nature 511(7511):574-577. 479
26. Dalziel IWD, et al. (2013) A potential barrier to deep Antarctic circumpolar flow until
480
the late Miocene? Geology 41(9). 481
27. Crame JA (2018) Key stages in the evolution of the Antarctic marine fauna. Journal of
482
Biogeography 45(5):986-994.
483
28. Glasser NF, Jansson KN, Harrison S, & Kleman J (2008) The glacial geomorphology and
484
Pleistocene history of South America between 38°S and 56°S. Quaternary Science 485
Reviews 27(3):365-390.
486
29. Williams CL, Hagelin JC, & Kooyman GL (2015) Hidden keys to survival: the type,
487
density, pattern and functional role of emperor penguin body feathers. Proceedings of the 488
Royal Society B-Biological Sciences 282(1817).
489
30. Boersma PD (1998) Population trends of the Galapagos penguin: Impacts of El Nino and
490
La Nina. Condor 100(2):245-253. 491
31. Boersma D (1975) Adaptations of Galapagos penguins for life in two different
492
environments. The biology of penguins, ed Stonehouse B (Macmillan, London), pp 101-493
114. 494
32. Butler PJ & Jones DR (1997) Physiology of diving of birds and mammals. Physiological
495
Reviews 77(3):837-899.
496
33. Ponganis PJ & Kooyman GL (2000) Diving physiology of birds: a history of studies on
497
polar species. Comparative Biochemistry and Physiology a-Molecular and Integrative 498
Physiology 126(2):143-151.
499
34. Williams CL, Meir JU, & Ponganis PJ (2011) What triggers the aerobic dive limit?
500
Patterns of muscle oxygen depletion during dives of emperor penguins. The Journal of 501
Experimental Biology 214(11):1802-1812.
502
35. Wienecke B, Robertson G, Kirkwood R, & Lawton K (2007) Extreme dives by
free-503
ranging emperor penguins. Polar Biology 30(2):133-142. 504
36. Putz K & Cherel Y (2005) The diving behaviour of brooding king penguins (Aptenodytes
505
patagonicus) from the Falkland Islands: variation in dive profiles and synchronous 506
underwater swimming provide new insights into their foraging strategies. Marine Biology 507
147(2):281-290. 508
37. Kokubun N, Takahashi A, Mori Y, Watanabe S, & Shin HC (2010) Comparison of diving
509
behavior and foraging habitat use between chinstrap and gentoo penguins breeding in the 510
South Shetland Islands, Antarctica. Marine Biology 157(4):811-825. 511
38. Kowalczyk ND, Reina RD, Preston TJ, & Chiaradia A (2015) Environmental variability
512
drives shifts in the foraging behaviour and reproductive success of an inshore seabird. 513
Oecologia 178(4):967-979.
514
39. Berlincourt M & Arnould JPY (2015) Influence of environmental conditions on foraging
515
behaviour and its consequences on reproductive performance in little penguins. Marine 516
Biology 162(7):1485-1501.
517
40. Thiebot JB, et al. (2014) Adjustment of pre-moult foraging strategies in Macaroni
518
Penguins Eudyptes chrysolophus according to locality, sex and breeding status. Ibis 519
156(3):511-522. 520
41. Nadachowska-Brzyska K, Li C, Smeds L, Zhang G, & Ellegren H (2015) Temporal
521
Dynamics of Avian Populations during Pleistocene Revealed by Whole-Genome 522
Sequences. Curr Biol 25(10):1375-1380. 523
42. Cole TL, et al. (2019) Receding ice drove parallel expansions in Southern Ocean 524
penguins. Proceedings of the National Academy of Sciences 116(52):26690-26696. 525
43. Pinsky ML, Eikeset AM, McCauley DJ, Payne JL, & Sunday JM (2019) Greater
526
vulnerability to warming of marine versus terrestrial ectotherms. Nature 569(7754):108-527
111. 528
44. Wiens JJ (2016) Climate-Related Local Extinctions Are Already Widespread among
529
Plant and Animal Species. PLoS biology 14(12):e2001104-e2001104. 530
45. Cimino MA, Lynch HJ, Saba VS, & Oliver MJ (2016) Projected asymmetric response of
531
Adélie penguins to Antarctic climate change. Scientific Reports 6:28785. 532
46. Fretwell PT & Trathan PN (2019) Emperors on thin ice: three years of breeding failure at
533
Halley Bay. Antarctic Science:1-6. 534
47. Simao FA, Waterhouse RM, Ioannidis P, Kriventseva EV, & Zdobnov EM (2015)
535
BUSCO: assessing genome assembly and annotation completeness with single-copy 536
orthologs. Bioinformatics 31(19):3210-3212. 537
48. Mapleson D, Garcia Accinelli G, Kettleborough G, Wright J, & Clavijo BJ (2017) KAT:
538
a K-mer analysis toolkit to quality control NGS datasets and genome assemblies. 539
Bioinformatics (Oxford, England) 33(4):574-576.
540
49. Faircloth BC (2016) PHYLUCE is a software package for the analysis of conserved
541
genomic loci. Bioinformatics 32(5):786-788. 542
50. Katoh K & Standley DM (2013) MAFFT multiple sequence alignment software version
543
7: improvements in performance and usability. Mol Biol Evol 30(4):772-780. 544
51. Kozlov AM, Darriba D, Flouri T, Morel B, & Stamatakis A (2018) RAxML-NG: A fast,
545
scalable, and user-friendly tool for maximum likelihood phylogenetic inference. 546
bioRxiv:447110.
547
52. Nguyen L-T, Schmidt HA, von Haeseler A, & Minh BQ (2015) IQ-TREE: A Fast and
548
Effective Stochastic Algorithm for Estimating Maximum-Likelihood Phylogenies. 549
Molecular Biology and Evolution 32(1):268-274.
550
53. Bouckaert R, et al. (2014) BEAST 2: a software platform for Bayesian evolutionary
551
analysis. PLoS Comput Biol 10(4):e1003537. 552
54. Miller MA, Pfeiffer W, & Schwartz T (2010) Creating the CIPRES Science Gateway for
553
inference of large phylogenetic trees. 2010 Gateway Computing Environments Workshop 554
(GCE), pp 1-8.
555
55. Pease JB & Hahn MW (2015) Detection and polarization of introgression in a five-taxon
556
phylogeny. Systematic Biology 64(4):651–662 557
56. Matzke N (2013) BioGeoBEARS: BioGeography with Bayesian (and Likelihood)
558
Evolutionary Analysis in R Scripts. University of California, Berkeley, Berkeley, CA. . 559
57. Phillips SJ, Anderson RP, & Schapire RE (2006) Maximum entropy modeling of species
560
geographic distributions. Ecological Modelling 190(3-4):231-259. 561
58. Huerta-Cepas J, Serra F, & Bork P (2016) ETE 3: Reconstruction, Analysis, and
562
Visualization of Phylogenomic Data. Mol Biol Evol 33(6):1635-1638. 563
59. Yang Z (1997) PAML: a program package for phylogenetic analysis by maximum
564
likelihood. Computer applications in the biosciences : CABIOS 13(5):555-556. 565
60. Wang J, Vasaikar S, Shi Z, Greer M, & Zhang B (2017) WebGestalt 2017: a more
566
comprehensive, powerful, flexible and interactive gene set enrichment analysis toolkit. 567
Nucleic Acids Res 45(W1):W130-W137.
61. Szklarczyk D, et al. (2019) STRING v11: protein-protein association networks with 569
increased coverage, supporting functional discovery in genome-wide experimental 570
datasets. Nucleic Acids Res 47(D1):D607-d613. 571
62. Li H & Durbin R (2011) Inference of human population history from individual
whole-572
genome sequences. Nature 475(7357):493-496. 573
63. Nam K, et al. (2010) Molecular evolution of genes in avian genomes. Genome Biol
574
11(6):R68. 575
576
Acknowledgments: We thanks to Andrea Polanowski, Claudia Godoy and Klemens
577
Pütz for assistance with sample acquisition; Funding: Financial support was provided 578
by INACH RT_12–14, Fondecyt Project 1150517, GAB PIA CONICYT ACT172065, 579
NSF DEB-1441652, French Polar Institute Paul-Emile Victor (IPEV, Progs. 137 and 580
354), and a Lakeside grant from the California Academy of Sciences; 581
Data and materials availability: Penguins and giant petrel raw fastq reads,
582
reconstructed genomes (BioProject PRJNA530615, BioSample accession
583
SAMN11566608-SAMN11566630) and mitogenomes (MK760983-MK761004, 584
MK761006) were deposited in Genbank. All UCE, CDS, intron and mitogenome 585
alignments, dated phylogenies and codes for all data analyses are available at Dryad 586
(https://doi.org/10.5061/dryad.pk0p2ngj2). All other data needed to evaluate the
587
conclusions in this paper are present either in the main text or the supplementary 588 materials. 589 590 591 Supplementary Materials: 592
Materials and Methods 593 Figures S1-S16 594 Tables S1-S13 595 References (1-42) 596
597
598
Fig. 1. Evolutionary history of penguins. Phylogenetic hypothesis of penguin species
599
and divergence time estimates using UCE dataset. Red arrows represent the four fossil 600
calibration points (fifth point corresponds to the node with the outgroup which not 601
represented). Each node is represented by the ancestral distribution before the 602
cladogenesis event using Ancestral range reconstruction based on the best-fit model 603
(DIVALIKE+J) and is associated with one or more of the ten geographic locations 604
depicted on the map in the lower right (different letters A–J and colors); areas at branch 605
tips represent the current range of species. Average world surface temperature in the 606
past is represented by the white graph behind the phylogeny (41) and onset of the 607
strengthening of the Antarctic Circumpolar Current (ACC) by a dashed red line. At the 608
top right: Ecological niche disparity through time (DTT) for penguins (top right), with the 609
phylogeny projected onto niche parameter space on the y-axis (maximum surface water 610
temperature) with predicted niche occupancy (PNO) over time (x-axis) reconstructed for 611 internal nodes. 612 613 614
Fig. 2. Summary of introgression among penguin taxa. Arrows represent the
615
percentage of introgression (>2%) between taxa for all 8 combinations of the five-taxa 616
statements evaluated (see Fig. S9, Table S7). 617
618 619
Galapagos Humboldt Magellanic African
Adelie Chinstrap Ant Falk Ker Cro
Fiordland Erect- Southern Eastern Northern Macaroni
crested Rockhoppers Gentoo 11% 9% 14% 24% 25% 17-23%
620
Fig. 3. Analysis of genes under positive selection in extant penguin lineages. The
621
main panel depicts results from the network analysis of positively selected genes, 622
retrieving two connected main clusters, one associated with general cellular functions 623
(green) and another grouped genes related to functions associated with osmoregulation 624
(renal function), immunity, thermoregulation (e.g. blood pressure) and diving ability (e.g. 625
oxygen metabolism) which are classified at the right pie-chart around the penguin. 626
627 628
629
Fig. 4. Demographic history of penguins. Pairwise Sequentially Markovian
630
Coalescent (PSMC) plot depicting the demographic history of each lineage inferred from 631
genomic data represented by different colored lines (see Fig. S16 for bootstrapped 632
curves). The period of the Naynayxungla glaciation, Penultimate glaciation and the Last 633
glaciation are represented in the plots, as well as the Last Glacial Maximum (LGM). 634