HAL Id: inserm-01467873
https://www.hal.inserm.fr/inserm-01467873
Submitted on 14 Feb 2017
HAL is a multi-disciplinary open access
archive for the deposit and dissemination of
sci-entific research documents, whether they are
pub-lished or not. The documents may come from
teaching and research institutions in France or
abroad, or from public or private research centers.
L’archive ouverte pluridisciplinaire HAL, est
destinée au dépôt et à la diffusion de documents
scientifiques de niveau recherche, publiés ou non,
émanant des établissements d’enseignement et de
recherche français ou étrangers, des laboratoires
publics ou privés.
Loïc Guillot, et al.
To cite this version:
Milena Magalhães, Isabelle Rivals, Mireille Claustres, Jessica Varilh, Mélodie Thomasset, et al.. DNA
methylation at modifier genes of lung disease severity is altered in cystic fibrosis. Clinical Epigenetics,
BioMed Central, 2016, 9 (1), pp.19. �10.1186/s13148-016-0300-8�. �inserm-01467873�
R E S E A R C H
Open Access
DNA methylation at modifier genes of lung
disease severity is altered in cystic fibrosis
Milena Magalhães
1, Isabelle Rivals
2, Mireille Claustres
1,3, Jessica Varilh
1,3, Mélodie Thomasset
1,
Anne Bergougnoux
1,3, Laurent Mely
4, Sylvie Leroy
5, Harriet Corvol
6,7,8, Loïc Guillot
6,7, Marlène Murris
9,
Emmanuelle Beyne
1,3, Davide Caimmi
10, Isabelle Vachier
10, Raphaël Chiron
10and Albertina De Sario
1*Abstract
Background: Lung disease progression is variable among cystic fibrosis (CF) patients and depends on DNA mutations in the CFTR gene, polymorphic variations in disease modifier genes, and environmental exposure. The contribution of genetic factors has been extensively investigated, whereas the mechanism whereby environmental factors modulate the lung disease is unknown. In this project, we hypothesized that (i) reiterative stress alters the epigenome in CF-affected tissues and (ii) DNA methylation variations at disease modifier genes modulate the lung function in CF patients. Results: We profiled DNA methylation at CFTR, the disease-causing gene, and at 13 lung modifier genes in nasal epithelial cells and whole blood samples from 48 CF patients and 24 healthy controls. CF patients homozygous for the p.Phe508del mutation and≥18-year-old were stratified according to the lung disease severity. DNA methylation was measured by bisulfite and next-generation sequencing. The DNA methylation profile allowed us to correctly classify 75% of the subjects, thus providing a CF-specific molecular signature. Moreover, in CF patients, DNA methylation at specific genes was highly correlated in the same tissue sample. We suggest that gene methylation in CF cells may be co-regulated by disease-specific trans-factors. Three genes were differentially methylated in CF patients compared with controls and/or in groups of pulmonary severity: HMOX1 and GSTM3 in nasal epithelial samples; HMOX1 and EDNRA in blood samples. The association between pulmonary severity and DNA methylation at EDNRA was confirmed in blood samples from an independent set of CF patients. Also, lower DNA methylation levels at GSTM3 were associated with the GSTM3*B allele, a polymorphic 3-bp deletion that has a protective effect in cystic fibrosis.
Conclusions: DNA methylation levels are altered in nasal epithelial and blood cell samples from CF patients. Analysis of CFTR and 13 lung disease modifier genes shows DNA methylation changes of small magnitude: some of them are a consequence of the disease; other changes may result in small expression variations that collectively modulate the lung disease severity.
Keywords: DNA methylation, Co-methylation, Nasal epithelial cells, Cystic fibrosis, Modifier gene, Pulmonary function, Polymorphism, Next-generation sequencing, Pyrosequencing
Background
Environmental factors (i.e., nutrition, maternal diet, pollution, exercise, and lifestyle) influence the pheno-type of living organisms by shaping their epigenome and consequently by affecting gene expression [1]. Change in the epigenome could contribute to human diseases and might explain the incomplete penetrance
of some mutations as well as the age of appearance of symptoms [2].
Cystic fibrosis (CF) is a monogenic disease that results from mutations in the cystic fibrosis transmembrane con-ductance regulator (CFTR) gene that encodes a cAMP-regulated epithelial chloride channel. This life-threatening disease is characterized by recurrent pulmonary infections, chronic inflammation, pancreatic insufficiency, and male infertility. Although multiple organs are affected, morbidity and mortality are mainly due to the lung disease because chronic infections and abnormal inflammation lead to
* Correspondence:albertina.de-sario@inserm.fr
1Laboratoire de Génétique de Maladies Rares, EA7402 Montpellier University,
Montpellier, France
Full list of author information is available at the end of the article
© The Author(s). 2017 Open Access This article is distributed under the terms of the Creative Commons Attribution 4.0 International License (http://creativecommons.org/licenses/by/4.0/), which permits unrestricted use, distribution, and reproduction in any medium, provided you give appropriate credit to the original author(s) and the source, provide a link to the Creative Commons license, and indicate if changes were made. The Creative Commons Public Domain Dedication waiver (http://creativecommons.org/publicdomain/zero/1.0/) applies to the data made available in this article, unless otherwise stated.
ation of three factors: (i) DNA mutations in the CFTR gene, (ii) polymorphic variations in other genes, and (iii) environmental exposure.
The contribution of genetic factors to CF phenotype has been extensively investigated by previous studies [3]. DNA mutations have been classified in six groups, depending on the mechanism by which they alter CFTR synthesis, traffic, and function [4]. The p.Phe508del mutation (dele-tion of the phenylalanine residue at posi(dele-tion 508) leads to protein misfolding and degradation. This mutation is very frequent in the Caucasian population (it is homozygous in 40% of CF patients) and is generally, but not always, asso-ciated with a severe phenotype. Genetic and transcrip-tomic studies have provided a rich compilation of genes that can modify the CF outcome and are responsible for the disease variability [5–7]. Genotype-phenotype correla-tions in CF twins showed that environmental factors also contribute to pulmonary function variation in CF patients [3, 8], but the precise mechanism whereby these factors modulate the lung disease is unknown. The respiratory system is exposed to environmental stimuli (e.g., chemi-cals, dust, bacteria, or viruses). Of note, CF airway tissues are exposed not only to these external pollutants but also to the high cellular stress generated by the inflammatory and immune responses. Oxidative products generated by the inflammatory response can alter DNA methylation in both directions. Oxidation of 5-methylcytosines and 8-guanosines hinders MBP and DNMT1 binding, favoring loss of DNA methylation [9]. Oxidative compounds pro-duced by the neutrophilic response generate halogenated cytosines that, because they mimic CpG methylation, are recognized by the methyl-binding proteins (MBP) and by the DNMT1 and, hence, favor methylation gain [10, 11]. In CF airway tissues, the oxidative stress is high and the neutrophil response particularly strong. Therefore, we hy-pothesized that (i) reiterative stress alters the epigenome in CF-affected tissues and (ii) DNA methylation changes at CF modifier genes contribute to the lung function variations observed in CF patients. To test our hypoth-eses, we profiled DNA methylation in healthy controls and homozygous p.Phe508del CF patients stratified according to their pulmonary function. We analyzed CFTR, the disease-causing gene, and 13 lung modifier genes. Ten genes were identified by genetic association studies. They encode proteins involved in inflammatory and immune responses (TLR2, TLR5, TGFβ2, and IFRD1), oxidative stress (HMOX1, GSTM1, and GSTM3), bronch-oconstriction (EDNRA), and mucus structure and hydra-tion (MUC5AC and ENaCγ). Three genes (ATF1, DUOX2, and YY1) were differentially expressed in nasal epithelial cells collected from CF patients characterized by extreme disease phenotypes [5].
from the patients. Here, we used nasal epithelial cells (NEC), which are an informative model to study DNA methylation in airway diseases [12], and blood cells be-cause most of the analyzed genes encode proteins that are involved in the inflammatory and immune responses.
Results
DNA methylation analysis in NEC and blood samples
The study was carried out in NEC and blood samples from the METHYLCF cohort that includes 48 CF pa-tients and 24 healthy controls (Table 1). Using bisulfite and next-generation sequencing (BS-NGS), we analyzed DNA methylation at CpG islands associated with CFTR and 13 CF lung modifier genes (Table 2). The analyzed regions ranged from 133 to 264 bp, included from 5 to 26 CpG dinucleotides, and were less than 1550 bp away from the transcriptional start site (TSS), except for the MUC5AC CpG island that was in the gene body (from exon 35 to intron 35–36). In each region, we measured the methylation at single CpG dinucleotides and the mean DNA methylation. DNA methylation was profiled in 72 blood samples (all patients and controls) and in 63 NEC samples (39 CF patients and all healthy controls). Six patient NEC samples did not provide enough genomic DNA and three samples were reserved for further analyses. To evaluate the repeatability of the BS-NGS methylation analyses, we duplicated the measurements of the 14 genes in four CF patients in both tissues. The esti-mated standard deviation of DNA methylation reached 0.44 in the logit unit used for variance homogenization. This is quite high because the standard deviation of the methylation around its mean value was of the order of 0.43 in blood and of 0.52 in NEC samples, for both the CF patients and the healthy controls. Nevertheless, the correl-ation between DNA methylcorrel-ation data in the two independ-ent experimindepend-ents was excellindepend-ent (Spearman’s r = 0.97, p = 0) (Additional file 1: Figure S1).
In the control samples, DNA methylation was very high at MUC5AC (median value 95% in blood and 83% in NEC samples), high at TLR5 (median value 38% in blood and 26% in NEC samples), and low in the other genes (<20% for both sample types) (Additional file 2: Figure S2). A partial least square discriminant analysis of the mean DNA methylation (the descriptors were the percentage of DNA methylation at the 14 genes in blood and NEC samples) provided 75% of correct clas-sification of CF patients versus controls (Fig. 1). The percentage of correct classification was slightly lower when we used DNA methylation data from NEC sam-ples alone (72%) and even lower with data from blood samples (69%) (Fig. 1).
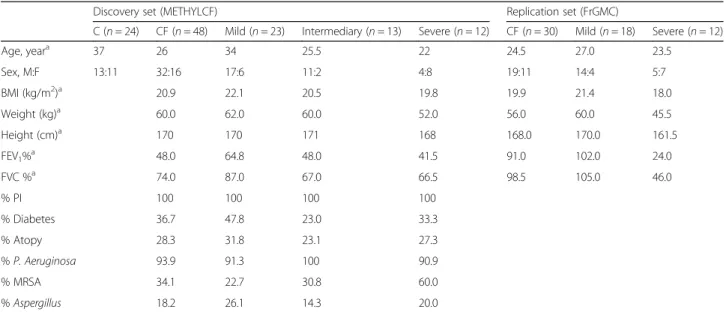
Table 1 Demographic and relevant clinical features of CF patients and controls
Discovery set (METHYLCF) Replication set (FrGMC)
C (n = 24) CF (n = 48) Mild (n = 23) Intermediary (n = 13) Severe (n = 12) CF (n = 30) Mild (n = 18) Severe (n = 12) Age, yeara 37 26 34 25.5 22 24.5 27.0 23.5 Sex, M:F 13:11 32:16 17:6 11:2 4:8 19:11 14:4 5:7 BMI (kg/m2)a 20.9 22.1 20.5 19.8 19.9 21.4 18.0 Weight (kg)a 60.0 62.0 60.0 52.0 56.0 60.0 45.5 Height (cm)a 170 170 171 168 168.0 170.0 161.5 FEV1%a 48.0 64.8 48.0 41.5 91.0 102.0 24.0 FVC %a 74.0 87.0 67.0 66.5 98.5 105.0 46.0 % PI 100 100 100 100 % Diabetes 36.7 47.8 23.0 33.3 % Atopy 28.3 31.8 23.1 27.3 % P. Aeruginosa 93.9 91.3 100 90.9 % MRSA 34.1 22.7 30.8 60.0 % Aspergillus 18.2 26.1 14.3 20.0 PI pancreatic insufficiency a Median
Table 2 CFTR and CF modifier genes
Gene symbol
Gene name Genomic coordinatesa nb.
CpGb
Amplicon size (bp)
Differentially methylated CpG sitesc
Blood NEC ATF1 Activating transcription
factor1 chr12:50,764,850-50,765,098 12 249 CFTR Cystic fibrosis transmembrane conductance regulator chr7:117,479,627-117,479,759 10 133 1(−)
DUOX2 Dual oxidase 2 chr15:45,114,541-45,114,722 11 182 EDNRA Endothelin receptor
type A
chr4:147,480,957-47,481,216 21 260 2(–) 3(–) 4(–) 8(–) 9(–) 16(–)
5(+) 10(+) ENaCγ Epithelial sodium
channel chr16:23,182,420-23,182,665 23 246 2(–) 9(–) 11(+) 2(–) 6(+) 16(–) GSTM1 Glutathione S-transferase mu 1 chr1:109,687,687-109,687,897 13 211 GSTM3 Glutathione S-transferase mu 3 chr1:109,740,573-109,740,793 9 221 1(–) 3(–) 4(–) 5(–) 6(–) 7(–) 8(–) 4(–) 9(–) HMOX1 Heme oxygenase 1 chr22:35,381,269-35,381,436 5 168 2(–) 3(–) 4(+) 5(–) 2(+) IFRD1 Interferon-related developmental regulator 1 chr7:112,450,883-112,451,040 12 158 10(–) MUC5AC Mucine 5 AC chr11:1,194,622-1,194,807 13 186 1(+) 10(+) 12(+) 13(–) 1(+) 3(+) 4(+) 5(–) 8(+) 10(+) 11(+) 12(+) 13(+) TGFβ TGFβ1 Transforming growth factor chr19:41,353,542-41,353,740 19 199 10(–) TLR2 Toll-like receptor 2 chr4:153,684,576-153,684,704 12 129 8(–) TLR5 Toll-like receptor 5 chr1:223,142,813-223,142,967 8 155 8(–) YY1 Yin-Yang 1 transcription factor chr14:100,240,497-100,240,751 26 255 8(–) 22(–) a
Human Genome GRCh38/hg38 build b
nb of CpG in the analyzed region c
Besides the mean DNA methylation, we calculated the DNA methylation at individual CpG dinucleotides (n = 194 in the fourteen genes). Forty-two CpG sites (21%) in nine genes were differentially methylated be-tween patients and controls in at least one tissue (Table 2). Specifically, 19 CpG sites were differentially methylated in NEC samples and 29 in blood samples. In NEC samples, most CpG sites were more methyl-ated in CF patients than in controls (12 out of 19). Conversely, in blood samples, most of the differen-tially methylated CpG sites (24 out of 29) were less methylated in CF patients than in controls.
DNA methylation correlations in CF cells
Next, we looked for inter-tissue (DNA methylation of a gene in both cell types) and intra-tissue (DNA methyla-tion of two genes in the same tissue) correlamethyla-tions. Data from CF patients and controls were analyzed separately using stringent criteria (Bonferroni-controlled
family-wise error rate (FWER) = 10%). Correlations were calcu-lated using the mean DNA methylation of each gene region. Interestingly, DNA methylation at GSTM3 was highly correlated in NEC and blood samples collected from the same individuals, both in controls and CF pa-tients (Fig. 2). This finding suggests that methylation level at GSTM3 is under genetic control.
Moreover, a few intra-tissue correlations were found in genomic DNA from CF patients (Fig. 2). Specifically, in NEC samples, we found two co-methylation modules: (i) the DNA methylation level of TLR5 correlated with that of MUC5AC, CFTR, and HMOX1 and (ii) the DNA methylation level of HMOX1 correlated with that of EDNRAand CFTR. In blood samples, the DNA methyla-tion level of HMOX1 correlated with that of CFTR and with TLR2.
In control samples, no intra-tissue correlations were sig-nificant with a FWER of 10%. All genes were expressed in the tissue where their co-methylation was found, except
Fig. 1 (Top) Partial least square (PLS) discriminant analyses of CF patients and controls in blood, NEC, and both tissue samples and the percentage of correct classification of the subjects in each analysis. v1,v2 are the scores on the first two PLS axes. (Bottom) The descriptors are mean DNA methylation of 14 genes
for CFTR that was not expressed in blood samples. Thus, gene expression does not seem to be an essential pre-requisite for co-methylation. We assessed gene expression by RT-PCR using NEC and blood mRNAs from two healthy individuals (data not shown).
HMOX1 was differentially methylated in NEC and blood samples from CF patients
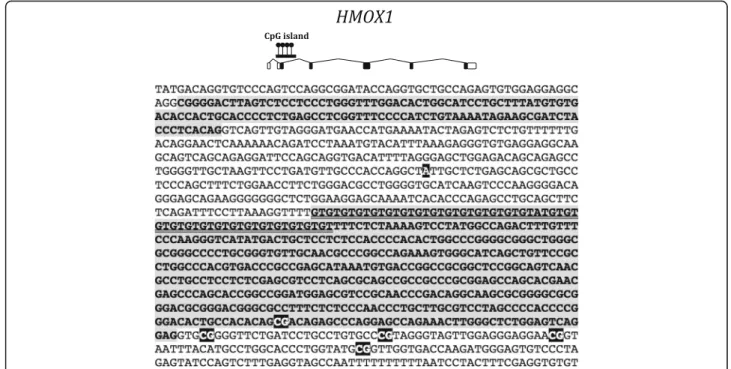
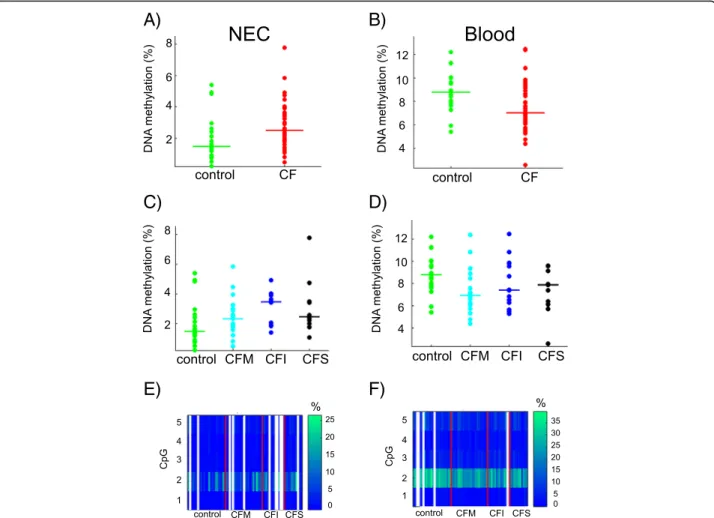
Next, we focused on genes that were differentially methylated in CF patients or groups of patients. HMOX1 was previously identified as a CF modifier gene by genetic association studies [13]. We measured DNA methylation at the CpG island that overlaps exon 2 (Fig. 3). Using the mean DNA methylation in the re-gion, we found that HMOX1 was differentially methyl-ated in NEC samples (Student p = 0.018) and blood cell samples (Wilcoxon p = 0.009) of CF patients compared with controls, but the direction of the methylation change was not the same in the two tissue models (Fig. 4a, b). Moreover, DNA methylation was associated with lung disease severity (ANOVA p = 0.052 in NEC samples; Kruskal-Wallis p = 0.035 in blood samples) (Fig. 4c, d). One CpG dinucleotide (CpG#2) was more methylated than the other four CpG in the region (ap-proximately 30% compared with <10%) (Fig. 4e, f ). CpG#2 was differentially methylated in CF patients compared with controls in both tissues (Bonferroni cor-rected q = 0 in blood and q = 2.7 10−3in NEC) and was associated with pulmonary severity in blood samples (Kruskal-Wallis p = 0.0019).
DNA methylation at HMOX1 was not associated with nearby polymorphisms
Previous studies showed that two polymorphic sequences in the 5′ untranslated region of HMOX1 were associated with lung function in airway diseases. Specifically, the minor allele of the A(-413)T variant (rs2071746) was asso-ciated with CF lung disease severity in two independent cohorts [13] (Fig. 3). Next to this single-nucleotide poly-morphism (SNP), the length of a (GT)nmicrosatellite
cor-related with pulmonary severity in airway (emphysema and COPD) and cardiovascular diseases [14, 15] (Fig. 3). Long microsatellites (>32 repeats) were associated with lower levels of transcription in vitro and with an adverse clinical phenotype in patients [16]. Because these polymorphisms were close (600 bp upstream) to the region analyzed in this study, we asked whether they affected DNA methylation. We assessed the A(-413)T SNP and the microsatellite length in CF patients and healthy volunteers of the METHYLCF cohort and found that DNA methylation levels (mean methylation of the amplicon and methylation at CpG#2) in NEC and blood samples did not correlate with any genotype (Spearman’s correlation test) (Additional file 3: Table S2).
DNA methylation at HMOX1 was not associated with a significant change of gene expression
Next, we asked whether DNA methylation at HMOX1 af-fected gene expression. In blood cells, DNA methylation
A)
B)
Fig. 2 The matrices show inter-tissue (mean DNA methylation of a gene in both cell types) and intra-tissue (mean DNA methylation of two genes in one tissue) correlations in controls (a) and CF patients (b). The prefix n- or b- in front of the gene name indicates that DNA methylation was measured in NEC or blood samples, respectively. Significant correlations (black square) were calculated using Spearman’s test with a Bonferroni-controlled family-wise error rate (FWER) = 10%
and gene expression were analyzed in samples collected from the same individuals. HMOX1 was not differentially expressed in CF patients compared with controls (Wil-coxon p = 0.11) or in patients stratified according to the lung disease severity (Kruskal-Wallis p = 0.39) (Fig. 5a). Also, expression and DNA methylation levels (mean methylation of the amplicon and methylation at CpG#2) were not correlated, be it in the whole cohort (Spear-man’s r = 0.09, p = 0.48) or separately in the control (Spearman’s r = −0.14, p = 0.62) and in the CF (Spearman’s r= 0.08, p = 0.58) populations (Fig. 5b).
RNA could not be extracted from the NEC samples of the METHYLCF cohort because the whole amount of cells had to be used to isolate genomic DNA. Therefore, to determine the expression levels in NEC samples, we inspected data from three publicly available transcrip-tomic studies [5, 17, 18]. HMOX1 was not differentially expressed in CF compared with control NEC. The only study that compared mild versus severe CF patients was not informative for this gene [5].
EDNRA was differentially methylated but not differentially expressed in CF blood samples
EDNRAencodes a G protein-coupled receptor that, fol-lowing binding to endothelin, triggers cellular prolifera-tion and contracprolifera-tion of smooth muscle cells. In CF airways, higher level of endothelin may contribute to the pulmonary phenotype [19]. In the METHYLCF cohort,
EDNRAwas less methylated in CF than in control blood samples (Wilcoxon p = 0.017) and DNA methylation level correlated with the lung disease severity (Kruskal-Wallis p = 0.028) (Fig. 6a, b). The DNA methylation at individual CpG sites was homogeneous, close to the mean methylation in the region (Fig. 6c).
Gene expression was not detectable in blood cells, even in CF samples where EDNRA was less methylated. Thus, we concluded that loss of DNA methylation at EDNRAwas a consequence rather than a cause of lung disease severity.
DNA methylation levels at GSTM3 were associated with lung disease severity and correlated with the GSTM3*B allele
The mean DNA methylation at GSTM3 was not signifi-cantly different in CF and control samples; however, it was associated with CF lung disease severity in NEC samples (ANOVA p = 0.016) (Fig. 7a). DNA methylation at individ-ual CpG sites was homogeneous (Fig. 7b).
Previous studies showed that various polymorphisms of the GST(M) genes contribute to lung disease severity in CF patients [20] and that GST activity may modulate P. aeruginosa lung infection [21]. Of note, the GSTM3*B allele, a 3-bp deletion that has a protective effect in CF patients, is 6.1 kb downstream of the region analyzed in this study. To determine whether this poly-morphic sequence affected DNA methylation levels, we
Fig. 3 Top, HMOX1 exon-intron structure and position of the CpG island. Bottom, HMOX1 partial genomic sequence showing exons 1 and 2 (gray background) and introns (white background). Also shown, the five CpG (in white on black background) where we measured DNA methylation, the major“A” allele of SNP rs2071746 (white on black background) and the polymorphic (GT)nmicrosatellite (underlined) in exon 2
genotyped patients and controls for the micro-deletion (Additional file 3: Table S2). Interestingly, in both NEC and blood samples, DNA methylation levels at GSTM3 correlated with the presence of the GSTM3*B allele (Spearman’s NEC r = −0.43 p = 5 10−4; blood r =−0.42 p= 2.8 10-4). DNA methylation levels in homozygous GSTM3*B carriers were lower than in heterozygous carriers, where they were lower than in homozygous GSTM3*Acarriers (Fig. 7c, d).
Replication of DNA methylation analysis in an independent set of CF patients
To replicate data obtained in the METHYLCF cohort, we selected 30 additional p.Phe508del homozygous pa-tients with severe (n = 12) or mild lung disease (n = 18) from an independent CF cohort enrolled by the French CF Gene Modifier Consortium (FrGMC) [22]. Of note,
the phenotype of this set of patients was more extreme than that of the METHYLCF cohort (Table 1). Genomic DNA being available for blood and not for NEC cells, we decided to replicate blood differentially methylated regions (EDNRA and HMOX1), leaving replication of NEC regions for future studies. DNA methylation was measured by locus-specific pyrosequencing. To analyze EDNRA, we used a pyrosequencing assay located 350 bp downstream of the region that was targeted by BS-NGS. In the replication set of patients, DNA methylation at EDNRA was signifi-cantly associated with lung disease severity (Kruskal-Wallis p= 0.047) (Additional file 4: Figure S3). DNA methylation in mild CF patients was higher than in controls (Wilcoxon p= 0.023) and slightly higher than in severe patients (not significant). Overall, EDNRA DNA methylation levels by pyrosequencing were higher than those obtained by BS-NGS: this is consistent with previous results by
A)
B)
C)
D)
E)
F)
Fig. 4 DNA methylation at HMOX1. The dot plots represent the mean DNA methylation of HMOX1 in CF patients compared with controls in NEC (Student p = 0.018) (a) and in blood (Wilcoxon p = 0.009) samples (b). DNA methylation levels depended on pulmonary severity (NEC, ANOVA p = 0.052 (c); blood, Kruskal-Wallis p = 0.035 (d)). The horizontal line indicates the median in each group. The heat maps represent the DNA methylation at five CpG dinucleotides in NEC (e) and blood (f) samples. White lines represent missing data. CFM mild CF patient, CFI intermediary CF patient, CFS severe CF patient
Potapova et al. [23] who compared the two methods and showed a trend towards higher values in the range between 0 and 20% DNA methylation.
For HMOX1, all tested primers failed to provide a linear pyrosequencing signal in the region of interest.
Discussion
In this study, we provide the first DNA methylation pro-file using tissue samples collected from CF patients. We measured DNA methylation at CpG islands associated with CFTR and 13 CF modifier genes. DNA methylation
A) B)
Fig. 5 HMOX1 gene expression in blood samples. a The box plots represent the relative expression of HMOX1 in CF patients with different lung disease and controls (Kruskal-Wallis p = 0.39). CFM mild CF patient, CFI intermediary CF patient, CFS severe CF patient. b Correlation between gene expression and mean DNA methylation levels in blood samples from CF patients and controls. Whole cohort (Spearman’s r = 0.09, p = 0.48); controls (Spearman’s r = −0.14, p = 0.62); CF patients (Spearman’s r = 0.08, p = 0.58)
A)
B)
C)
Fig. 6 DNA methylation at EDNRA in blood samples. a The dot plots represent the mean DNA methylation of EDNRA in CF patients compared with controls (Wilcoxon p = 0.017). b DNA methylation at EDNRA correlated with pulmonary severity (Kruskal-Wallis p = 0.028). The horizontal line indicates the median in each group. c The heat map represents DNA methylation at 21 CpG dinucleotides. CFM mild CF patient, CFI intermediary CF patient, CFS severe CF patient
levels were altered not only in NEC, which are directly affected by the disease (CF patients often have rhinitis and nasal polyposis), but also in blood cells where CFTR is not expressed. By combining the DNA methylation data obtained in NEC and blood cells, we correctly clas-sified 75% of the subjects, distinguishing homozygous p.Phe508del CF patients from controls. This finding sug-gests that DNA methylation variations in specific genes may provide a CF-specific molecular signature.
Our study has also disclosed a number of genes whose methylation seemed to be co-regulated in CF samples. Concomitant DNA methylation changes in two or more genes have been already described in solid tumors, in-cluding in lung adenocarcinomas [24] and in sputum samples of asthmatic smokers [25]. More recently, van Eijk et al. identified networks of methylation and co-expression modules in blood samples collected from healthy individuals [26]. In this genome-wide analysis, co-methylation and co-expression modules contained few overlapping genes, but several pairs of methylation and expression modules were significantly correlated [26]. Moreover, because they were enriched in gene ontology categories, these modules were considered bio-logically relevant. The actual mechanism responsible for
their generation is unknown, however, the existence of factors that affect DNA methylation and gene expression acting in trans at the module level was hypothesized [26]. In our study, using stringent conditions, we observed gene co-methylation exclusively in patient samples. Therefore, we suggest the involvement of trans-acting factors that are specifically activated by the disease, namely by the oxidative stress and the inflammatory and immune responses. A genome-wide DNA methylation analysis of CF samples is required to better understand this phenomenon.
By comparing patients and controls, we found significant DNA methylation variations at two CF modifier genes: HMOX1 (in NEC and blood cells) and EDNRA (in blood cells). Moreover, the DNA methylation level at three genes (GSTM3 in NEC and HMOX1 and EDNRA in blood samples) was associated with lung disease severity. The association between pulmonary severity and DNA methyla-tion at EDNRA was replicated using blood samples from an independent set of CF patients. The magnitude of the methylation changes in lung severity modifier genes was small. Three lines of evidence show that small epigenomic changes can be biological meaningful. First, many epi-demiological studies showed that the environment induces
A)
B)
C)
D)
Fig. 7 DNA methylation at GSTM3. The mean DNA methylation at GSTM3 depended on pulmonary severity (ANOVA p = 0.016) (a). The heat maps represent DNA methylation at nine CpG dinucleotides in NEC samples; white lines represent missing data (b). Low methylation levels correlated with the GSTM3*B allele both in blood (Spearman’s r = −0.42, p = 3 10−4) (c) and NEC samples (Spearman’s r =−0.43, p = 5 10−4) (d). CFM mild CF patient, CFI intermediary CF patient, CFS severe CF patient. The horizontal line in the dot plots indicates the median in each group. A/A homozygous GSTM3*A, A/B heterozygous, B/B homozygous GSTM3*B
pulmonary disease and exposed to fine particulate matter (PM2.5) constituents, hypomethylation of the
NOS2A gene (about−1.5%) was associated with a higher (about +18%) fractional concentration of exhaled nitric oxide (FeNO), a biomarker of airway inflammation [27]. In patients with type 2 diabetes mellitus (T2DM), a CpG dinucleotide in the first intron of the FTO gene was hypo-methylated (−3.35%) and the odds of belonging to the T2DM group increased by 6.1% for every 1% decrease in DNA methylation [28]. Second, experimental studies in animals showed the impact of small methylation changes on gene expression. In the offspring of rat fed with a protein-restricted diet during pregnancy, a small decrease of DNA methylation in the promoter of PPARα was asso-ciated with an increase of gene expression [29]. Third, a genome-wide expression analysis in patients affected by type 2 diabetes mellitus showed that small expression changes in multiple genes belonging to the same pathway had a bigger impact than a high-fold change in a single gene [30, 31]. Collectively, these findings lead us to suggest that small DNA methylation variations in lung modifier genes can impact cystic fibrosis severity.
HMOX1 encodes a protein that is important for iron homeostasis and cell protection from oxidative damage during stress. Activating and repressive factors regulate the HMOX1 basal expression by interacting with the promoter and various stimuli (i.e., heme, cadmium, and oxidative stress) switch on its induced expression via binding to responsive elements [32]. Of note, the CpG island targeted in our DNA methylation analysis con-tains an HMOX1 hydrogen peroxide-responsive element [14]. CF tissues are exposed to continuous stress by the immune and inflammatory responses. Here, we found that HMOX1 was differentially methylated both in blood and NEC samples from CF patients compared with con-trols, but the direction of the methylation change was not the same in the two tissue models. One possible explanation is that DNA methylation levels result from a balance between the burden of halogenic compounds produced by the inflammatory response (especially by neutrophils) that favors methylation gain [10, 11] and other oxidative products responsible for methylation loss [9]. The contribution of these opposing factors is likely to be different in blood and NEC because NEC are directly affected by cystic fibrosis. In addition, in NEC samples, the increase of DNA methylation at the pro-moter of HMOX1 was non-monotonic in CF patients stratified according to the lung disease severity. The intensity of the inflammatory response and of the oxida-tive stress in the airway tissues varies among patients and correlates with the lung disease [33, 34]. The proportion of oxidative products changing DNA methylation in opposite
effect of DNA methylation on HMOX1 transcription de-serves further analysis. In NEC samples, the small amount of cells did not allow us to carry DNA methylation and gene expression analysis on the same samples. In blood samples, we failed to demonstrate a significant impact of DNA methylation on expression, possibly due to the lack of statistical power of the present cohort.
EDNRA encodes a G protein-coupled receptor that, following ligation to endothelin, causes contraction of smooth cells. Previous genetic studies showed an associ-ation between EDNRA DNA polymorphisms and pulmon-ary disease in four independent cohorts of CF patients [19]. Also, a functional study showed that an allele that is deleterious for the lung function resulted in higher EDNRA mRNA levels in human tracheal smooth muscle cells [19]. Our study shows that EDNRA was hypomethy-lated in CF patients and DNA methylation levels were associated with pulmonary disease severity in blood cells. Because EDNRA transcripts were not detected in control nor in CF samples, we conclude that loss of DNA methy-lation had no impact on gene expression and was probably a consequence rather than a cause of lung disease severity. Compelling evidence shows that DNA methylation is affected not only by environmental but also by genetic factors. Of note, methylation levels at 2–7% of CpG sites are associated with cis-DNA variants and may provide the molecular mechanisms for the associated quantita-tive trait locus [26]. In the present study, we realized that two differentially methylated regions mapped close to polymorphic sequences that have been previously shown to be associated with the pulmonary function in airway diseases: two DNA variants were in the 5′ un-translated region of HMOX1 and the third one was in the body of GSTM3. Since we found no correlation between DNA methylation levels and two polymorphic sequences in HMOX1, we suggest that DNA methylation and the two polymorphisms are independently associ-ated with lung function. This result should be validassoci-ated in an independent cohort. Conversely, two findings in our study suggest that DNA methylation in the GSTM3 gene is under genetic control. First, DNA methylation at GSTM3 was highly correlated with the presence of the GSTM3*B allele both in NEC and blood samples. Sec-ond, we found a high positive correlation between GSTM3 DNA methylation levels in the blood and NEC samples from the same individuals. These results are consistent with a previous study showing that diplotypes in the GSTM3 gene predicted DNA methylation levels at five CpG dinucleotides scattered in the gene, outside the region we analyzed [35]. The GSTM3*B allele, a 3-bp de-letion in intron 6, is associated with higher level of GSTM3 mRNA and protein expression [36]. To explain
this association, it was proposed that the 3-bp deletion generates a binding site for the transcription factor YY1 [37]. We hypothesize that upon activation by YY1 or another transcription factor, the GSTM3*B intronic se-quence binds to the gene promoter via a chromatin loop and causes a reduction in the DNA methylation level in the same region. The GSTM3 protein conjugates various toxic compounds to glutathione, thus, similarly to HMOX1, has a protective effect in cells, and is particularly beneficial to CF damaged tissues.
The present study has limitations. We analyzed 48 CF patients and 24 healthy controls. Confirmatory studies should be carried out on a larger number of patients. DNA methylation was analyzed in 14 lung modifier genes and restricted to the promoter regions. Future studies should cover the whole genome including other genic and intergenic regulatory regions (enhancers, insulators, etc). We could not analyze gene expression in NEC samples because the whole amount of cells had to be used for DNA extraction.
Conclusions
In summary, we showed that DNA methylation was altered in nasal epithelial and blood samples from CF pa-tients and, using stringent conditions, we observed mod-ules of gene co-methylation exclusively in patient samples. Through the analysis of 13 lung disease-modifiers genes, we found DNA methylation changes of small magnitude in two genes (HMOX1 and EDNRA). DNA methylation was associated with pulmonary severity in three genes (HMOX1, GSTM3, and EDNRA) and with a polymorphic deletion that has a protective effect in cystic fibrosis at one gene (GSTM3). Some of these small DNA methylation changes are a consequence of the disease. Other changes may result in small expression variations that collectively and over time modulate the lung disease severity. Genome-wide epigenomic, transcriptomic and genomic analyses are needed to further understand how genetic and epigenetic factors contribute to the large spectrum of lung disease severity in cystic fibrosis.
Methods
Study cohorts
The study was approved by the local Institutional Review Board (CPP Sud Méditerranée III, Nîmes #2013.02.01bis). Informed written consent was obtained from all partici-pants. Table 1 lists the demographic and relevant clinical features of two cohorts. CF patients were homozygous for the p.Phe508del mutation and≥18-year-old. Exclusion cri-teria for CF patients included lung transplantation and pulmonary exacerbation during sample collection.
The METHYLCF cohort includes 48 CF patients and 24 healthy controls with no history of airway diseases or allergy. It was enrolled in four CF centers in the South
of France. CF patients were stratified into three groups based on the severity of the lung disease and mainly using the FEV1% predicted: mild (48% of patients),
intermediary (27%), and severe (25%). Patients with FEV1% predicted values that corresponded to the top
and bottom quartiles were classified as mild and severe, respectively [38]. CF patients of age ≥34 years were considered mild because of their long survival. The age distribution did not differ between patients and con-trols (Wilcoxon p = 0.30). The male-to-female ratio was slightly, but not significantly, higher in CF patients than in controls (χ2
p= 0.22).
From the already available FrGMC cohort (French Ethical Board, CPP #2004/15) [22], a replication set of CF patients (12 patients with severe and 18 patients with mild pulmon-ary disease) was selected. They were stratified using the same criteria as for the METHYLCF cohort.
Biological samples
Biological samples were collected from the METHYLCF cohort, whereas blood genomic DNA was already avail-able for the replication FrGMC cohort.
Nasal epithelial cellswere collected from the inferior tur-binate using nasal curettes (Rhino-probe, Arlington) after nebulization with 5% xylocaine (Astrazeneca, France). NEC were collected from both nostrils, pooled together in 1 ml RNA protect Cell Reagent (#76526 Qiagen), and then shipped to the handling center at room temperature.
Whole blood sampleswere collected in EDTA (5 ml) and in PAXgene (2.5 ml) tubes (#762165, Becton Dickinsen) for DNA and RNA extraction, respectively.
DNA extraction
NEC collected in RNAprotect Cell Reagent (#76526 QIAGEN) were treated with 1 mg/mL RNAse. Genomic DNA was extracted using the QIAamp DNA Micro Kit (#56304, QIAGEN) as previously described [39]. The mean DNA yield was 5.1 ± 2.8 μg in controls and 3.9 ± 3.1 μg in CF patients (range 0 to 12.4 μg). DNA yield was not significantly different between groups (Wilcoxon p= 0.19).
Genomic DNA was extracted from whole blood sam-ples using the Flexigene DNA kit (#51206, QIAGEN) ac-cording to the manufacturer’s recommendations.
RNA extraction
RNA was extracted from whole blood samples using the PAXgene Blood RNA kit (#762124, PreAnalytix), accord-ing to the manufacturer’s recommendations.
Bisulfite conversion
NEC and blood DNA samples were treated with sodium bisulfite as previously described [40].
long amplicons in the region of interest (Additional file 5: Table S1). Each forward primer contained a MID (Multi-plex Identifiers, Roche) to allow computational screening of each sample. PCR products were obtained using the Pyro-Mark PCR kit (#978703, QIAGEN), and 10 μM forward and reverse primers in a 25-μl final volume. PCR conditions were 95 °C for 15 min, followed by 94 °C for 30 s, the annealing temperature for 30s, 72 °C for 30 s for 45 cycles, and then 72 °C for 10 min. Amplicons were purified with the QIAquick PCR Purification Kit (#28106 QIAGEN) and quantified using a NanoDrop 2000 Spectrophotom-eter (Thermo Scientific) and a Qubit 2.0 fluoromSpectrophotom-eter (Life Technologies). In each sequencing run, 112 puri-fied amplicons were pooled in equimolar amounts. Emulsion PCR and subsequent bidirectional sequencing were done according to the GS Junior emPCR Amplifica-tion Method Manual-Lib-A (#05996520001, Roche) and GS Junior Sequencing Method Manual (#05996554001, Roche), respectively.
Sequence analysis
We measured DNA methylation using bisulfite and next-generation sequencing (BS-NGS). To filter and order the raw sequencing data, we developed a pipeline. The script works in a Galaxy environment and includes four steps: (i) a barcode splitter to separate sequences per sample; (ii) a sequence trimming to remove all the MID (multiplex identifiers, Roche) and adaptor sequences; (iii) a barcode splitter to separate sequences per gene; and (iv) analysis of fasta/bam files with BiQAnalyzer HT [41]. BiQAnalyzer HT removes non-fully converted sequences and deter-mines the methylation status of each CpG site within amplicons. It provides a text file where each CpG site is either 1 (methylated) or 0 (unmethylated). A minimal con-version rate of 0.97 was used. Before filtering, the number of reads per analyzed amplicon ranged from 9 to 2704. We retained only the BS-NGS measurements for which the number of sequences was large enough as to have either a coefficient of variation of the mean methylation percentage smaller than 5% or a standard deviation not higher than 1% (the first condition is too stringent for very small methylation percentages). After filtering, 95% of the reads were in the interval [98; 1460].
DNA methylation analysis by pyrosequencing
PCR products were amplified using the PyroMark PCR Kit ((#978703, QIAGEN) in 25μL reaction volume. For EDNRA, the pool of forward and reverse primers (one of which was biotin-labeled at the 5′) as well as the se-quencing primer were from the Hs_EDNRA_02_PM PyroMark CpG Assay (#978746, QIAGEN, Hilden, Germany). The PCR program was 94 °C for 15 min,
purified using 1 μL Streptavidin Sepharose HP™ (#17-5113-01, GE Healthcare) and a PyroMark Q24 Worksta-tion. Pyrosequencing reactions were performed in a PyroMark Q24 (QIAGEN) using the PyroMark Gold Q24 reagents (#970802, QIAGEN) according to the manufacturer’s instructions. Before the assays, we tested the signal linearity using mixtures of methylated and unmethylated genomic DNA (0, 20, 40, 60, 80, and 100%); standard errors were from three replicates.
Genotyping
HMOX1 (GT)nmicrosatellite
Using blood genomic DNA, we amplified a 113–135-bp DNA fragment spanning the (GT)n microsatellite with a
FAM-labeled sense primer (5′-AGAGCCTGCAGCTTCT-CAGA-3′) and an unlabeled reverse primer (5′-ACAAA GTCTGGCCATAGGAC-3′). The PCR program was 94 °C 30 s, 57 °C 90 s, 72 °C 90 s for 30 cycles. PCR products were analyzed using an ABI 3130xl Genetic Analyzer (Applied Biosystem), and the microsatellite size was mea-sured with the Gene Mapper software (Applied Biosystem).
HMOX1 SNP rs2071746
A 139-bp PCR fragment surrounding the A(-413)T SNP (rs2071746) was amplified with the following program: 95 °C 30 s, 64 °C 30 s, 72 °C 30 s for 35 cycles. Primers were forward 5′-GCAGAGGATTCCAGCAGGTG-3′ and reverse 5′-CAGGCGTCCCAGAAGGTTCC-3′. After purification with the QIAquick kit (QIAGEN) and labeling with the Big Dye Terminator (Life Technologies), DNA was sequenced using an ABI 3130xl Genetic Analyzer (Applied Biosystem).
GSTM3 *A and GSTM3*B alleles
A 202-bp PCR fragment was amplified using primers 5′-GCTACCTGGACAACTGAAAC-3′ and 5′-CGGTTC TGATCCAAGATATC-3′ and the following program: 95 °C 5 min, then (95 °C 30 s, 56 °C 30 s, 72 °C 1 min) for 25 cycles and 72 °C 15 min. PCR products were ana-lyzed using an ABI 3130xl Genetic Analyzer (Applied Bio-system) and their size measured with the Gene Mapper software (Applied Biosystem).
Gene expression
For reverse transcription, 500 ng of total blood RNA from each sample was added to Rnase-free water (final volume 8μl) followed by DNase I treatment for 15 min at room temperature. Samples were then added to a mix containing 4μl of first strand 5× buffer, 2 μl of 10× di-thiothreitol, 1μl of 10 mM dNTP mix, 300 ng/μl of hex-aprimer (random primers), 20–40 U/μl of RNasin® enzyme (Promega), and 200 U/μl of MMLV-RT enzyme
(Life Technology). The reverse transcription reaction pro-gram consisted of three steps: 10 min at 25 °C, 50 min at 37 °C, and 15 min at 70 °C. mRNA expression was mea-sured using a LightCycler 480 real-time PCR system and SYBR Green I Master mix® (Roche Diagnostics) (primers are listed in Additional file 5: Table S1). Standard curves were generated for each run by serial dilution of control cDNA. Gene expression levels were expressed as ratios relative to that of reference genes (GAPDH for HMOX1 and TBP for EDNRA). Real-time PCR reactions were done in duplicate in two independent reverse transcriptions.
Statistical analysis
For a given gene, the mean methylation of each individual site as well as the mean methylation percentage over all sites were left for statistical analysis. To homogenize the variance of the mean methylation percentage (which is maximal at 50% and zero at 0 or 100%), we worked with its logit transformation.
To evaluate the repeatability of the BS-NGS methylation analyses, we duplicated the measurements corresponding to the ng= 14 genes of interest for 4 CF patients in
the nt= 2 tissues (blood and NEC) with 106 degrees
of freedom (instead of 4 × ng× nt= 112 due to few
missing values).
To compare the mean methylation level of a given gene in a given tissue between controls and CF patients, and across the whole cohort stratified according to the severity of the lung disease (i.e., controls, mild, intermediary, and severe CF patients), depending on the statistical features of the data (normality or not, homoscedasticity or not), we used either parametric tests (i.e., Student, Welch, and analysis of variance tests) or non-parametric tests (i.e., Wilcoxon and Kruskal-Wallis tests). P values <0.05 were considered statistically significant. To compare the methy-lation status of the individual CpG sites between con-trols and CF patients, we used Fisher’s exact test. To take the multiplicity of the hypotheses into account, we used Bonferroni’s correction and a family-wise error rate (FWER) of 5% was considered significant.
The ability of the 14 genes in both tissues to discriminate between controls and CF patients was further evaluated using a partial least square discriminant analysis. The de-scriptors were the normalized mean methylation levels in one of the tissues or both. The PLS response was discrete with two levels, −1 for controls and +1 for CF patients: positive PLS estimates correspond to a classification into the control class and negative ones to a classification into the CF patients class, hence a percentage of correct classification.
We studied the correlations of the mean methylation levels of the genes in both tissues using Spearman’s non-parametric correlation coefficient. To take the multiplicity of the hypotheses into account, we used
Bonferroni’s correction and a FWER of 10% was con-sidered significant.
The expression ratios of HMOX1 in blood obtained with PCR were log transformed before their mean was taken. Because the resulting values were non-Gaussian, the expression levels between controls and stratified or unstratified CF patients were compared with Kruskal-Wallis’ and Wilcoxon’s tests. The correlation with the mean methylation level and the methylation status of the individual CpG sites was analyzed with Spearman’s coefficient.
Spearman’s coefficient was used to test the correlation of lung function (characterized by degree of severity, FEV1% predicted and FVC) with CF patient genotypes at GSTM3, (homozygous GSTM3*A, GSTM3*A/GSTM3*B and homo-zygous GSTM3*B) and at HMOX1 (rs2071746 A/A, A/T and T/T; and the (GT)n microsatellite length where we
considered both the largest or the smallest n of the two alleles). Multivariate regression models were also used to correct for factors such as demographic and clinical data (Table 1).
Additional files
Additional file 1: Figure S1. Correlation between DNA methylation data in two independent experiments (Spearman’s r = 0.97 p = 0). (PNG 113 kb) Additional file 2: Figure S2. DNA methylation distribution at 14 analyzed genes in CF and control samples. (PDF 212 kb) Additional file 3: Table S2. Distribution of HMOX1 and GSTM3 genotypes in CF patients and controls (DOCX 39 kb)
Additional file 4: Figure S3. DNA methylation analysis at EDNRA in an independent set of CF patients. DNA methylation at EDNRA was associated with pulmonary severity in blood samples collected from this independent set of severe (CFS) and mild (CFM) CF patients (Kruskal-Wallis p = 0.047). CF patients were from the FrGMC cohort; controls were from the METHYLCF cohort. The mean DNA methylation was measured by pyrosequencing. (PNG 72 kb)
Additional file 5: Table S1. Primers. (DOCX 49 kb) Abbreviations
BMI:Body mass index; CF: Cystic fibrosis; COPD: Chronic obstructive pulmonary disease; FEV1%: Percentage of forced expiratory volume in
1 second; FVC%: Percentage of forced vital capacity; FWER: Family- wise error rate; MRSA: Methicillin-resistant Staphylococcus aureus; NEC: Nasal epithelial cells; NGS: Next-generation sequencing; PI: Pancreatic insufficiency; PLS: Partial least square; SNP: Single-nucleotide polymorphism Acknowledgements
We are greatly indebt to cystic fibrosis patients and to the medical and paramedical staff of Montpellier, Nice, Hyères, and Toulouse CF Centers for their contribution to the METHYLCF cohort and to CF Centers throughout France for their contribution to the FrGMC cohort. We thank Florin Grigorescu (Montpellier, France) for the helpful discussion and anonymous reviewers for their comments. Funding
The project was funded by VLM, INSERM, and Montpellier Hospital. MM was supported by the Ciência Sem Fronteiras Program (CNPq, Brazil) and EB by CHU Montpellier. The FrGMC cohort was supported by INSERM, APHP, UPMC Univ Paris 06, ANR (R09186DS), DGS, VLM, and AICM. The funders had no role in the method design, data analysis, decision to publish, or preparation of the manuscript.
Authors’ contributions
MM, JV, MT, and AB carried out the molecular analyses. IR performed the statistical analysis and contributed to manuscript writing. RC, LM, SL, MMu, HC, LG, IV, and DC enrolled patients and controls, recorded clinical parameters, collected biological samples, and stratified patients. EB developed bioinformatic pipelines. RC and MC participated in the study design. AD conceived, designed, and coordinated the study and wrote the manuscript. All authors read and approved the final manuscript.
Competing interests
The authors declare that they have no competing interests. Consent for publication
Not applicable.
Ethics approval and consent to participate
The study and enrollment of CF patients and controls in the METHYLCF cohort were approved by the local Institutional Review Board (CPP Sud Méditerranée III, Nîmes #2013.02.01bis). The FrGMC cohort was approved by French Ethical Board, CPP #2004/15. Informed written consent was obtained from all participants.
Author details
1Laboratoire de Génétique de Maladies Rares, EA7402 Montpellier University,
Montpellier, France.2Equipe de Statistique Appliquée—ESPCI ParisTech, PSL
Research University—UMRS1158, Paris, France.3Laboratoire de Génétique
Moléculaire—CHU Montpellier, Montpellier, France.4CRCM, Renée Sabran Hospital—CHU Lyon, Hyères, France.5CRCM, Pasteur Hospital—CHU Nice,
Nice, France.6Sorbonne Universités, UPMC Univ Paris 06, Paris, France. 7INSERM U938—CRSA, Paris, France.8APHP, Trousseau Hospital, Paris, France. 9
CRCM, Larrey Hospital—CHU Toulouse, Toulouse, France.10CRCM, Arnaud de Villeneuve Hospital—CHU Montpellier, Montpellier, France.
Received: 13 October 2016 Accepted: 8 December 2016
References
1. Jirtle RL, Skinner MK. Environmental epigenomics and disease susceptibility. Nat Rev Genet. 2007;8(4):253–62.
2. Bjornsson HT, Fallin MD, Feinberg AP. An integrated epigenetic and genetic approach to common human disease. Trends Genet. 2004;20(8):350–8. 3. Cutting GR. Modifier genes in Mendelian disorders: the example of cystic
fibrosis. Ann N Y Acad Sci. 2010;1214:57–69.
4. Dequeker E, Stuhrmann M, Morris MA, Casals T, Castellani C, Claustres M, Cuppens H, des Georges M, Ferec C, Macek M, Pignatti PF, Scheffer H, Schwartz M, Witt M, Schwarz M, Girodon E. Best practice guidelines for molecular genetic diagnosis of cystic fibrosis and CFTR-related disorders—updated European recommendations. Eur J Hum Genet. 2009;17(1):51–65.
5. Wright JM, Merlo CA, Reynolds JB, Zeitlin PL, Garcia JG, Guggino WB, Boyle MP. Respiratory epithelial gene expression in patients with mild and severe cystic fibrosis lung disease. Am J Respir Cell Mol Biol. 2006;35(3):327–36. 6. Guillot L, Beucher J, Tabary O, Le Rouzic P, Clement A, Corvol H. Lung disease
modifier genes in cystic fibrosis. Int J Biochem Cell Biol. 2014;52:83–93. 7. Gallati S. Disease-modifying genes and monogenic disorders: experience in
cystic fibrosis. Appl Clin Genet. 2014;7:133–46.
8. Collaco JM, Blackman SM, McGready J, Naughton KM, Cutting GR. Quantification of the relative contribution of environmental and genetic factors to variation in cystic fibrosis lung function. J Pediatr. 2010;157(5): 802–7.e13.
9. Valinluck V, Tsai HH, Rogstad DK, Burdzy A, Bird A, Sowers LC. Oxidative damage to methyl-CpG sequences inhibits the binding of the methyl-CpG binding domain (MBD) of methyl-CpG binding protein 2 (MeCP2). Nucleic Acids Res. 2004;32(14):4100–8.
10. Henderson JP, Byun J, Williams MV, Mueller DM, McCormick ML, Heinecke JW. Production of brominating intermediates by myeloperoxidase. A transhalogenation pathway for generating mutagenic nucleobases during inflammation. J Biol Chem. 2001;276(11):7867–75.
12. Bergougnoux A, Claustres M, De Sario A. Nasal epithelial cells: a tool to study DNA methylation in airway diseases. Epigenomics. 2015;7(1):119–26. 13. Park JE, Yung R, Stefanowicz D, Shumansky K, Akhabir L, Durie PR, Corey M,
Zielenski J, Dorfman R, Daley D, Sandford AJ. Cystic fibrosis modifier genes related to Pseudomonas aeruginosa infection. Genes Immun. 2011;12(5):370–7. 14. Yamada N, Yamaya M, Okinaga S, Nakayama K, Sekizawa K, Shibahara S,
Sasaki H. Microsatellite polymorphism in the heme oxygenase-1 gene promoter is associated with susceptibility to emphysema. Am J Hum Genet. 2000;66(1):187–95. Erratum in: Am J Hum Genet 2001; 68(6):1542.
15. Pechlaner R, Willeit P, Summerer M, Santer P, Egger G, Kronenberg F, Demetz E, Weiss G, Tsimikas S, Witztum JL, Willeit K, Iglseder B, Paulweber B, Kedenko L, Haun M, Meisinger C, Gieger C, Müller-Nurasyid M, Peters A, Willeit J, Kiechl S. Heme oxygenase-1 gene promoter microsatellite polymorphism is associated with progressive atherosclerosis and incident cardiovascular disease. Arterioscler Thromb Vasc Biol. 2015;35(1):229–36. 16. Alam J, Igarashi K, Immenschuh S, Shibahara S, Tyrrell RM. Regulation of
heme oxygenase-1 gene transcription: recent advances and highlights from the International Conference (Uppsala, 2003) on Heme Oxygenase. Antioxid Redox Signal. 2004;6(5):924–33.
17. Ogilvie V, Passmore M, Hyndman L, Jones L, Stevenson B, Wilson A, Davidson H, Kitchen RR, Gray RD, Shah P, Alton EW, Davies JC, Porteous DJ, Boyd AC. Differential global gene expression in cystic fibrosis nasal and bronchial epithelium. Genomics. 2011;98(5):327–36.
18. Clarke LA, Sousa L, Barreto C, Amaral MD. Changes in transcriptome of native nasal epithelium expressing F508del-CFTR and intersecting data from comparable studies. Respir Res. 2013;14:13.
19. Darrah R, McKone E, O'Connor C, Rodgers C, Genatossio A, McNamara S, Gibson R, Stuart Elborn J, Ennis M, Gallagher CG, Kalsheker N, Aitken M, Wiese D, Dunn J, Smith P, Pace R, Londono D, Goddard KA, Knowles MR, Drumm ML. EDNRA variants associate with smooth muscle mRNA levels, cell proliferation rates, and cystic fibrosis pulmonary disease severity. Physiol Genomics. 2010;41(1):71–7.
20. Flamant C, Henrion-Caude A, Boëlle PY, Brémont F, Brouard J, Delaisi B, Duhamel JF, Marguet C, Roussey M, Miesch MC, Boulé M, Strange RC, Clement A. Glutathione-S-transferase M1, M3, P1 and T1 polymorphisms and severity of lung disease in children with cystic fibrosis.
Pharmacogenetics. 2004;14(5):295–301.
21. Feuillet-Fieux MN, Nguyen-Khoa T, Loriot MA, Kelly M, de Villartay P, Sermet I, Verrier P, Bonnefont JP, Beaune P, Lenoir G, Lacour B. Glutathione S-transferases related to P. aeruginosa lung infection in cystic fibrosis children: preliminary study. Clin Biochem. 2009;42(1-2):57–63.
22. Corvol H, Blackman SM, Boëlle PY, Gallins PJ, Pace RG, Stonebraker JR, Accurso FJ, Clement A, Collaco JM, Dang H, Dang AT, Franca A, Gong J, Guillot L, Keenan K, Li W, Lin F, Patrone MV, Raraigh KS, Sun L, Zhou YH, O'Neal WK, Sontag MK, Levy H, Durie PR, Rommens JM, Drumm ML, Wright FA, Strug LJ, Cutting GR, Knowles MR. Genome-wide association meta-analysis identifies five modifier loci of lung disease severity in cystic fibrosis. Nat Commun. 2015;6:8382. doi:10.1038/ncomms9382.
23. Potapova A, Albat C, Hasemeier B, Haeussler K, Lamprecht S, Suerbaum S, Kreipe H, Lehmann U. Systematic cross-validation of 454 sequencing and pyrosequencing for the exact quantification of DNA methylation patterns with single CpG resolution. BMC Biotechnol. 2011;11:6. doi:10.1186/1472-6750-11-6. 24. Tessema M, Yu YY, Stidley CA, Machida EO, Schuebel KE, Baylin SB,
Belinsky SA. Concomitant promoter methylation of multiple genes in lung adenocarcinomas from current, former and never smokers. Carcinogenesis. 2009;30(7):1132–8.
25. Sood A, Petersen H, Blanchette CM, Meek P, Picchi MA, Belinsky SA, Tesfaigzi Y. Methylated genes in sputum among older smokers with asthma. Chest. 2012;142(2):425–31.
26. van Eijk KR, de Jong S, Boks MP, Langeveld T, Colas F, Veldink JH, de Kovel CG, Janson E, Strengman E, Langfelder P, Kahn RS, van den Berg LH, Horvath S, Ophoff RA. Genetic analysis of DNA methylation and gene expression levels in whole blood of healthy human subjects. BMC Genomics. 2012;13:636. doi:10. 1186/1471-2164-13-636.
27. Chen R, Qiao L, Li H, Zhao Y, Zhang Y, Xu W, Wang C, Wang H, Zhao Z, Xu X, Hu H, Kan H. Fine particulate matter constituents, nitric oxide synthase DNA methylation and exhaled nitric oxide. Environ Sci Technol. 2015;49(19):11859–65.
28. Toperoff G, Aran D, Kark JD, Rosenberg M, Dubnikov T, Nissan B, Wainstein J, Friedlander Y, Levy-Lahad E, Glaser B, Hellman A. Genome-wide survey reveals predisposing diabetes type 2-related DNA methylation variations in human peripheral blood. Hum Mol Genet. 2012;21(2):371–83.
29. Lillycrop KA, Phillips ES, Torrens C, Hanson MA, Jackson AA, Burdge GC. Feeding pregnant rats a protein-restricted diet persistently alters the methylation of specific cytosines in the hepatic PPAR alpha promoter of the offspring. Br J Nutr. 2008;100(2):278–82.
30. Mootha VK, Lindgren CM, Eriksson KF, Subramanian A, Sihag S, Lehar J, Puigserver P, Carlsson E, Ridderstråle M, Laurila E, Houstis N, Daly MJ, Patterson N, Mesirov JP, Golub TR, Tamayo P, Spiegelman B, Lander ES, Hirschhorn JN, Altshuler D, Groop LC. PGC-1alpha-responsive genes involved in oxidative phosphorylation are coordinately downregulated in human diabetes. Nat Genet. 2003;34(3):267–73.
31. Subramanian A, Tamayo P, Mootha VK, Mukherjee S, Ebert BL, Gillette MA, Paulovich A, Pomeroy SL, Golub TR, Lander ES, Mesirov JP. Gene set enrichment analysis: a knowledge-based approach for interpreting genome-wide expression profiles. Proc Natl Acad Sci U S A. 2005;102(43):15545–50.
32. Kim J, Zarjou A, Traylor AM, Bolisetty S, Jaimes EA, Hull TD, George JF, Mikhail FM, Agarwal A. In vivo regulation of the heme oxygenase-1 gene in humanized transgenic mice. Kidney Int. 2012;82(3):278–91.
33. Paredi P, Kharitonov SA, Barnes PJ. Analysis of expired air for oxidation products. Am J Respir Crit Care Med. 2002;166(12 Pt 2):S31–7.
34. Lagrange-Puget M, Durieu I, Ecochard R, Abbas-Chorfa F, Drai J, Steghens JP, Pacheco Y, Vital-Durand D, Bellon G. Longitudinal study of oxidative status in 312 cystic fibrosis patients in stable state and during bronchial exacerbation. Pediatr Pulmonol. 2004;38(1):43–9.
35. Alexander M, Karmaus W, Holloway JW, Zhang H, Roberts G, Kurukulaaratchy RJ, Arshad SH, Ewart S. Effect of GSTM2-5 polymorphisms in relation to tobacco smoke exposures on lung function growth: a birth cohort study. BMC Pulm Med. 2013;13:56. doi:10.1186/1471-2466-13-56.
36. Yengi L, Inskip A, Gilford J, Alldersea J, Bailey L, Smith A, Lear JT, Heagerty AH, Bowers B, Hand P, Hayes JD, Jones PW, Strange RC, Fryer AA. Polymorphism at the glutathione S-transferase locus GSTM3: interactions with cytochrome P450 and glutathione S-transferase genotypes as risk factors for multiple cutaneous basal cell carcinoma. Cancer Res. 1996;56(9):1974–7.
37. Kim J, Kim JD. In vivo YY1 knockdown effects on genomic imprinting. Hum Mol Genet. 2008;17(3):391–401.
38. Schluchter MD, Konstan MW, Drumm ML, Yankaskas JR, Knowles MR. Classifying severity of cystic fibrosis lung disease using longitudinal pulmonary function data. Am J Respir Crit Care Med. 2006;174(7):780–6. 39. Bergougnoux A, Rivals I, Liquori A, Raynal C, Varilh J, Magalhães M, Perez MJ,
Bigi N, Des Georges M, Chiron R, Squalli-Houssaini AS, Claustres M, De Sario A. A balance between activating and repressive histone modifications regulates cystic fibrosis transmembrane conductance regulator (CFTR) expression in vivo. Epigenetics. 2014;9(7):1007–17.
40. Grunau C, Buard J, Brun ME, De Sario A. Mapping of the juxtacentromeric heterochromatin-euchromatin frontier of human chromosome 21. Genome Res. 2006;16(10):1198–207.
41. Lutsik P, Feuerbach L, Arand J, Lengauer T, Walter J, Bock C. BiQ Analyzer HT: locus-specific analysis of DNA methylation by high-throughput bisulphite sequencing. Acids Res. 2011;39(Web Server issue):W551–6.
• We accept pre-submission inquiries
• Our selector tool helps you to find the most relevant journal
• We provide round the clock customer support
• Convenient online submission
• Thorough peer review
• Inclusion in PubMed and all major indexing services
• Maximum visibility for your research Submit your manuscript at
www.biomedcentral.com/submit