HAL Id: hal-03224576
https://hal.archives-ouvertes.fr/hal-03224576
Submitted on 11 May 2021
HAL is a multi-disciplinary open access
archive for the deposit and dissemination of
sci-entific research documents, whether they are
pub-lished or not. The documents may come from
teaching and research institutions in France or
abroad, or from public or private research centers.
L’archive ouverte pluridisciplinaire HAL, est
destinée au dépôt et à la diffusion de documents
scientifiques de niveau recherche, publiés ou non,
émanant des établissements d’enseignement et de
recherche français ou étrangers, des laboratoires
publics ou privés.
Mitochondrial dynamics and reactive oxygen species
initiate thrombopoiesis from mature megakaryocytes
Sonia Poirault-Chassac, Valérie Nivet-Antoine, Amandine Houvert, Alexandre
Kauskot, Evelyne Lauret, René Lai-Kuen, Isabelle Dusanter-Fourt, Dominique
Baruch
To cite this version:
Sonia Poirault-Chassac, Valérie Nivet-Antoine, Amandine Houvert, Alexandre Kauskot, Evelyne
Lau-ret, et al.. Mitochondrial dynamics and reactive oxygen species initiate thrombopoiesis from mature
megakaryocytes. Blood Advances, The American Society of Hematology, 2021, 5 (6), pp.1706-1718.
�10.1182/bloodadvances.2020002847�. �hal-03224576�
REGULAR ARTICLE
Mitochondrial dynamics and reactive oxygen species initiate
thrombopoiesis from mature megakaryocytes
Sonia Poirault-Chassac,1,* Val ´erie Nivet-Antoine,1,2,* Amandine Houvert,3,4Alexandre Kauskot,5Evelyne Lauret,3,4Ren ´e Lai-Kuen,6
Isabelle Dusanter-Fourt,3,4,†and Dominique Baruch1,†
1
Innovative Therapies in Hemostasis, INSERM 1140, Universit ´e de Paris, Paris, France;2Clinical Biochemistry Department, Necker Hospital, Assistance Publique–H ˆopitaux de Paris (AP-HP), Paris, France;3Institut Cochin, Centre National de la Recherche Scientifique (CNRS), Unit ´e Mixte de Recherche (UMR) 8104, INSERM 1016, Universit ´e de Paris, Paris, France;4Institut Carnot OPALE, Institut de Recherche Saint-Louis, Hˆopital Saint-Louis, Paris, France;5Laboratory of Hemostasis-Inflammation-Thrombosis (HITh), INSERM, UMR S1176, Universit ´e Paris-Saclay, Le Kremlin-Bicˆetre, France; and6Cellular and Molecular Imaging Technology Platform (PTICM), Unite Mixte de Service (UMS) 3612, CNRS, INSERM US 025, Universit ´e de Paris, Paris, France
Key Points
• An increase in mito-chondrial ROS levels initiates platelet bio-genesis from human mature megakaryocytes. • Mitochondrial ROS and
fission proceed in an autoamplifying loop that is necessary for the onset of thrombopoiesis.
Blood platelets are essential for controlling hemostasis. They are released by megakaryocytes (MKs) located in the bone marrow, upon extension of cytoplasmic protrusions into the lumen of bone marrow sinusoids. Their number increases in postpulmonary capillaries, suggesting a role for oxygen gradient in thrombopoiesis (ie, platelet biogenesis). In this study, we show that initiation of thrombopoiesis from human mature MKs was enhanced under hyperoxia or during pro-oxidant treatments, whereas antioxidants dampened it. Quenching
mitochondrial reactive oxygen species (mtROS) with MitoTEMPO decreased thrombopoiesis, whereas genetically enhancing mtROS by deacetylation-null sirtuin-3 expression increased
it. Blocking cytosolic ROS production by NOX inhibitors had no impact. Classification
according to the cell roundness index delineated 3 stages of thrombopoiesis in mature MKs. Early-stage round MKs exhibited the highest index, which correlated with low mtROS levels,
a mitochondrial tubular network, and the mitochondrial recruitment of thefission activator
Drp1. Intermediate MKs at the onset of thrombopoiesis showed high mtROS levels and small, well-delineated mitochondria. Terminal MKs showed the lowest roundness index and long
proplatelet extensions. Inhibiting Drp1-dependent mitochondrialfission of mature MKs by
Mdivi-1 favored a tubular mitochondrial network and lowered both mtROS levels and intermediate MKs proportion, whereas enhancing Drp1 activity genetically had opposite
effects. Reciprocally, quenching mtROS limited mitochondrialfission in round MKs. These
data demonstrate a functional coupling between ROS and mitochondrialfission in MKs,
which is crucial for the onset of thrombopoiesis. They provide new molecular cues that control initiation of platelet biogenesis and may help elucidate some unexplained thrombocytopenia.
Introduction
Platelets are small, anucleate cells that circulate in the bloodstream to ensure hemostasis after vascular injury. They adhere to, aggregate, repair, and protect the damaged vessels. Their functions rely on cell-cell interactions and secretion of a large variety of soluble mediators embedded in different granules. Such secretions require important energy, provided by numerous hosted
mitochondria.1Platelets are formed and released into the bloodstream by megakaryocytes (MKs), which
Submitted 2 July 2020; accepted 20 January 2021; published online 15 March 2021. DOI 10.1182/bloodadvances.2020002847.
*S.P.-C. and V.N.-A. contributed equally to this study. †I.D.-F. and D.B. contributed equally as joint senior authors.
Material, datasets, and protocols will be readily available to other investigators upon request to one of the corresponding authors, Dominique Baruch (dominique.baruch@ parisdescartes.fr) or Isabelle Dusanter-Fourt ([email protected]). The full-text version of this article contains a data supplement.
© 2021 by The American Society of Hematology
differentiate from hematopoietic stem and progenitor cells in the
bone marrow in a complex process known as megakaryopoiesis.2
Differentiating MKs undergo multiple rounds of endomitosis to generate enlarged polyploid cells. They develop an extended intracellular membrane network known as demarcation membranes, that delineate
future platelet fields.3At the end of their differentiation, mature MKs are
intimately associated with the external side of sinusoid vessels. These MKs deform and their demarcation membranes protrude toward the luminal side of the sinusoids (hereinafter termed the intravascular space), to form proplatelets and platelets in the bloodstream, as
observed in vivo, in a process known as thrombopoiesis.4 This
process is unidirectional, as no platelets are formed in the extravascular space of the bone marrow in physiological conditions. Massive microtubule and actin network remodeling are needed for formation of proplatelets and release and proper localization of organelles
(granules; mitochondria) along the extensions.5,6
Many studies have demonstrated the roles of bone marrow vasculature in spatial thrombopoiesis and of the small-GTPase Cdc42/RhoA regulatory circuit in directing polarized transendothelial platelet
biogenesis.7,8Other groups, including ours have emphasized the
crucial role of blood flow on proplatelet fragmentation and platelet
formation.9-12Still, the molecular mechanisms that trigger the onset
of thrombopoiesis itself, inducing MKs to begin protruding toward the intravascular space, have remained elusive. Numerous clues point toward a role for oxygen signaling in the process. First of all, an oxygen gradient is present between the bone marrow tissue microenvironment (extravascular bone marrow), which harbors
low oxygen levels, and the intravascular space.13Quantification of
platelets in the lung vessels has provided further evidence that increased platelet production occurs in postpulmonary vessels,
which are enriched in oxygen compared with pulmonary arteries.14,15
Moreover, various chemical mediators have been shown to en-hance thrombopoiesis via reactive oxygen species (ROS)–dependent
pathways.16-18More broadly, ROS play major roles in cell migration
during development, cell fate, and differentiation, including regula-tion of the neuronal cytoskeletal dynamics involved in cell elongaregula-tion and distribution along the axons of crucial cytoplasmic organelles,
such as mitochondria.19Similarly, ROS influence the architecture of
cytoskeleton and actomyosin dynamics in wound healing.20
Mitochon-dria represent a major source of ROS in many cells. Their morphology remodeling has a strong impact on ROS production and also on
differentiation of a variety of cell types.21It plays a central role in
neurogenesis and neuronal maturation,22a key step of which is
extension of long, thin projections, a feature that is shared with MKs. Altogether, these observations prompted us to investigate the possible role of ROS and mitochondrial dynamics in the initiation of thrombopoiesis from human mature MKs.
Methods
Detailed descriptions of methods can be found in the supplemental Data. The study was approved by the ethics committee and institutional review board, Assistance Publique–H ˆopitaux de Paris, Cord Blood Bank, Saint Louis Hospital, Paris, France, with the women’s written informed consent, in accordance with the Declaration of Helsinki.
Megakaryocyte culture and proplatelet formation assays
Human CD341hematopoietic stem progenitor cells (HSPCs) were
isolated from umbilical cord blood and cultured as described to
produce terminally differentiated CD41a/CD42b/CD61-expressing
MKs.23These mature MKs, at day 12 to 13 of culture, were
pelleted and loaded onto a bovine serum albumin (BSA) gradient to separate mature MKs from platelets and cell debris before being
processed.24They were then cultured in Ibidi wells (Martinsried;
153 103cells per well) in complete medium for 5 or 24 hours at
37°C, in the presence of the various study drugs and treatments, before being observed by transmission optical microscopy and an image-recording system (Primo Vert Lw1235C-GT1; Zeiss). Quantification of MK subclasses was performed according to cell morphology, with NIH ImageJ software. Single-cell perimeter, area, and maximum Feret diameter were measured; the roundness
index was calculated with the equation (4p 3 area)/perimeter2
,
as described.25
Measurement of ROS levels
Mature MKs were incubated with 50 mM dihydroethidium
(DHE) or 2979-dichlorodihydrofluoresceine diacetate (H2DCFDA)
for 30 minutes. Mitochondrial superoxide anion levels were
assessed by incubating mature MKs with 10mM MitoSOX Red
probe (Molecular Probes). Cells were coincubated with
APC-coupled anti-CD42b antibody. DHE, H2DCFDA, and MitoSOX
fluorescence intensities in CD42b1 cells were determined by
flow cytometry.
Mitochondrial dynamics
MKs were stained with 250 nM MitoTracker to label mitochondria and fixed and labeled with anti-a-tubulin antibody to determine cell Feret and area, in addition to morphology-based MK subtype classification. Using a deconvolution plugin on MitoTracker images, we delineated mitochondrial masks within the single cells. Alternatively,
MitoTracker-stained MKs were labeled with anti-P-Ser616Drp1 antibody
and examined with a confocal microscope and the JACoP plugin of NIH ImageJ software to determine Pearson’s correlation coefficient.
Transmission electron microscopy
MKs at day 11 of culture were plated on glass coverslips and allowed to differentiate for 1 more day before they were processed for transmission electron microscopy.
Expression of transgenes
cDNA coding for wild-type (WT)-SIRT-3, deacetylase-negative (DN) H248Y-SIRT-3, WT Drp1, S616A(SA)-Drp1, or S616D(SD)-Drp1
mutants was subcloned in the pInducer vector (Addgene),26
and lentiviral particles were produced as described.27CD341HSPCs
were transduced, or not, at day 1 after purification; GFP1cells were
sorted at day 7. Transgene expression was induced by adding
0.3 mg/mL doxycycline for 7 hours on mature MKs. Where
indicated, MitoTEMPO (10mM) was added with the doxycycline.
Statistical analysis
GraphPad7 software was used for all analyses. All experiments were performed at least 3 times independently. Data are reported as means 6 SEM. P # .05 indicated statistical significant, and the significance was assessed by 1-way analysis of variance. Then, if the results were significant, the data were analyzed with the Mann-Whitney U test or
ratio paired Student t test. Significance was set at P# .05.
Results
Intracellular ROS levels impact thrombopoiesis
We first tested whether changing intracellular ROS levels impacts proplatelet formation by mature MKs (ie, thrombopoiesis) in vitro.
Human CD341HSPCs isolated from cord blood were cultured
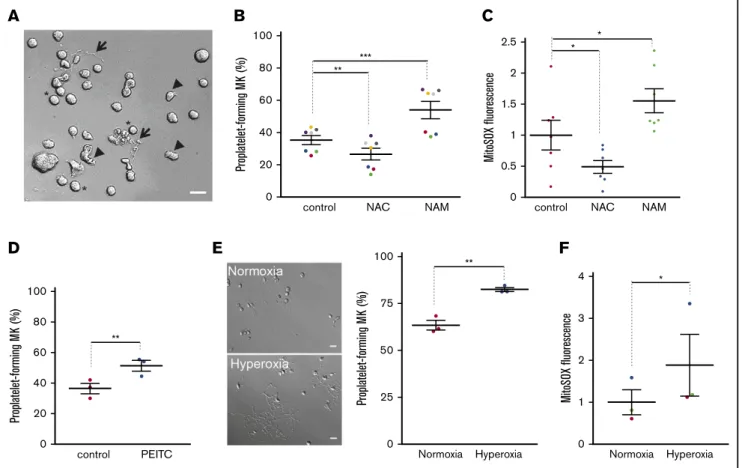
for 12 days in serum-free medium supplemented with thrombo-poietin, to obtain mature MKs. Then, the ROS contribution to thrombopoiesis was analyzed during a brief treatment (5 hours) in the absence or presence of pharmacological agents (Figure 1A-D). The antioxidant N-acetyl cysteine (NAC) significantly lowered the proportion of proplatelet-forming MKs compared
with controls (NAC 26.4%6 3.6% vs control 35.2% 6 2.8%;
n5 7; P # .01). Conversely, mature MKs were incubated with
the pro-oxidant NAM, at a concentration (5 mM) that has been
reported to impair MK differentiation.28NAM treatment significantly
increased the proportion of proplatelet-forming MKs compared with
the control (NAM 53.9%6 5.3% vs control 35.2% 6 2.8%; n 5 7;
P# .001; Figure 1B). Both NAC and NAM activities were confirmed
by probing total and mitochondrial superoxide anion levels using
dihydroxyethidium (DHE; supplemental Figure 1A) or MitoSOX (Figure 1C) labeling, respectively. Actually, mitochondrial anion superoxide levels relative to untreated cells (set as 1) were
significantly decreased by NAC (0.496 0.1; n 5 7; P # .05) and
increased by NAM (1.566 0.19; n 5 7; P # .05; Figure 1C). No
overall cell toxicity was observed during this 5-hour treatment, as assessed by caspase-3 cleavage; Fluo-3 fluorescence, which
detects cytosolic Ca21 levels; or the JC-1 probe, which monitors
mitochondrial membrane potential in whole cells (supplemental Figure 1B-D). To strengthen these data, mature MKs were incubated with a more restrictive pro-oxidant drug, phenylethyl isothiocyanate (PEITC), which inhibits the detoxifying glutathione-S transferase enzymes. Remarkably, PEITC enhanced the proportion of
proplatelet-forming MKs from 36.4%6 3.5% (control) to 51.3% 6 3.5% (n 5 3;
P# .01), while increasing total cellular ROS levels, as assessed with
H2DCFDA, with fluorescence that fluctuated according to total ROS
levels (Figure 1D; supplemental Figure 1E). Of note, the increase in thrombopoiesis by pro-oxidants was of the same magnitude as the one observed when MKs were similarly incubated with
a ROCK inhibitor (Y27632; 67.5%6 1.1% vs control 44.6% 6
0.4%; n5 4; P # .001) or a myosin II ATPase inhibitor (blebbistatin;
* * 2.5 2 MitoS O X fluorescence 1.5 1 0.5 0
C
100 80 Proplatelet-forming M K (%) 60 40 20 0control NAC NAM control NAC NAM
**
B
***A
* 4 3 MitoS O X fluorescence 2 1 0 Normoxia HyperoxiaF
100 80 ** Proplatelet-forming M K (%) 60 40 20 0 control PEITCD
** 100 Proplatelet-forming M K (%) 75 50 25 0 Normoxia HyperoxiaE
Figure 1.ROS levels regulate proplatelet-forming MKs.Mature MKs were obtained from cord blood CD341progenitors after differentiation for 12 days. They were treated for 5 hours (A-D) under normoxia (20% O2) with the indicated drugs (NAC, 1 mg/mL; NAM, 5mM; PEITC, 5 mM) or the appropriate solvent (PBS; A-C; dimethyl sulfoxide; D) as the control. Alternatively, they were incubated for 24 hours (E-F) in a 20% (normoxia) or 95% (hyperoxia) O2incubator chamber. (A,E) Representative images of the observed mature MKs upon a 5-hour (A) or 24-hour (E) incubation are presented. (A: *nondeformed MKs; arrowheads, slightly deformed MKs; arrows, proplatelet-forming MKs). Bar represents 10mm. (B,D,E) Percentage proplatelet-forming MKs relative to total cells observed by phase-contrast microscopy; dot plots show individual data from 3 to 7 independent experiments; means6 SEM (ratio paired Student t test; **P # .01; ***P # .001). (C,F) Cells were incubated with MitoSOX fluorescent dye before being processed by flow cytometry. Mean fluorescence intensity is expressed as fold change over control cells. Data are means6 SEM; ratio paired Student t test; *P# .05.
E
MitoTEMPO Pr oplatelet-forming M K (%) * # #EV WTSIRT3 DNSIRT3 DNSIRT3 No MitoTEMPO 80 0 20 40 60
F
* MitoS O X fluorescence (fold c hange) EV WTSIRT3 DNSIRT3 0 1 2 3 4 5 NSA
Proplatelet-forming M K (%) 0 20 40 60 80control Apocynin VAS2870
B
* * D H E fluorescence (fold change over control)
control Apocynin VAS2870 0 0.5 1 1.5
C
Proplatelet-forming M K (%) control MitoTEMPO ** 0 10 20 30 40D
Control MitoTEMPO Phase contrast MitoS O X*
*
*
*
*
*
*
*
*
*
*
*
Figure 2.Mitochondrial but not cytosolic ROS contribute to thrombopoiesis.MKs were incubated for 5 hours with the indicated drugs (apocynin 1 mM; VAS2870 15 mM; MitoTEMPO 10 mM) or dimethyl sulfoxide solvent (0.1%) as the control. (A,C) The percentage of proplatelet-forming MKs relative to total cells observed by phase-contrast microscopy. Dots show individual data points from 3 independent experiments. Means6 SEM; n 5 3; ratio paired Student t test. **P # .01. (B) Cells were incubated with DHE fluorescent dye before being processed by flow cytometry; relative mean fluorescence intensity expressed as fold change over control cells. Means6 SEM; n 5 4; ratio-paired Student t test. *P#.05. (D) Representative micrographs of MitoTEMPO-treated or untreated cells obtained with phase-contrast or MitoSOX fluorescence microscopy, as indicated (stars, round MKs; arrowheads, intermediate MKs; arrows, proplatelet-forming MKs). Bar represents 10mm. (E-F) Transduced CD341-derived mature MKs with the indicated lentiviral particles were treated with doxycycline (0.3mg/mL) for 7 hours to induce transgene expression. Where indicated, MitoTEMPO (10 mM) was added. MKs were then directly analyzed without the BSA gradient. (E) GFP1proplatelet-forming MKs were counted relative to total GFP1cells (means6 SEM; ratio paired Student t test;
64.5%6 0.8% vs control 44.6% 6 0.4%; n 5 4; P # .001), known
to increase proplatelet formation from mature MKs.29,30These data
suggest that intracellular ROS levels influence thrombopoiesis. In an attempt to more faithfully recapitulate the in vivo microenvi-ronment that sustains thrombopoiesis, we made use of von Willebrand factor (VWF)-coated microfluidic devices, in which mature MKs were exposed to VWF and high shear rates to induce proplatelet formation. We addressed the impact of pro-oxidants on thrombopoiesis under those conditions (supplemental Figure 2A-D). Compared with untreated cells, the percentage of proplatelet-forming MKs was two-fold higher in NAM-pretreated cells during a 10- to 40-minute time course, as observed by phase-contrast microscopy
(P, .05). Immunofluorescent labeling confirmed proper cytoskeletal
reorganization and higher proplatelet-forming capacity of mature MKs in the presence of NAM as shown by both tubulin and actin labeling (supplemental Figure 2D).
As another way to increase ROS levels, and by analogy with the positive oxygen gradient that bone marrow MKs face when they get closer to blood flow, mature MKs were incubated for 24 hours in normoxic or hyperoxic conditions, and their ability to deform and make cytoplasmic extensions was analyzed by phase-contrast
microscopy. Increasing O2levels from 20% to 95% strongly favored
thrombopoiesis, as shown by 63.4%6 1.5% and 82.5% 6 1.1%
proplatelet-forming MKs, respectively (Figure 1E). As expected,
changing extracellular O2levels triggered changes in intracellular
ROS levels. It also changed mtROS, as assessed by the MitoSOX
probe, which senses mitochondrial superoxide anion levels (P# .05;
Figure 1F). Altogether, these data indicated that intracellular ROS levels, whatever the origin of their changes (extracellular oxygen tension, activity of ROS detoxifying pathways), affect thrombopoi-esis in vitro.
mtROS contribute to thrombopoiesis
Intracellular ROS are produced at 2 major sites within cells: the plasma membrane inner face through NADPH oxydase enzymes (NOX) and within mitochondria, as byproducts of respiration. We thus questioned whether these 2 sources of ROS similarly contribute to thrombopoiesis. Incubating mature MKs with the NOX inhibitors apocynin or VAS2870 had no impact on proplatelet formation in vitro, whatever the concentration used (Figure 2A; supplemental Figure 3A), whereas it decreased total superoxide anion levels (Figure 2B; supplemental Figure 3B) in the absence of overall cell toxicity, as assessed by JC-1 (supplemental Figure 3C). To assess the contribution of mtROS to thrombopoiesis, we quenched mtROS by incubating MKs with mitoTEMPO that specifically chelates mitochondrial superoxide
anions.31 This treatment lowered the proportion of
proplatelet-forming MKs by nearly two-fold relative to control cells (Figure 2C;
MitoTEMPO 15.2%6 0.8% vs control 27% 6 1.1%; n 5 3; P #
.01), while entirely suppressing mtROS-dependent MitoSOX fluo-rescence (Figure 2D). No change in mitochondrial permeability was observed precluding general toxic effects (supplemental Figure 3D). Taken as a whole, our data demonstrated that mtROS, but not cytosolic ROS levels regulate thrombopoiesis.
We next wondered whether ROS upregulation was sufficient to enhance thrombopoiesis. Sirtuin-3 (SIRT-3) is the primary mito-chondrial protein deacetylase that regulates mitomito-chondrial function
in response to many kinds of stress, especially oxidative stress.32
It regulates manganese superoxide dismutase (MnSOD) activity,
which transforms superoxide anions into H2O2as a first step of
ROS detoxification. Suppressing SIRT-3 activity genetically by overexpression of a DN mutant of SIRT-3 increases mitochondrial
superoxide levels.26We generated inducible lentiviral vectors that
promote transient expression of Sirt3 transgenes after a brief treatment (7 hours) in the presence of doxycycline, as validated in human myeloid cells and primary MK progenitors (supplemental Figure 3E). These vectors also constitutively express a GFP marker. Transient DN SIRT-3 expression in mature MKs upon lentiviral transduction and doxycycline treatment strongly enhanced
proplatelet-forming MKs (71.9% 6 2.3%) compared with control empty
vector–expressing cells (47.6% 6 0.8%; n 5 3), whereas WT SIRT-3 tended to inhibit it, although not significantly (Figure 2E). MitoSOX fluorescence analysis further indicated a 4.4-fold increase in mito-chondrial superoxide anion levels upon induction of DN SIRT-3, in comparison with control cells, indicating pro-oxidant activity of deacetylase-negative (DN) SIRT-3 in transduced MKs (Figure 2F). No significant changes in mtROS were observed with overexpression of WT SIRT-3, which supports the lack of significant impact of WT SIRT-3 on proplatelet formation. Scavenging mtROS by MitoTEMPO treatment of DN SIRT-3-expressing cells completely suppressed DN SIRT-3–dependent increase in the proplatelet-forming MKs (Figure 2E).
Overall, our results provide evidence of an important contribution of mtROS to thrombopoiesis.
Onset of thrombopoiesis is associated with enhanced mtROS levels
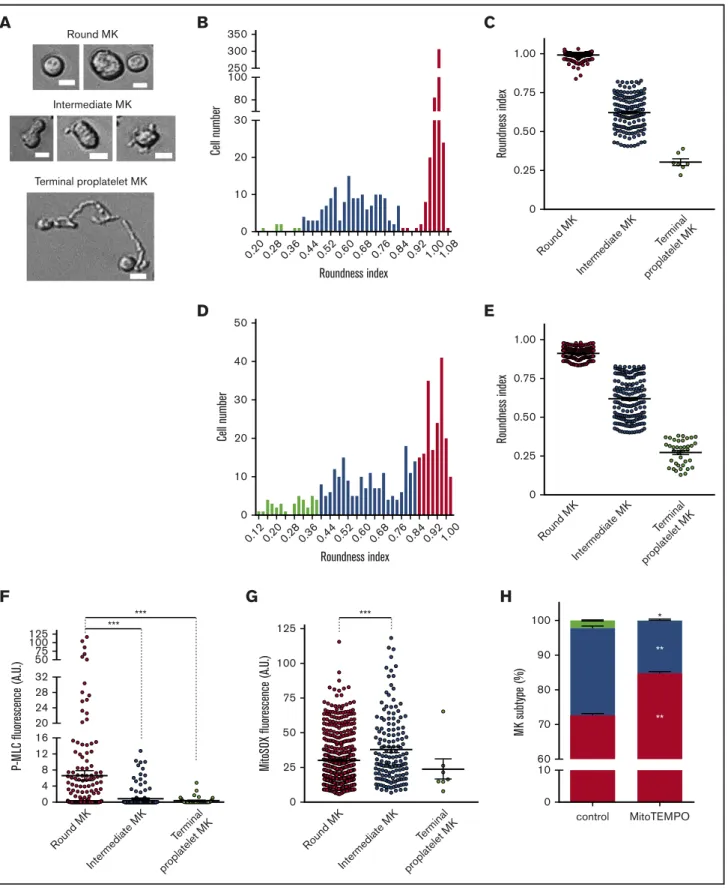
To assess the role of mtROS on the onset of thrombopoiesis, we used a computer-assisted morphometry method for staging individual mature MK cells in our proplatelet-forming MK assay (Figure 3A-E; supplemental Figure 4A). The distribution of cells according to the roundness index enabled classification into 3 subclasses. As shown at 5 (Figure 3B-C) and 24 (Figure 3D-E) hours of incubation, a threshold value of 0.83 distinguished round MKs ($0.83) from intermediate cells that exhibited some membrane deformations and appearance of small pseudopods (Figure 3A). Similarly, a roundness index threshold of 0.4 separated intermediate MKs from terminal proplatelet-forming MKs that exhibited long cell extensions, a difference that was more obvious at 24 hours when the proportion of terminal proplatelet-forming MKs strongly increased (Figure 3D-E). To associate this interme-diate population with initiation of thrombopoiesis, we analyzed the status of myosin regulatory light chain phosphorylation, which plays a key role in the onset of proplatelet formation. Indeed, inhibition of
phospho-Ser19of the myosin regulatory light chain MYL9 (P-MLC)
is necessary for thrombopoiesis to proceed from mature MKs.29,30
Accordingly, P-MLC was significantly lower in all deformed MKs that exhibited a decreased roundness index, compared with
Figure 2.(continued)EV vs DN; n5 6; MitoTEMPO vs no MitoTEMPO; n 5 3). *P , .05;##
P# .01. (F) Cells were incubated with MitoSOX fluorescent dye. Mean fluorescence intensity was measured by flow cytometry in GFP1/CD421cells. Data are expressed as fold change of induced relative to noninduced condition; ratio paired Student t test. *P, .05; n 5 3. EV, empty vector.
Intermediate MK Terminal proplatelet MK
A
Round MKB
Cell number Roundness index 0.20 0.28 0.3 6 0.4 4 0.52 0.6 8 0.6 0 0.760.8 4 0.92 1.001.0 8 0 10 20 30 80 100 250 350 300C
Roundness index 0 1.00 0.25 0.75 0.50 Round M K Intermediate M K Terminal proplatelet M KD
Roundness index 0.12 0.20 0.28 0.3 6 0.4 4 0.6 0 0.52 0.6 8 0.7 6 0.8 4 0.92 Cell number 0 10 20 30 40 50 1.00E
Roundness index 0 1.00 0.25 0.75 0.50 Round M K Intermediate M K Terminal proplatelet M KG
Round M K Intermediate M K Terminal proplatelet M K *** MitoS O X fluorescence (A.U.) 0 50 100 25 75 125F
Round M K Intermediate M K Terminal proplatelet M K P-M LC fluorescence (A.U.) *** *** 0 4 8 12 16 20 24 28 32 50 75 100 125 control MitoTEMPO M K subt ype (%) 0 60 80 100 10 70 90H
* ** **Figure 3.Intermediate MKs exhibit high levels of mitochondrial superoxide anion. Mature MKs were collected after the BSA gradient and incubated for 5 (A-C; F-H) or 24 (D-E) hours before morphometric analysis by phase-contrast microscopy and Image J software and/or fluorescence analysis of individual cells after P-MLCSer19or MitoSOX labeling. (A-E) Phase-contrast microscopy analysis differentiated 3 states of thrombopoiesis based on morphological parameters. (A) Representative images illustrate round, intermediate, and terminal MKs. Bars represent 10mm. (B-E) The roundness index of the individual MKs was scored according to the equation (4p 3 area)/perimeter2 at 5 (B-C) and 24 (D-E) hours. The number of cells was recorded according to the roundness index (B,D). The binning analysis (C,E) categorized the MKs into round (red), intermediate (blue), and terminal proplatelet (green) MKs, according to thresholds set at 0.40 and 0.83; dot plots show individual data and median lines (n5 3, Mann-Whitney
nondeformed round MKs (Figure 3F; supplemental Figure 4B). Interestingly, an increase in the intermediate MK subpopulation was observed after 5 hours of treatment in the presence of either NAM pro-oxidant or cytoskeleton remodeling agents (Y27632, ROCK inhibitor or blebbistatin, myosin II ATPase inhibitor) as compared with the control (supplemental Figure 4C). These data indicate that the roundness index discriminates a discrete population of MKs, so-called intermediate MKs, that initiate thrombopoiesis and also exhibit characteristic signaling changes that occur when mature MKs start protruding, providing a new, valuable criterion to delineate different steps in the onset of thrombopoiesis.
Our 3-stage thrombopoiesis classification was used to evaluate endogenous mtROS levels in each MK subtype. At 5 hours, mtROS levels, as evaluated by MitoSOX fluorescence intensity, were much
higher in intermediate MKs (42.66 1.6 arbitrary units [AU]) than in
round MKs (25.86 0.8 AU; P # .001) or terminal MKs (25.2 6 6.9
AU; Figure 3G). Similar results were obtained after 24 hours (supplemental Figure 4D). The increase in mtROS was observed in the absence of any change in mitochondrial permeability, as assessed by the JC-1 fluorescence ratio (supplemental Figure 4E), indicating no difference in mitochondrial integrity between the 3 MK subtypes. To evaluate the contribution of mtROS changes to initiation of thrombopoiesis, we determined the proportion of the 3 MK subtypes after treatment with MitoTEMPO at 5 (Figure 3H) and 24 (supplemental Figure 4F) hours. Scavenging mtROS by MitoTEMPO strongly reduced the proportion of intermediate MKs
(at 5 hours, 15.1%6 0.8% vs 25.1% 6 0.1%, P # .01; at 24 hours,
15.8%6 0.6% vs 27.2% 6 1.2%, P # .05, n 5 3) and terminal
MKs (at 5 hours, 0.07%6 0.07% vs 2.2% 6 0.3%, P # .05; at
24 hours, 2.4%6 0.2% vs 8.3% 6 0.4%; P , .001; n 5 3), with
a correlated increase in round MKs, compared with the controls. Thus, a dramatic increase in mtROS is a specific characteristic of intermediate MKs that exhibit the first morphological signs of thrombopoiesis onset.
Changes in mitochondrial dynamics correlate with onset of thrombopoiesis
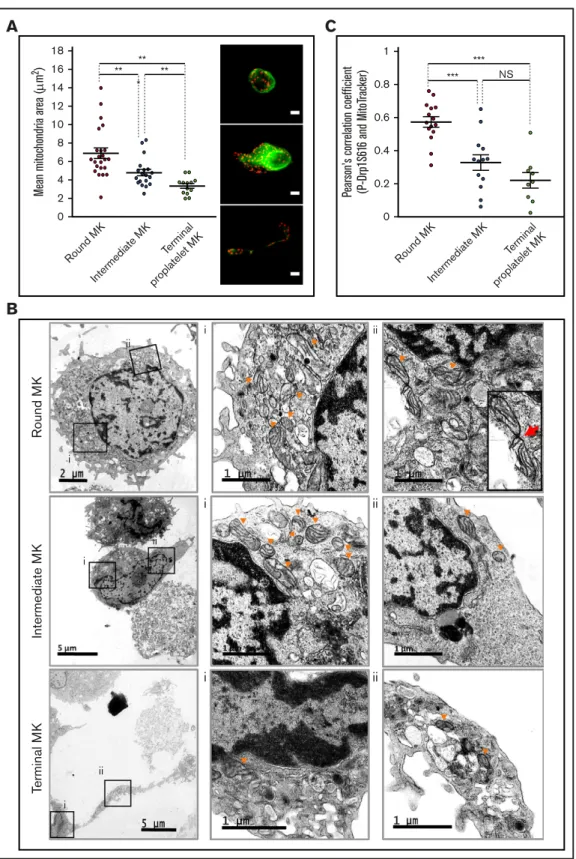
Fluorescence microscopy and TEM imaging were used to analyze mitochondrial dynamics during the 3 stages of thrombopoiesis. The fluorescent probe MitoTracker revealed quantitative and qualitative changes in the mitochondrial network. Indeed, a decrease in
mitochondrial area was observed in intermediate (4.86 0.4 mm2)
and terminal (3.36 0.3 mm2) MKs, compared with round (6.96 0.6
mm2
; Figure 4A) MKs. Transmission electron microscopy imaging (Figure 4B) similarly showed that mitochondria in the round MKs were much larger (top row) than those in the intermediate (middle row) and terminal (bottom row) MKs. This decrease in size was associated with an increased number of mitochondria per MK during thrombopoiesis, which suggests active mitochondrial fission (supplemental Figure 5A).
Mitochondrial fission requires prerecruitment of cytosolic GTPase Dynamin-related protein 1 (Drp1) to the external mitochondrial
membrane by receptors such as mitochondrial fission factor and
mitochondrial fission-1 protein.33 Drp1 fission activity is further
enhanced by posttranslational modifications, especially
phos-phorylation on residue Ser616.33,34 Mitochondrial recruitment
of phospho-Ser616-Drp1 was analyzed by using MitoTracker
costaining and evaluation by Pearson’s correlation coefficient.
As shown in Figure 4C, colocalization of phosphoSer616-Drp1
with mitochondria was much stronger in round MKs, than in all
deformed MKs (ie, intermediate and terminal MKs; P# .001),
suggesting more active mitochondrial fission ahead of thrombo-poiesis onset. Also, in 3-dimensional reconstructions, a smaller tubular mitochondrial network was observed in all deformed MKs, as compared with the round MKs (supplemental Figure 5B). As a negative control, Pearson’s correlation coefficients between
MitoTracker and VWF that localize in a-granules instead of
mitochondria, were extremely low in every MK subtype (supple-mental Figure 5C), thus assessing the selectivity of changes in pDrp1/MitoTracker colocalization. Overall, our data indicate that thrombopoiesis correlates with major changes in mitochondrial dynamics in mature MKs, with enhanced mitochondrial fission at its onset.
Enhanced mitochondrial fission contributes to initiation of thrombopoiesis
Having shown that mitochondrial dynamics exhibit important changes at the onset of thrombopoiesis, we next used Mdivi-1,
a well-known chemical inhibitor of Drp1 self-assembly,35 to
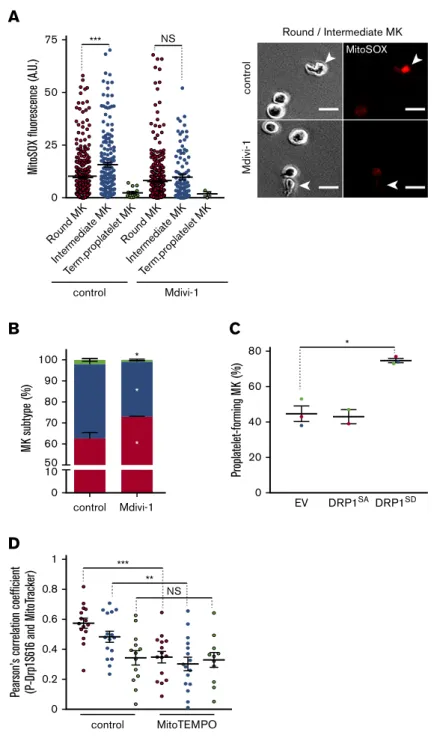
block mitochondrial fission and examined the impact on mtROS and thrombopoiesis. Mdivi-1 completely suppressed the eleva-tion of mtROS levels observed between round and intermediate MKs in control cells (Figure 5A). At the same time, in accordance with the decreased ROS levels, Mdivi-1 reduced the proportion of both intermediate and terminal MKs, with a corresponding increase in round MKs (Figure 5B). Proper antifission activity of Mdivi-1 was confirmed by MitoTracker labeling that showed interconnected mitochondrial network in the round MKs (supple-mental Figure 6A-B); no detectable toxicity of Mdivi-1 treatment was observed, as assessed by the JC-1 probe (data not shown). These data suggest that mitochondrial fission increases mtROS, which favors the onset of thrombopoiesis. We thus wondered whether additional antioxidant treatment would further inhibit thrombopoiesis. However, cotreatment of MKs with Mdivi-1 and NAC showed no additive effect on thrombopoiesis, compared with individual Mdivi-1 or NAC treatment (Figure 5B). These data suggest that the increase in mtROS at the onset of thrombopoiesis is caused by enhanced mitochondrial fission. To confirm these data and because of the controversy about
Mdivi-1 specificity,36inducible vectors encoding phosphomimetic
Ser616Asp-Drp1 (DRP1SD) or phospho-null Ser616Ala-Drp1
(DRP1SA) mutants were introduced into CD341 progenitors,
and transgene expression was induced in mature MKs upon doxycycline treatment. Expression of the phosphomimetic Drp1 mutant enhanced the production of proplatelet-forming MKs, as
Figure 3.(continued)U test). (F) Phospho-Ser19-MYL9 (P-MLC) fluorescence was measured in individual cells from the 3 populations of MKs by fluorescence microscopy and expressed as AUs normalized to the whole cell surface. Dot plots show individual data and median lines (n5 3, Mann-Whitney U test). ***P , .001. (G) MitoSOX fluorescence was measured in individual cells from the 3 populations of MKs and expressed as AUs normalized to the cell surface (n5 3; Mann-Whitney U test). *P , .05; ***P, .001. (H) Distribution of the 3 indicated populations of MKs after MitoTEMPO (10 mM) treatment; data are expressed relative to total cells (means 6 SEM; n 5 3; treated vs control cells ratio paired Student t test). *P, .05; **P , .01.
B
i ii i ii ii i ii i i i ii ii Round M K Intermediate M K Te rminal M KC
Pearson’s correlation coefficient
(P-Drp1S61 6 and MitoT rac ker) *** *** 0 0.2 0.4 0.6 0.8 1 NS Round M K Intermediate M K Terminal proplatelet M K
A
Mean mitoc hondria area ( m 2) ** ** ** 0 2 4 6 8 10 12 14 16 18 Round M K Intermediate M K Terminal proplatelet M K *Figure 4.Changes in mitochondrial dynamics during proplatelet formation.(A,C) Mature MKs were incubated for 5 hours before being processed for fluorescence microscopy after MitoTracker labeling. (A) Mean mitochondrial areas of individual round (red dot), intermediate (blue dot), and terminal (green dot) MKs. Dot plots show individual data and median lines (n5 3, Mann-Whitney U test); representative images of MitoTracker (red) and a-tubulin (green) labeling are shown on the right. Bars represent 10mm. **P , .01. (B) Mature MKs were collected and processed for transmission electron microscopy; images illustrate round (top), intermediate (middle), and terminal (bottom) MKs. Boxes (Bi-ii) indicate areas enlarged for visualization of the mitochondria, at original magnification33000 for round/intermediate MKs and 34000 for terminal MKs. Arrowheads indicate representative mitochondria; red arrow indicates a mitochondrial fission. (C) PhosphoSer616-Drp1 antibody (green) was used in colabeling with MitoTracker (red) and processed for fluorescence confocal microscopy. Pearson’s correlation coefficients were measured for the 2 fluorescent signals (MitoTracker, P-Ser616 Drp1) by using the JACoP plugin of ImageJ for the indicated MKs (dots). Dot plots show individual data and median lines (n5 3; ***P , .001; Mann-Whitney U test).
compared with control cells (Figure 5C), while favoring mito-chondrial fission (supplemental Figure 6B). Altogether, these data indicate that Drp1 activity controls both mitochondrial dynamics and mtROS production, which contributes to the onset of thrombopoiesis.
As shown earlier, enhanced mtROS levels characterized the onset of thrombopoiesis in intermediate MKs (Figure 3), and mtROS over-or underexpression increased over-or reduced this thrombopoiesis step, respectively (Figure 2). Hence, we tested whether mtROS could inversely regulate mitochondrial dynamics to initiate thrombopoi-esis. Indeed, quenching mitochondrial superoxide anions with
MitoTEMPO inhibited recruitment of pSer616-Drp1 to mitochondria
in both round MKs and intermediate MKs (Figure 5D). These data suggest that mtROS promotes mitochondrial fission, which regulates onset of thrombopoiesis.
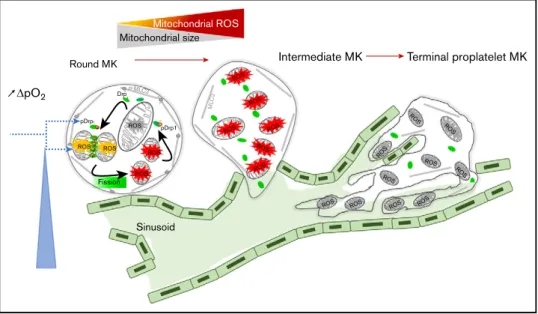
Collectively, our data indicate that changes in mitochondrial dynamics and mtROS levels in mature MKs together promote thrombopoiesis in an autoamplification loop, where mtROS pro-mote mitochondrial fission, thereby further increasing mtROS (Figure 6). They support a model in which the oxygen gradient between mature MKs located at the extravascular edge of the sinusoids and the blood flow triggers both mitochondrial fission and increased mtROS levels in mature MKs that initiate and self-sustain the initiation of thrombopoiesis.
A
* * * M K subt ype (%) Mdivi-1 control 0 60 80 100 10 70 90 50B
C
80 Proplatelet-forming M K (%) EV DRP1SA DRP1SD 0 20 40 60 * Mdivi-1 control Round M K Intermediate M K Term.proplatelet M K Round M K Intermediate M K Term.proplatelet M K MitoS O X fluorescence (A.U.) *** NS 0 25 50 75D
Pearson’s correlation coefficient
(P-Drp1S61 6 and MitoT rac ker) *** ** control MitoTEMPO 0 0.2 0.4 0.6 0.8 1 NS control Mdivi-1 Round / Intermediate MK MitoSOX
Figure 5.Coupling of mitochondrial dynamics and mtROS levels during formation of proplatelets.Mature MKs were treated for 5 hours with the indicated drug (Mdivi-1, 10mM; NAC, 1 mg/mL; MitoTEMPO, 10mM) or dimethyl sulfoxide solvent as the control, and processed for fluorescence microscopy (A), phase-contrast microscopy (B-C), and fluorescence confocal microscopy (D). (A) Mean MitoSOX fluorescence intensity (left) of individual round (red dot), intermediate (blue dot), and terminal (green dot) MKs upon treatment with Mdivi-1. Dot plots show individual data and median lines (n5 3, control vs Mdivi-1; Mann-Whitney U test; ***P, .001). Representative images (right), as indicated (arrowheads: intermediate MKs). Bar represents 10mm. (B) Distribution of the indicated MK subtypes, expressed relative to total cells observed. (Means6 SEM; n 5 3; ratio paired Student t test for drug-treated vs solvent-drug-treated MKs). *P, .05. (C) Transduced CD341 -de-rived, mature MKs with the indicated lentiviral particles were treated with doxycycline for 7 hours to induce transgene expression and with Mito-tracker during the last 30 minutes. MKs were then directly analyzed with-out the BSA gradient. GFP1, proplatelet-forming MKs were counted and expressed relative to total GFP1cells (means6 SEM; n 5 3; ratio paired Student t test DRP1SDvs EV); *P, .05. (D) DMSO solvent-(control) and MitoTEMPO-treated MKs were analyzed by fluorescence confocal microscopy for colocalization of MitoTracker and pSer616-Drp1. Pearson’s correlation coefficients are shown for individual MKs from each subtype. Dot plots show individual data and median lines (n5 3; Mann-Whitney U test). **P, .05; ***P , .001. NS, not significant.
Discussion
Our data provide the first evidence coupling initiation of proplatelet formation in human MKs to ROS and mitochondrial dynamics. We first demonstrated that the onset of thrombopoiesis from mature MKs is controlled by a reciprocal relationship between ROS and mitochondrial dynamics, whereby elevated ROS promotes mitochondrial fission, which in turn generates more mitochondrial ROS. Support of this conclusion stems from (1) various comple-mentary supraphysiologic (hyperoxia), pharmacologic (NAC/NAM, MitoTEMPO), and genetic (SIRT-3) tools that upregulate or down-regulate mtROS levels, as assessed by different probes, and trigger a parallel increased or decreased MK ability to initiate thrombopoi-esis; (2) evidence that onset of thrombopoiesis, which is assessed by a decreased cell roundness index in intermediate MKs, is linked to increased mtROS levels; (3) documentation on mitochondrial dynamics changes that affect both ROS levels and thrombopoiesis. Similar interactions between mitochondrial dynamics and ROS
were reported in endothelial cells in models of type 1 diabetes37
and wound healing38and also in neurodegeneration of primary
neurons.39Neurons exhibit a reticular mitochondrial network in
neuronal cell bodies and discrete bean-shaped organelles in
axons40; vigorous transport of cytoplasmic components,
espe-cially mitochondria, along the axons over substantial distances is
crucial for proper neuron structure and function.19Remarkably,
the stage-specific mitochondrial remodeling that we observed, in which the large reticular network of mitochondria in mature MKs transitions to discrete organelles in proplatelet-forming MKs, is reminiscent of what has been observed in neurons. Similarly, mitochondrial transport to future platelet territories provides the local energy required for platelet function in hemostasis. The
contribution of ROS to thrombopoiesis has long been suspected, in relation to observations that mature bone marrow MKs are
all intimately associated with sinusoid vessels,4and that platelet
levels increase in hyperoxic postpulmonary vessels compared with pulmonary arteries. Our data extend these observations by providing evidence that mtROS are essential for initiation of the formation of proplatelet-forming MKs. This result supports a model in which increased levels of oxygen in the microenvironment of ma-ture MKs, by enhancing local ROS, trigger an autoactivation loop that then sustains platelet biogenesis from human mature MKs (Figure 6).
Our data clearly demonstrate that mitochondrial oxidative metab-olism plays a major role in the onset of thrombopoiesis. Interestingly, first observations from MK/platelet-specific Drp1-null mice in-dicated that Drp1 regulates the mitochondrial morphology of MKs and platelets, and also the number of platelets, thus providing in vivo evidence to functional links between mitochondrial fission and
platelet production.41Moreover, exposure of maturing MKs to
low-level infrared laser light favors platelet biogenesis by enhancing
mitochondrial mass and mitochondrial activity,42which suggests
that mitochondrial energy may be a crucial rate-limiting factor in the late stages of thrombopoiesis. Although it is not known whether Drp1 and ROS interact with each other in mature MKs, p38-MAPK
directly associates with Drp1 and phosphorylates its Ser616
residue, which promotes mitochondrial fission, increased ROS production, and further triggering of Rho GTPase activation and
F-actin formation in human mesenchymal stem cells.20 Also,
phosphorylation of Drp1-S616 by ERK2 in response to oxidative
stress in cancer cells promotes mitochondrial fission that is crucial
for tumor cell growth.43,44Whether changes in oxygen
concentra-tion in the bone marrow from the extravascular to the intravascular
Mitochondrial ROS Mitochondrial size Round MK p-MLC2 P P P P P P P P P P P Drp1 pDrp1 pDrp1 ROS ROS ROS ROS ROS ROS ROS ROS ROS ROS
ROS ROS ROS
ROS ROS ROS ROS ROS ROS ROS ROS Sinusoid Fission ML C2
Intermediate MK Terminal proplatelet MK
ΔpO2
Figure 6.An autoamplification loop links mitochondrial dynamics and ROS production to onset of thrombopoiesis. Onset of thrombopoiesis from mature round MKs occurs when a positive oxygen gradient is present between the extravascular edge of the sinusoids, where the MKs are located, and the blood flow. It is characterized by cell deformation (loss of MK roundness) and cytoskeletal reorganization (loss of MLC phosphorylation) of intermediate MKs, followed by the formation of extended cell protrusions resulting in terminal proplatelet-forming MKs. This loss of roundness is preceded by a strong recruitment of active pDrp1 to mitochondria that triggers fission within nondeformed, round MKs. Mitochondrial fission and ROS production are triggered by the positive oxygen gradient, which favors additional mitochondrial pDrp1 recruitment, additional fission, and ROS production in an autoamplifying loop that is necessary for thrombopoiesis to proceed, allowing for the formation of long intravascular proplatelet extensions filled with small, well-delineated mitochondria in terminal MKs.
space triggers a similar ROS-dependent Ser616-Drp1 phosphory-lation cascade in MKs that promotes mitochondrial fission and mtROS production in a feed-forward positive loop remains to be studied.
ROS are known to regulate actomyosin levels and formation of microtubules in various cell contexts, tuning cell and tissue
dynamics.38The Rho effector ROCK and its substrates are targets
of mtROS and influence tissue patterning through the coordinated regulation of mitochondrial morphology and tissue tension. Propla-telet formation is associated with morphological changes that require profound cytoskeleton reorganization; the contractile forces gen-erated by myosin-2 and F-actin restrain cytoplasmic extensions and must be inactivated to trigger MK extensions and proplatelet
formation.5The Rho/ROCK/myosin-2 pathway is known to play
a key role in the reorganization of the MK cytoskeleton needed
for formation of proplatelets.29,30,45 We observed an interesting
inverse correlation between ROS levels and MLC phosphorylation. Thus, our data open the possibility that changes of oxidative metabolism in mature MKs initiates thrombopoiesis by coordinating changes in mitochondrial dynamics, remodeling of the cytoskeleton, and proper organite relocation in future platelet territories. A search for genetic mutations supporting essential thrombocy-themia and reactive thrombocytosis identified a defective redox-coupling enzyme, biliverdine IXb reductase, suggesting that
dysregulated ROS signaling can impair platelet production.46
Conversely, mutations associated with familial autosomal dom-inant thrombocytopenia were identified in human cytochrome c (CYCS), which functions in the mitochondrial electron transfer
chain.47MKs differentiated from CYCS patient CD341HSPCs
showed accelerated production of platelets in vitro; abnormal platelet release within the bone marrow space was observed
in vivo, leading to thrombocytopenia in the bloodstream.48These
observations made the authors propose that mutated cyto-chrome c triggered MK premature apoptosis, which they later questioned, leaving the mechanistic link between CYCS and
thrombocytopenia an ongoing question.47Our data now raise
the possibility that cytochrome c mutations may cause increased ROS production that mimics the ROS bursts that normally occur when MKs enter sinusoids, thus leading to abnormal platelet release in the bone marrow space rather than blood vessels. Finally, given the prevalence of medical disorders that affect blood platelet levels, our work has important implications for diagnostic
and treatment of such diseases. For instance, thrombocytopenia often appears as a complication accompanying a variety of
differ-ent diseases, whose etiology is often ill defined.49 Conversely,
thrombocythemia linked to physical or psychological stress has been associated with sympathetic neuron activities and excess
ROS production.16Our results extend these data and raise the
possibility that abnormal oxidative stress, abnormal metabolism, and mitochondrial dysfunction play a key role in many platelet disorders, particularly reactive thrombocytopenia after infection, inflammation, or targeted therapies, and suggest that pro-oxidant and antioxidant treatments help tune platelet production in patients.
Acknowledgments
The authors thank the Cytometry and Immunobiology Facility of Institut Cochin/INSERM U1016 and the Obstetric Unit of Orsay Hospital and the Cell Therapy Center of Saint Louis Hospital (Paris, France) for cord blood samples.
This work was supported by INSERM, CNRS, Universit ´e de Paris, and French Research Agency (ANR-17-CE18-0025 grant). A.H. is a fellow from the French Research Agency. The funders had no role in study design, data collection and analysis, decision to publish, or preparation of the manuscript.
Authorship
Contribution: D.B., I.D.-F., V.N.-A, and S.P.-C. designed the research and analyzed the data; S.P.-C., A.H., A.K., and R.L.-K. performed the experiments; D.B., and I.D.-F. wrote the original draft of the manuscript; D.B., I.D.-F., V.N.-A., S.P.-C., E.L., and A.K. wrote, reviewed, and edited the manuscript; S.P.-C, V.N.-A., and A.H. pro-duced the figures; and D.B., I.D.-F., V.N.-A., and A.K. obtained funding.
Conflict-of-interest disclosure: The authors declare no compet-ing financial interests.
ORCID profiles: V.N.-A., 0003-2490-0428; A.K.,
0000-0002-4064-81140000-0003-4643-6857E.L.I.D.-F.,
0000-0002-9286-1021.
Correspondence: Dominique Baruch, INSERM UMRS 1140, Facult ´e de Pharmacie, 4 Av de l’Observatoire, F-75006 Paris, France; e-mail: [email protected]; and Isabelle Dusanter-Fourt, INSERM U1016, 27 Rue du Fg St Jacques, F-75014 Paris, France; e-mail: [email protected].
References
1. Kramer PA, Ravi S, Chacko B, Johnson MS, Darley-Usmar VM. A review of the mitochondrial and glycolytic metabolism in human platelets and leukocytes: implications for their use as bioenergetic biomarkers. Redox Biol. 2014;2:206-210.
2. Kaushansky K. The molecular mechanisms that control thrombopoiesis. J Clin Invest. 2005;115(12):3339-3347.
3. Eckly A, Heijnen H, Pertuy F, et al. Biogenesis of the demarcation membrane system (DMS) in megakaryocytes. Blood. 2014;123(6):921-930. 4. Junt T, Schulze H, Chen Z, et al. Dynamic visualization of thrombopoiesis within bone marrow. Science. 2007;317(5845):1767-1770.
5. Bender M, Thon JN, Ehrlicher AJ, et al. Microtubule sliding drives proplatelet elongation and is dependent on cytoplasmic dynein. Blood. 2015;125(5): 860-868.
6. Richardson JL, Shivdasani RA, Boers C, Hartwig JH, Italiano JE Jr.. Mechanisms of organelle transport and capture along proplatelets during platelet production. Blood. 2005;106(13):4066-4075.
7. D ¨utting S, Gaits-Iacovoni F, Stegner D, et al. A Cdc42/RhoA regulatory circuit downstream of glycoprotein Ib guides transendothelial platelet biogenesis. Nat Commun. 2017;8(1):15838.
8. Stegner D, vanEeuwijk JMM, Angay O, et al. Thrombopoiesis is spatially regulated by the bone marrow vasculature. Nat Commun. 2017;8(1):127. 9. Blin A, Le Goff A, Magniez A, et al. Microfluidic model of the platelet-generating organ: beyond bone marrow biomimetics. Sci Rep. 2016;6(1):
21700.
10. Dunois-Lard ´e C, Capron C, Fichelson S, Bauer T, Cramer-Bord ´e E, Baruch D. Exposure of human megakaryocytes to high shear rates accelerates platelet production. Blood. 2009;114(9):1875-1883.
11. Pallotta I, Lovett M, Kaplan DL, Balduini A. Three-dimensional system for the in vitro study of megakaryocytes and functional platelet production using silk-based vascular tubes. Tissue Eng Part C Methods. 2011;17(12):1223-1232.
12. Thon JN, Mazutis L, Wu S, et al. Platelet bioreactor-on-a-chip. Blood. 2014;124(12):1857-1867.
13. Mostafa SS, Miller WM, Papoutsakis ET. Oxygen tension influences the differentiation, maturation and apoptosis of human megakaryocytes. Br J Haematol. 2000;111(3):879-889.
14. Zucker-Franklin D, Philipp CS. Platelet production in the pulmonary capillary bed: new ultrastructural evidence for an old concept. Am J Pathol. 2000; 157(1):69-74.
15. Lefrançais E, Ortiz-Muñoz G, Caudrillier A, et al. The lung is a site of platelet biogenesis and a reservoir for haematopoietic progenitors. Nature. 2017; 544(7648):105-109.
16. Chen S, Hu M, Shen M, et al. Dopamine induces platelet production from megakaryocytes via oxidative stress-mediated signaling pathways. Platelets. 2018;29(7):702-708.
17. Chen S, Su Y, Wang J. ROS-mediated platelet generation: a microenvironment-dependent manner for megakaryocyte proliferation, differentiation, and maturation. Cell Death Dis. 2013;4(7):e722.
18. O’Brien JJ, Spinelli SL, Tober J, et al. 15-deoxy-delta12,14-PGJ2 enhances platelet production from megakaryocytes. Blood. 2008;112(10):4051-4060. 19. Beckervordersandforth R. Mitochondrial Metabolism-Mediated Regulation of Adult Neurogenesis. Brain Plast. 2017;3(1):73-87.
20. Ko SH, Choi GE, Oh JY, et al. Succinate promotes stem cell migration through the GPR91-dependent regulation of DRP1-mediated mitochondrial fission. Sci Rep. 2017;7(1):12582.
21. Chen H, Chan DC. Mitochondrial Dynamics in Regulating the Unique Phenotypes of Cancer and Stem Cells. Cell Metab. 2017;26(1):39-48. 22. Steib K, Sch ¨affner I, Jagasia R, Ebert B, Lie DC. Mitochondria modify exercise-induced development of stem cell-derived neurons in the adult brain.
J Neurosci. 2014;34(19):6624-6633.
23. Poirault-Chassac S, Six E, Catelain C, et al. Notch/Delta4 signaling inhibits human megakaryocytic terminal differentiation. Blood. 2010;116(25): 5670-5678.
24. Robert A, Cortin V, Garnier A, Pineault N. Megakaryocyte and platelet production from human cord blood stem cells. Methods Mol Biol. 2012;788: 219-247.
25. Salzmann M, Hoesel B, Haase M, et al. A novel method for automated assessment of megakaryocyte differentiation and proplatelet formation. Platelets. 2018;29(4):357-364.
26. Ahn BH, Kim HS, Song S, et al. A role for the mitochondrial deacetylase Sirt3 in regulating energy homeostasis. Proc Natl Acad Sci USA. 2008;105(38): 14447-14452.
27. Naudin C, Hattabi A, Michelet F, et al. PUMILIO/FOXP1 signaling drives expansion of hematopoietic stem/progenitor and leukemia cells. Blood. 2017; 129(18):2493-2506.
28. Giammona LM, Panuganti S, Kemper JM, et al. Mechanistic studies on the effects of nicotinamide on megakaryocytic polyploidization and the roles of NAD1 levels and SIRT inhibition. Exp Hematol. 2009;37(11):1340-1352.e3.
29. Chen Y, Boukour S, Milloud R, et al. The abnormal proplatelet formation in MYH9-related macrothrombocytopenia results from an increased actomyosin contractility and is rescued by myosin IIA inhibition. J Thromb Haemost. 2013;11(12):2163-2175.
30. Chang Y, Aurad ´e F, Larbret F, et al. Proplatelet formation is regulated by the Rho/ROCK pathway. Blood. 2007;109(10):4229-4236.
31. McCarthy C, Kenny LC. Therapeutically targeting mitochondrial redox signalling alleviates endothelial dysfunction in preeclampsia. Sci Rep. 2016;6(1): 32683.
32. Kim HS, Patel K, Muldoon-Jacobs K, et al. SIRT3 is a mitochondria-localized tumor suppressor required for maintenance of mitochondrial integrity and metabolism during stress. Cancer Cell. 2010;17(1):41-52.
33. Mishra P, Chan DC. Metabolic regulation of mitochondrial dynamics. J Cell Biol. 2016;212(4):379-387.
34. Taguchi N, Ishihara N, Jofuku A, Oka T, Mihara K. Mitotic phosphorylation of dynamin-related GTPase Drp1 participates in mitochondrial fission. J Biol Chem. 2007;282(15):11521-11529.
35. Li YH, Xu F, Thome R, et al. Mdivi-1, a mitochondrial fission inhibitor, modulates T helper cells and suppresses the development of experimental autoimmune encephalomyelitis. J Neuroinflammation. 2019;16(1):149.
36. Bordt EA, Clerc P, Roelofs BA, et al. The Putative Drp1 Inhibitor mdivi-1 Is a Reversible Mitochondrial Complex I Inhibitor that Modulates Reactive Oxygen Species. Dev Cell. 2017;40(6):583-594.e6.
37. Makino A, Scott BT, Dillmann WH. Mitochondrial fragmentation and superoxide anion production in coronary endothelial cells from a mouse model of type 1 diabetes. Diabetologia. 2010;53(8):1783-1794.
38. Muliyil S, Narasimha M. Mitochondrial ROS regulates cytoskeletal and mitochondrial remodeling to tune cell and tissue dynamics in a model for wound healing. Dev Cell. 2014;28(3):239-252.
39. Hung CH, Cheng SS, Cheung YT, et al. A reciprocal relationship between reactive oxygen species and mitochondrial dynamics in neurodegeneration. Redox Biol. 2018;14:7-19.
40. Saxton WM, Hollenbeck PJ. The axonal transport of mitochondria. J Cell Sci. 2012;125(pt 9):2095-2104.
41. Tugolukova EA, Campbell RA, Hoerger KB, Schwertz H, Weyrich AS, Rowley JW. Mitochondrial Fission Protein Drp1 Regulates Megakaryocyte and Platelet Mitochondrial Morphology, Platelet Numbers, and Platelet Function [abstract]. Blood. 2017;130(suppl 1). Abstract 455.
42. Zhang Q, Dong T, Li P, Wu MX. Noninvasive low-level laser therapy for thrombocytopenia. Sci Transl Med. 2016;8(349):349ra101.
43. Rezatabar S, Karimian A, Rameshknia V, et al. RAS/MAPK signaling functions in oxidative stress, DNA damage response and cancer progression. J Cell Physiol. 2019;234(9):14951-14965.
44. Kashatus JA, Nascimento A, Myers LJ, et al. Erk2 phosphorylation of Drp1 promotes mitochondrial fission and MAPK-driven tumor growth. Mol Cell. 2015;57(3):537-551.
45. Pan J, Lordier L, Meyran D, et al. The formin DIAPH1 (mDia1) regulates megakaryocyte proplatelet formation by remodeling the actin and microtubule cytoskeletons. Blood. 2014;124(26):3967-3977.
46. Wu S, Li Z, Gnatenko DV, et al. BLVRB redox mutation defines heme degradation in a metabolic pathway of enhanced thrombopoiesis in humans. Blood. 2016;128(5):699-709.
47. Ledgerwood EC, Dunstan-Harrison C, Ong L, Morison IM. CYCS gene variants associated with thrombocytopenia. Platelets. 2019;30(5):672-674. 48. Ong L, Morison IM, Ledgerwood EC. Megakaryocytes from CYCS mutation-associated thrombocytopenia release platelets by both
proplatelet-dependent and -independent processes. Br J Haematol. 2017;176(2):268-279.
49. Vardon-Bounes F, Ruiz S, Gratacap MP, Garcia C, Payrastre B, Minville V. Platelets Are Critical Key Players in Sepsis. Int J Mol Sci. 2019;20(14):3494.