HAL Id: inserm-02908117
https://www.hal.inserm.fr/inserm-02908117
Submitted on 28 Jul 2020
HAL is a multi-disciplinary open access
archive for the deposit and dissemination of
sci-entific research documents, whether they are
pub-lished or not. The documents may come from
teaching and research institutions in France or
abroad, or from public or private research centers.
L’archive ouverte pluridisciplinaire HAL, est
destinée au dépôt et à la diffusion de documents
scientifiques de niveau recherche, publiés ou non,
émanant des établissements d’enseignement et de
recherche français ou étrangers, des laboratoires
publics ou privés.
of Afadin-dependent oriented cell division
Martina Bonucci, Nicolas Kuperwasser, Serena Barbe, Vonda Koka, Delphine
de Villeneuve, Chi Zhang, Nishit Srivastava, Xiaoying Jia, Matthew Stokes,
Frank Bienaimé, et al.
To cite this version:
Martina Bonucci, Nicolas Kuperwasser, Serena Barbe, Vonda Koka, Delphine de Villeneuve, et al..
mTOR and S6K1 drive polycystic kidney by the control of Afadin-dependent oriented cell division.
Nature Communications, Nature Publishing Group, 2020, 11 (1), pp.3200.
�10.1038/s41467-020-16978-z�. �inserm-02908117�
mTOR and S6K1 drive polycystic kidney by the
control of Afadin-dependent oriented cell division
Martina Bonucci
1,2,3,10
, Nicolas Kuperwasser
1,2,3,10
, Serena Barbe
1,2,3
, Vonda Koka
1,2,3
,
Delphine de Villeneuve
1,2,3
, Chi Zhang
1,2,3
, Nishit Srivastava
4
, Xiaoying Jia
5
, Matthew P. Stokes
5
,
Frank Bienaimé
1,2,3
, Virginie Verkarre
6,7
, Jean Baptiste Lopez
8
, Fanny Jaulin
8
, Marco Pontoglio
1,2,3
,
Fabiola Terzi
1,2,3
, Benedicte Delaval
9
, Matthieu Piel
4
& Mario Pende
1,2,3
✉
mTOR activation is essential and sufficient to cause polycystic kidneys in Tuberous Sclerosis
Complex (TSC) and other genetic disorders. In disease models, a sharp increase of
pro-liferation and cyst formation correlates with a dramatic loss of oriented cell division (OCD).
We
find that OCD distortion is intrinsically due to S6 kinase 1 (S6K1) activation. The
con-comitant loss of S6K1 in Tsc1-mutant mice restores OCD but does not decrease
hyperpro-liferation, leading to non-cystic harmonious hyper growth of kidneys. Mass
spectrometry-based phosphoproteomics for S6K1 substrates revealed Afadin, a known component of
cell-cell junctions required to couple intercell-cellular adhesions and cortical cues to spindle
orien-tation. Afadin is directly phosphorylated by S6K1 and abnormally decorates the apical surface
of Tsc1-mutant cells with E-cadherin and α-catenin. Our data reveal that S6K1 hyperactivity
alters centrosome positioning in mitotic cells, affecting oriented cell division and promoting
kidney cysts in conditions of mTOR hyperactivity.
https://doi.org/10.1038/s41467-020-16978-z
OPEN
1Institut Necker-Enfants Malades, 14 rue Maria Helena Vieira Da Silva, CS 61431 Paris, France.2Inserm, U1151, Paris F-75014, France.3Université Paris
Descartes, Sorbonne Paris Cité, Paris, France.4Institut Curie, PSL Research University, CNRS, UMR 144, F-75005 Paris, France.5Cell Signaling Technology
INC, 3 Trask Lane, Danvers, MA 01923, USA.6Université de Paris, PARCC, INSERM, Equipe Labellisée par la Ligue contre le Cancer, F-75015 Paris, France.
7Assistance Publique-Hôpitaux de Paris (AP-HP centre), Hôpital Européen Georges Pompidou, Département d’anatomo-pathologie, F-75015 Paris, France.
8INSERM U-981, Gustave Roussy, Villejuif, France.9CRBM, CNRS, Univ. Montpellier, Centrosome, cilia and pathologies Lab, 1919 Route de Mende, 34293
Montpellier, France.10These authors contributed equally: Martina Bonucci, Nicolas Kuperwasser. ✉email:mario.pende@inserm.fr
123456789
M
ammalian target of rapamycin (mTOR) is a serine/
threonine kinase present in every eukaryotic cell. Its
function is to integrate nutritional signals and promote
growth
1. mTOR generally stimulates macromolecule biosynthesis.
At the cellular level, mTOR increases cell size, proliferation, and
survival, while suppressing the autophagic degradation of
intra-cellular material. mTOR is found in two distinct protein
com-plexes (mTORC1 and mTORC2) with different cellular
localization, nutrient sensitivity, and substrate specificity.
Increasing evidence demonstrates that the constitutive activation
of mTOR underlies the overgrowth phenotype of many inherited
and sporadic genetic diseases. In kidneys, the great majority of
genetic diseases leading to polycystosis converge in the activation
of mTORC1. These include autosomal dominant polycystic
kid-ney disease (ADPKD), type I oral-facial-digital syndrome,
Tuberous Sclerosis Complex (TSC), and Birt-Hogg-Dubé
syn-drome (BHD)
2–5. The requirement of mTORC1 activity for cyst
formation is demonstrated by the broad efficacy of the allosteric
mTORC1 inhibitor rapamycin in mouse models of these
diseases
2,3,6,7. An intense remodeling of the tissue underlies
polycystic kidney development
8. Increased proliferation rates are
accompanied by alterations in cell survival,
fluid secretion,
ded-ifferentiation, alterations in basement membrane, and epithelial
cell polarity. However, how the mTORC1 pathway promotes the
various cellular responses in the context of polycystic kidneys
remains largely unknown.
Among the genetic diseases up-regulating mTORC1, the
Tuberous Sclerosis Complex (TSC) is the best characterized at the
molecular level. TSC results from inherited or de novo mutations
in the TSC1 and TSC2 genes
9. The TSC1 and TSC2 gene products
associate in a complex with GTPase-activating protein (GAP)
activity towards the Ras homolog enriched in brain (Rheb)
pro-tein
10. As a consequence of TSC1/TSC2 loss-of-function
muta-tions, the GTP-loaded form of Rheb constitutively activates
mTORC1 at lysosomal membranes. TSC patients suffer from
hamartomas, benign tumors in multiple organs, including the
brain and kidney
9. In addition, TSC patients display an increased
risk of developing polycystic kidney disease. Extensive proteomics
and biochemical studies have revealed an increasing list of
mTORC1 substrates
11–13; however, in the pathological setting of
TSC, the molecular targets of mTORC1 that mediate cyst
for-mation are unknown.
Genetic epistasis experiments in the fruit
fly Drosophila were
the
first to assess the contributions of TOR and S6 Kinase (S6K)
in the overgrowth of Tsc mutants
14. The size of Tsc1- or
Tsc2-mutant ommatidia are double that of wild type. Deletion of Tor
causes a dramatic atrophy in both wild-type and Tsc-mutant
background, while S6k deletion has a mild effect on wild-type
flies, but it is sufficient to blunt Tsc-mutant overgrowth, precisely
to the level of wild-type cells. These data suggest two important
considerations: Tor deletion affects multiple targets involved in
growth control, causing severe cellular atrophy; and the
over-growth phenotype of TSC mutants seems exquisitely sensitive to
S6K inhibition, which may represent a valuable strategy against
TSC-related overgrowth. Mammalian cells express two S6K
homologs, S6K1 and S6K2
15,16. They belong to the AGC family of
serine/threonine kinases and may share redundant targets with
Akt1-3, 90 KDa Ribosomal Protein S6 Kinase 1–4 (Rsk1-4),
Serum/Glucocorticoid Regulated Kinase 1–3 (SGK1-3), and
protein kinases C (PKCs)
17. mTORC1 specifically activates S6K1
and S6K2 by phosphorylation, whereas Akt, SGK, and PKC are
phosphorylated by mTORC2
18. Since TSC mutations selectively
up-regulate mTORC1
10, S6Ks are the only AGC kinases activated
in this disease, with the other kinases being unaffected or
sup-pressed as a consequence of the negative feed-back regulation of
mTORC1 on mTORC2
19. S6Ks are also very sensitive to
mTORC1 inhibition by rapamycin
13. Taken together, these
evi-dences prompted the investigation of the role of S6K in TSC
pathological lesions and in rapamycin-sensitive responses.
Here we take advantage of a well-characterized model of Tsc1
deficiency in kidney tubular cells, leading to polycystic kidneys in
adult mice (Ksp-Cre; Tsc1
fl/fl)
20. We show that mTORC1 controls
two distinct pathways in kidney epithelia, an S6K1-independent
pathway regulating the rate of cell proliferation, and an
S6K1-dependent pathway regulating the orientation of cell division.
S6k1 deletion in the Tsc1-mutant background re-establishes the
correct axis of cell division and rescues the cystic phenotype.
Mechanistically, we show that the S6K1 phosphoproteome is
enriched in proteins involved in the cell adhesion system and
actomyosin cortex. One S6K1 substrate, Afadin, is a component
of cell adhesion systems and contributes to the regulation of
oriented cell division.
Results
Loss of S6k1 rescues cyst formation without affecting
pro-liferation. To score for the epistatic interaction of Tsc1 and S6k1
in polycystic kidney development, we compared Ksp-Cre; Tsc1
fl/flwith Ksp-Cre; Tsc1
fl/fl; S6k1
−/−kidneys. Ksp-Cre expression
drives recombination of
floxed alleles in kidney tubular cells
starting from E14.5
21. Using a confetti reporter, recombination
was detected in both the cortex and medulla (Supplementary
Fig. 1a, b). As previously reported
20,22,23, Tsc1 deletion resulted in
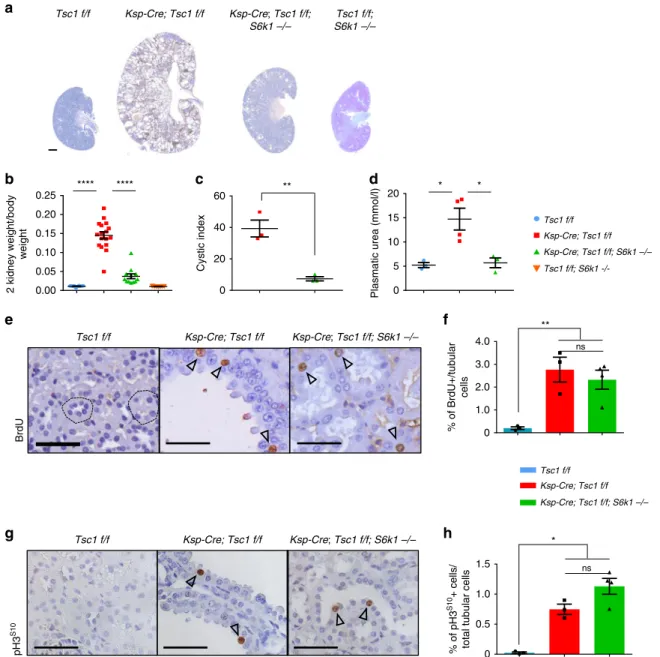
kidney overgrowth and cyst formation (Fig.
1
a and
Supplemen-tary Fig. 2a, b). At postnatal day 90 (P90), the kidney to body
weight ratio was 14-fold greater than wild type (Fig.
1
b).
Strik-ingly, kidney overgrowth of Tsc1 mutants was blunted by the
deletion of S6k1, and the cystic index was also sharply reduced
(Fig.
1
c). This led to improvements in kidney tissue and function
as assessed by histology (Supplementary Fig. 2b) and plasmatic
urea levels (Fig.
1
d), respectively. Since increased cell proliferation
might contribute to cyst formation, cell cycle progression was
scored by anti-Bromodeoxyuridine (BrdU) staining, after a
2-h-pulse with BrdU, and anti-phospho Histone H3 staining. The
former labels S-phase cells and the latter mitotic cells. As shown
in Fig.
1
e–h, Tsc1 deletion caused a more than 20-fold increase in
tubular cell proliferation. Surprisingly, S6k1 inactivation did not
affect the proliferation rate of Tsc1-mutant cells. Taken together,
our data indicate that it is possible to separate cell proliferation
and cyst formation driven by mTORC1. In the absence of S6K1,
mTORC1 hyperactivation still drives cell proliferation, but cyst
formation is strongly prevented. One expected consequence
would be tubule elongation rather than enlargement in Ksp-Cre;
Tsc1
fl/fl; S6k1
−/−kidneys. Since the great majority of the distal
part of the nephron resides in the medulla, a lengthening of the
tubular system often results in a decrease of the cortex to medulla
thickness ratio. Consistently, in Ksp-Cre; Tsc1
fl/fl; S6k1
−/−kid-neys, the cortex to medulla ratio was significantly reduced as
compared to wild type, demonstrating a lengthening of the
tub-ular system (Supplementary Fig. 3).
The fact that the proliferation observed in Tsc1-deficient
kidneys does not depend on S6K1 was confirmed in another
mouse line of Tsc1 deficiency, CAGGCre-ER
TM; Tsc1
fl/fl. As we
previously reported
24, this ubiquitously expressed and temporally
regulated Cre transgenic allele allows the mosaic deletion of Tsc1
in all tissues after tamoxifen (TM) administration, recapitulating
the multisystemic features of the disease. In kidneys, the
overgrowth phenotype of CAGGCre-ER
TM; Tsc1
fl/flmice was
milder as compared to Ksp-Cre; Tsc1
fl/flmice, leading to a 9-fold
increase in kidney to body weight ratio at P90 (Supplementary
Fig. 4a). Of note, S6k1 deletion was sufficient to partially blunt the
overgrowth, while the combined deletion of S6k1 and S6k2 did
not further reduce kidney weight. Consistent with the Ksp-Cre;
Tsc1
fl/flmodel, S6k1 deficiency did not have an impact on tubular
cell proliferation, but rather on cyst formation (Supplementary
Fig. 4b, c). Thus, S6K1 activity is required for robust cyst
formation in mouse models of TSC.
mTORC1/S6K1 activation and cell size alterations precede cyst
formation. Ksp-Cre-mediated recombination led to similar losses
of Tsc1 expression in Tsc1
fl/fland Tsc1
fl/fl; S6k1
−/−kidneys, as
assessed by Tsc1 mRNA expression (Fig.
2
a). In Tsc1-mutant
kidneys, tubular enlargement was not observed in the
first
3 weeks of postnatal life; however, at precystic stage P20, S6K
activity was already up-regulated in Ksp-Cre; Tsc1
fl/flkidneys
(Fig.
2
b). S6K1 deletion impaired phosphorylation of
Carbamoyl-Phosphate Synthetase 2, Aspartate Transcarbamylase, And
Dihydroorotase (CAD) and Rapamycin-insensitive companion
of mTOR (RICTOR), known to be S6K1-specific substrates
(Fig.
2
c)
25,26. The phosphorylation of ribosomal protein S6
(RPS6) was not completely inhibited in S6K1-deficient kidneys,
owing to the presence of S6K2
15. Consistent with the TSC1/2
a
2 kidney weight/body weight 0.25 0.20 0.15 0.10 0.05 0.00 **** ****c
d
b
% of BrdU+/tubular cellse
f
Ksp-Cre; Tsc1 f/f; S6k1 –/– Ksp-Cre; Tsc1 f/f Tsc1 f/f BrdU Ksp-Cre; Tsc1 f/f; S6k1 –/– Ksp-Cre; Tsc1 f/f Tsc1 f/f Ksp-Cre; Tsc1 f/f; S6k1 –/– Ksp-Cre; Tsc1 f/f Tsc1 f/f 4.0 3.0 2.0 1.0 0g
pH3 S10 % of pH3 S10 + cells/total tubular cells
1.5 1.0 0.5 0 ** 20 15 10 5 0 *
Plasmatic urea (mmol/l)
* Ksp-Cre; Tsc1 f/f; S6k1 –/– Ksp-Cre; Tsc1 f/f Tsc1 f/f Cystic index 60 40 20 0 ** *
h
Tsc1 f/f Ksp-Cre; Tsc1 f/f Ksp-Cre; Tsc1 f/f; S6k1 –/– Tsc1 f/f; S6k1 –/– ns ns Tsc1 f/f; S6k1-/-Fig. 1 S6K1 deletion protects from cyst formation in a mouse model of renal TSC without affecting proliferation. a Macroscopic photos of BrdU staining
at post-natal day 90 of the different genotypes indicated. Scale bar, 1 mm.b Kidney/body weight ratio of the indicated phenotypes at post-natal day 90.
Mean ± SEM. n = 12 Tsc1 f/f, n = 17 Ksp-Cre; Tsc1 f/f and n = 12 Ksp-Cre; Tsc1 f/f; S6k1 −/− mice were quantified. c Cystic index – (total cystic area/total
kidney area) × 100– of mice of indicated genotypes. Mean ± SEM. n = 3 mice/group. d Plasmatic urea concentrations (mmol/l) were determined in the
indicated genotypes at post-natal day 20. Mean ± SEM. n = 3 Tsc1 f/f, n = 4 Ksp-Cre; Tsc1 f/f and n = 3 Ksp-Cre; Tsc1 f/f; S6k1 −/− mice were quantified.
e Representative pictures and f relative quantifications of BrdU staining at post-natal day 90 of the indicated genotypes. The percentage of BrdU-positive
cells on the total number of tubular cells was counted in 10 differentfields of each section. Dotted circles show transversal cuts of normal tubules. Empty
arrows point at positive cells. Mean ± SEM. n = 3 Tsc1 f/f, n = 3 Ksp-Cre; Tsc1 f/f and n = 4 Ksp-Cre; Tsc1 f/f; S6k1 −/− mice were quantified n = 3 mice/
group. Scale bar, 20µm. g Representative pictures and h relative quantifications of pH3S10staining at post-natal day 90 of the different genotypes
indicated. The percentage of pH3S10-positive cells on the total number of tubular cells was counted in 10 differentfields of each section. Empty arrows
point at positive cells. Mean ± SEM. n = 3 Tsc1 f/f, n = 3 Ksp-Cre; Tsc1 f/f and n = 4 Ksp-Cre; Tsc1 f/f; S6k1 −/− mice were quantified. Scale bar,
complex selectively controlling mTORC1
19, Akt phosphorylation
by mTORC2 was not increased in TSC mutants. These changes in
mTORC1/S6K1 signal transduction correlated with
S6K1-dependent changes in tubular cell size at precystic stage
(Fig.
2
d, e), a reliable read-out of S6K1 activity
27,28. Thus,
mTORC1/S6K1 activation and cell size alterations preceded cyst
formation in mouse TSC kidneys.
Loss of S6k1 rescues mis-oriented cell division in a TSC
background. The control of cell division orientation was
f
Angle of division
compared to the distal tubular
axis
g
100 80 60 40 20 0a
b
c
DAPI DBA-Rh KspCre +/–; Tsc1 f/f; S6k1 –/– KspCre +/–; Tsc1 f/f Tsc1 f/f KspCre +/–; Tsc1 f/f; S6k1 –/– KspCre +/–; Tsc1 f/f Tsc1 f/fd
Tubular cell surface (
μ m 2) 80 70 60 50 ** *
e
Relative phospho protein
levels 5 4 3 2 1 0 *** **** * ** *** ** Tsc1 f/f; S6k1 –/– pH3 S10 AQP2 ** 1.5 1.0 0.5 0.0 Relative Tsc1 mRNA levels Ksp-Cre; Tsc1 f/f; S6k1 –/– Ksp-Cre; Tsc1 f/f; S6k1 –/– Tsc1 f/f; S6k1 –/– Ksp-Cre; Tsc1 f/f Ksp-Cre; Tsc1 f/f; S6k1 –/– Ksp-Cre; Tsc1 f/f Ksp-Cre; Tsc1 f/f Tsc1 f/f Tsc1 f/f Ksp-Cre; Tsc1 f/f; S6k1 –/– Ksp-Cre; Tsc1 f/f Tsc1 f/f Ksp-Cre; Tsc1 f/f; S6k1 –/– Ksp-Cre; Tsc1 f/f Tsc1 f/f Tsc1 f/f *** **** pRICTORT1 135 pCADS1859 pAktS473 pRPS6S240-244 ACTIN P70S6K RPS6 –32 kDa –32 kDa –250 kDa –250 kDa –65 kDa –70 kDa –44 kDa pRPS6 S240–244 pRICTOR T1135 pCAD S1859 pAkt S473
previously proposed as a causative factor concurring to polycystic
kidney formation
29–32, a concept that has been challenged more
recently
33,34. We therefore asked whether Tsc1 deletion altered
the orientation of cell division in an S6K1-dependent manner. A
tissue clearing method was set-up to measure in 3D the angle of
cell division relative to the tubular lumen axis at P20. After tissue
clearing, mitotic cells were labeled using phospho-histone H3,
and the tubular lumen was decorated using anti-aquaporin2
(AQP2) antibodies, which label collecting ducts and distal
tubules, or wheat germ agglutinin (WGA), which mainly labels
proximal tubules. Mitotic events were analyzed exclusively in
epithelial cells lining the tubules and not in underlying stromal
cells (Supplementary Fig. 5a). In wild-type sections, the axis of
cell division tended to be parallel to the longitudinal axis of the
tubular lumen, as the angle of cell division relative to the lumen
was <20° in the great majority of mitotic events (Fig.
2
f, g and
Supplementary Fig. 5b). However, in Tsc1 mutants, the angle of
cell division was random, with an even distribution from 0° to 90°
in both proximal and distal tubules. S6K1 inactivation in TSC
mutants re-established the correct distribution of cell division
angles. In conclusion, S6K1-dependent misorientation of cell
division is an early, possibly causative, event concurring to cyst
formation in a context of proliferative TSC-mutant kidneys. It is
likely that non-cell autonomous effects could be a major reason of
tubule distortion, including humoral factors, disturbed urinary
flow, or altered cellular adhesion between mutant cells and
neighboring wild-type cells. It has been reported that Tsc1
dele-tion can also lead to non-cell autonomous activadele-tion of the
mTORC1 pathway in epithelial cells
23. Therefore, mTORC1 is
likely to alter OCD in both Tsc1-mutant and neighboring
wild-type cells, consistent with the general efficacy of rapamycin to
blunt polycystic disease.
To dissect the cellular and molecular alterations underlying
misoriented cell division by hyperactive mTORC1/S6K1 signaling,
mouse inner medullary collecting duct-3 (mIMCD3) cells were
edited using CRISPR-Cas9 to delete the Tsc1 gene alone or in
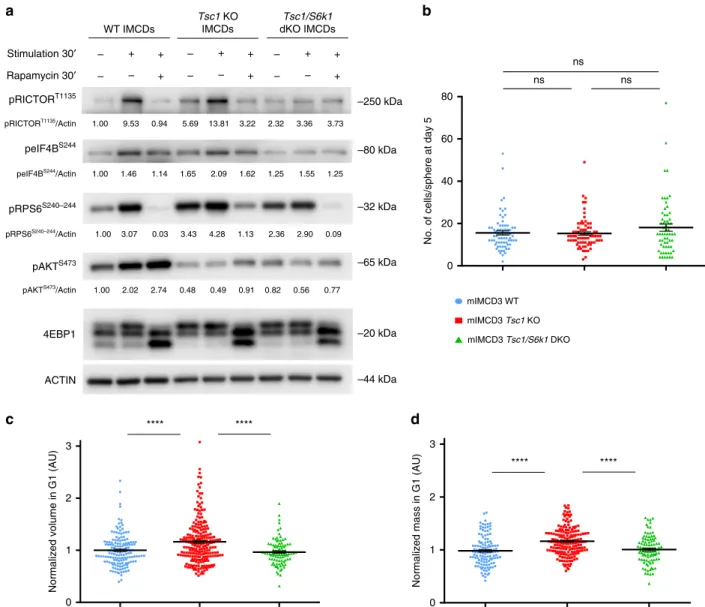
combination with S6k1 (Supplementary Fig. 6a). As expected, Tsc1
deletion conferred constitutive activation of the mTORC1 pathway
even in serum- and amino-acids-free conditions, as shown by the
band-shift of the mTORC1 substrate 4E-BP1 and the
phosphoryla-tion of the S6K1 substrates Rictor, rpS6 and Eukaryotic Translaphosphoryla-tion
Initiation Factor 4B (eIF4B) (Fig.
3
a). In addition, mTORC1
activation suppressed mTORC2-dependent Akt phosphorylation,
due to the negative feed-back loop of mTORC1/S6K1 on mTORC2.
Thus, the different branches of mTOR signaling are properly
regulated by the TSC1 and S6K1 transduction elements in these
edited kidney cell lines.
mIMCD3 cells can be maintained in culture for many passages
due to SV40 transformation and are commonly used to study
kidney epithelial organization, as they form polarized spheres
after 5 days in Matrigel-embedded cultures from a single cell. Cell
numbers were comparable among the genotypes at the end of the
5-day-spheroid assays (Fig.
3
b). Cell volume and mass were
measured in single cells by
fluorescent dye exclusion
35.
Tsc1-deficient cells in G1 phase displayed an S6K1-dependent 20%
increase in both cell volume and cell mass (Fig.
3
c, d).
Accordingly, cell density, defined as the ratio of mass to volume,
did not differ. (Supplementary Fig. 6b). The differences in cell
volume among the three genotypes were also observed at the
beginning of mitosis and during mitotic round-up
(Supplemen-tary Fig. 6c). Volume heterogeneity of the two daughter cells was
not observed, as the ratio of the larger to smaller daughter cell was
equivalent (Supplementary Fig. S6d). Taken together, while
Tsc1-deficient mIMCD3 cells do not have a proliferative advantage
over wild type in an SV40-transformed background, they display
an S6K1-dependent increase of volume and mass throughout the
cell cycle, consistent with cell size measurements in kidneys
(Fig.
2
d).
The sphere formation assay in 3D-Matrigel embedded cultures
is a common method to evaluate oriented cell division and cell
polarity
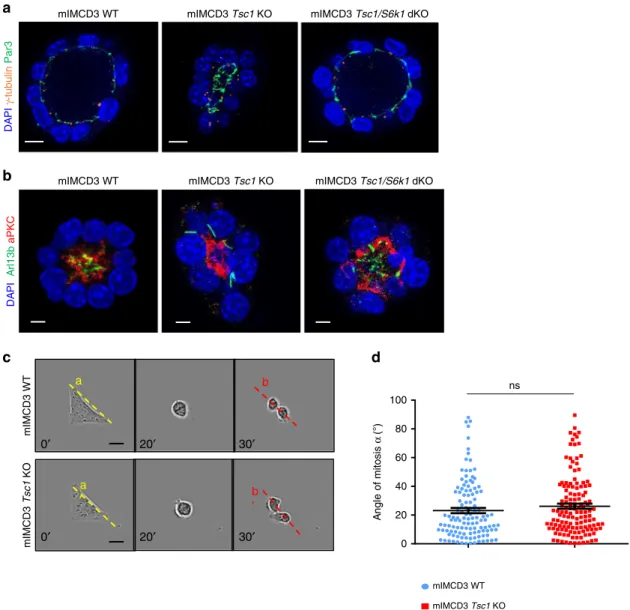
36. Wild-type cells embedded in Matrigel formed
polarized spheroids, with interphase cells displaying a
γ-Tubulin-positive centrosome at the apical surface and an
Arl13b-positive primary cilium pointing toward the lumen
(Fig.
4
a). More than 50% of wild-type spheres had polarized
cilia after 5 days (Fig.
4
b). In contrast, Tsc1-deficient cells formed
spheres with mispositioned primary cilia and small lumens. To
quantify the reduction of lumen dimension, we calculated the
ratio between the lumen diameter and number of surrounding
cells, which showed a significant reduction (Supplementary
Fig. 7a, b). Strikingly, S6k1 deletion was sufficient to rescue
polarized sphere formation and lumen size.
To confirm if defects in cell division orientation were also
observed, we monitored mitotic spindle orientation, since it
determines the axis of cell division
37. In 3D renal cultures, the
centrosome duplicates at the end of interphase, at the apical
membrane. During mitosis, the two centrosomes relocate
perpendicularly to the radius of the spheroid to the lateral sides
of the cell to form and orient the mitotic spindle, returning to the
apical surface after cytokinesis. To assess mitotic spindle
orientation, centrosomes were labeled with
γ-Tubulin antibodies
and the mitotic phases were recognized by DAPI staining of DNA
(Fig.
4
c). To calculate the axis of cell division, the centroid of the
spheroid in the middle z-plane and the midpoint of the spindle
axis were determined. By using apical markers, 3D reconstitution
and orthogonal projections, it was possible to unambiguously
define the centroid of the spheroid, including the Tsc1 mutants
(Supplementary Fig. 7c). Next, the angle between the spindle axis
and the center-to- was measured. In the majority of metaphase
and anaphase wild-type cells, this angle was close to 90° (Fig.
4
d).
However, In Tsc1-mutant cells, the spindle axis was misoriented.
This defect was rescued by the deletion of S6k1, suggesting a
Fig. 2 S6K1 hyperactivation is responsible for the aberrant orientation of cell division in TSC renal disease. a RT–QPCR for Tsc1 expression from mouse
kidneys of indicated genotypes. Data are normalized to the control mice. Mean ± SEM, n = 5 mice/group. b Western blots of mouse whole-kidney extracts at pre-cystic age (post-natal day 20) of the indicated genotypes. Mice are randomly fed. Antibodies used for the immunoblot analysis are indicated. Actin
was used as a loading control.c Densitometry analysis and fold change over control of the indicated phospho-proteins relative to actin. Mean ± SEM. n = 3
Tsc1 f/f, n = 3 Tsc1 f/f; S6k1 −/−, n = 4 Ksp-Cre; Tsc1 f/f and n = 4 Ksp-Cre; Tsc1 f/f; S6k1 −/− mice were quantified. d Representative pictures and e relative measurements of tubular cell surface area at post-natal day 10 of the indicated genotypes. Roughly n = 50 tubular sections from five different fields of each section were measured. Mean ± SEM. n = 3 mice/group. Scale bar, 10 µm. f Representative 3D reconstructed images of mitotic divisions (anaphase) of renal tubular cells, longitudinally oriented in Tsc1fl/fland Ksp-Cre; Tsc1fl/fl; S6k1−/−mice and aberrantly oriented in the Ksp-Cre; Tsc1fl/flmice. Mice were killed at precystic (post-natal day 20) stage. The tubular axis orientation is marked with a cyan dotted line, the mitosis orientation with a yellow dotted line.g Quantification of the mitotic division orientation at post-natal day 20 in of Tsc1 f/f (n = 41), Ksp-Cre; Tsc1 f/f (n = 8059) and Ksp-Cre; Tsc1
f/f; S6k1−/− (n = 49 = 43) distal tubules, in four mice per genotype. To assess the significance of the data, a Mann–Whitney U test was used. Median ±
causal link between S6K1 hyperactivity and spindle pole
mispositioning.
Spindle pole position in mitosis is tightly regulated by cell
geometry and influenced by the following factors: (i)
determi-nants of the apical complex (aPKC and Par3/Par6); (ii) shape and
contractility of the actomyosin cortex; (iii) the NuMA/LGN
complex which exerts pulling forces for astral microtubules at the
cell cortex; (iv) the interaction with the basal matrix through the
integrin system; (v) cell-to-cell junctions through the cadherin
system
37. As a
first attempt to dissect the contributions of these
factors in the TSC phenotype, the primary cilia were stained
relative to the apical domain detected by Par3 and aPKC
antibodies (Fig.
5
a, b). Additional apical markers, such as zona
occludens-1 (ZO-1) and Ezrin, confirmed that Tsc1-mutant cells
were able to properly locate the apical complex at the luminal side
(Supplementary Fig. S8a, b), ruling out the possibility that a defect
in the establishment of apical polarity contributes to spindle
misorientation. In addition, the localization of the basal marker
Integrin beta 1 (ITGB1) did not differ among the genotypes
(Supplementary Fig. S8c).
Then we asked whether the defect in Tsc1 mutants was cell
autonomous or depended on cell–cell interactions, single cells
were grown on
fibronectin-coated L-shape micropatterns. In this
system, cells rely on the integrin system to define the basolateral
domain. If there are no defects in the integrin system and no
intrinsic defects in the actomyosin cortex and mitotic spindle,
cells will divide along their longer axis (Fig.
5
c)
38,39. Strikingly,
Tsc1 mutants correctly divided similarly to the wild-type cells
(Fig.
5
d). Taken together, these data point to a rather non-cell
autonomous defect in TSC1-mutants to correctly position the
mIMCD3 Tsc1/S6k1 DKO mIMCD3 Tsc1 KO mIMCD3 WT
a
d
c
b
Normalized volume in G1 (AU) Normalized mass in G1 (AU)
3 2 1 0 3 2 1 0 **** **** **** **** WT IMCDs Tsc1 KO IMCDs Tsc1/S6k1 dKO IMCDs Stimulation 30′ Rapamycin 30′ – – + – + + – – + – + + – – + – + + peIF4BS244 pAKTS473 pRPS6S240–244 pRICTORT1135 ACTIN 4EBP1 1.00 9.53 0.94 5.69 13.81 3.22 2.32 3.36 3.73 1.00 1.46 1.14 1.65 2.09 1.62 1.25 1.55 1.25 1.00 3.07 0.03 3.43 4.28 1.13 2.36 2.90 0.09 pRICTORT1135 /Actin peIF4BS244 /Actin pRPS6S240–244/Actin 80 60 40 20 0
No. of cells/sphere at day 5
1.00 2.02 2.74 0.48 0.49 0.91 0.82 0.56 0.77 pAKTS473/Actin ns ns ns –80 kDa –32 kDa –250 kDa –65 kDa –20 kDa –44 kDa
Fig. 3 Characterization of CRISPR/Cas9-mediated deletion ofTSC1 and S6K1 in mIMCD3 cells. a Cells were serum starved overnight and subsequently
amino acid starved with EBSS (Earle’s Balanced Salt Solution) for 1.5 h. They were then either collected in starvation or stimulated with complete medium
for 0.5 h and collected or treated with 20 nM rapamycin in complete medium for 0.5 h and then collected. Cell lysates were probed with the indicated antibodies to characterize the effects of the loss of Tsc1 and Tsc1/S6k1 on mTORC1 signaling pathways in the cell lines. Densitometry analysis and relative
quantification of the phosphorylated forms of the indicated proteins are reported under each blot. Actin was used as a loading control. b Cells were
trypsinized, plated as single cells in Matrigel and cultured for 5 days before beingfixed with 4% PFA and stained with DAPI to quantify the number of cells
per sphere derived from a single cell. An average of 100 spheres pooled from three independent experiments were quantified for each genotype. Horizontal
lines represent the mean ± SEM.c Volume and d mass were analyzed by optical measurement at G1 (2.5 h after mitotic division) for the different
genotypes. An average of 100 cells pooled from three independent experiments were quantified for each genotype. Horizontal lines represent the mean ±
spindle, depending on the presence of neighboring cells. In fact,
in Matrigel embedded cultures or in vivo, cells coordinate their
division according to tissue polarity, orienting the spindle by
communication through cell–cell junctions
40.
Phoshoproteomic screening identi
fies Afadin as a S6k1 substrate.
The published literature on S6K substrates does not readily
suggest putative targets involved in mitotic spindle positioning
and intercellular adhesion cues. Thus, we exploited a
phospho-peptide enrichment method coupled with liquid chromatography
tandem mass spectrometry (LC-MS/MS)
41to uncover the
S6K1-dependent phosphoproteome by comparing Tsc1- and
Tsc1/S6k1-deficient mIMCD3 cells. The cell lines were cultured in
serum-and amino acids-free conditions, which accentuated the
sensi-tivity of Tsc1-loss for mTORC1 signaling (Fig.
3
a). To have a
broad representation of phosphopeptides, two different methods
of phosphopeptide enrichment were performed in parallel. The
first method took advantage of commercially available antibodies
recognizing phosphorylated serine/threonine (S/T) preceded by
arginine (R) residues, a motif commonly recognized by AGC
kinases including S6K. We combined antibodies recognizing the
RXXS/T (where X indicates any amino acid) and RXRXXS/T
motifs, as their patterns of phosphoprotein detection in western
blots were not superimposable (Supplementary Fig. 9). The
sec-ond method used Fe-NTA Immobilized Metal Affinity
Chro-matography (IMAC) to enrich for phosphopeptides. In total,
15,444 unique phosphopeptides were identified after IMAC
enrichment and 1355 after AGC-motif enrichment, with a
com-mon subset of 839 phosphopeptides, indicating that the two
methods are complementary, allowing broader coverage of the
phosphoproteome (Supplementary Table 1). The great majority
of known S6K substrates were identified and quantified in the
analysis (Fig.
6
a, b, Supplementary Table 2). Out of 27 S6K
substrates reported in the literature in different cell types, 12 were
significantly down-regulated in Tsc1/S6k1 mutant cells as
com-pared to Tsc1 mutants from the IMAC screen and 9 from the
AGC screen. The combination of the two methods covered more
than 50% of reported S6K substrates, highlighting the ability to
find proteins t of interest using this methodology.
Next, we performed gene ontology (GO) analyses to evaluate
whether the differentially expressed phosphopeptides were enriched
in specific functional classes over the total phosphopeptides
d
c
mIMCD3 Tsc1/S6k1 dKO mIMCD3 Tsc1 KO mIMCD3 WT
Percentage of spheroids with polarized cilium
mIMCD3 Tsc1/S6k1 dKO mIMCD3 Tsc1 KO mIMCD3 WT DAPI Arl13b γ-tubulin
a
b
DAPI γ-tubulin mIMCD3 Tsc1/S6k1 dKO mIMCD3 Tsc1 KO mIMCD3 WT mIMCD3 Tsc1/S6k1 dKO mIMCD3 Tsc1 KO mIMCD3 WT Spindle angle α (°) 90 10 μm 80 70 60 50 40 30 20 10 0 ** *** 60 40 20 0 Anaphase Metaphase α *** ***Fig. 4 Hyperactive S6K1 affects spindle orientation in sphere assays in vitro. a Representative images of 5-day mIMCD3s spheres immunolabeled with γ-Tubulin, Arl13b, and DAPI to quantify spheres with polarized centrosomes and primary cilia. Only spheres with a visible lumen and with all the
centrosomes and primary cilia correctly localized on the luminal (apical) side were considered as normal. Scale bar, 10µm. b Quantification of the
percentage of spheres with polarized primary cilia on total number of spheres per genotype. The ratio was calculated on n = 70 spheres per experiment.
The histograms are an average of three independent experiments. Mean ± SEM.c Representative images of 5-day mIMCD3s spheres immunolabeled with
γ-tubulin and DAPI to measure spindle orientation. Yellow dotted lines indicate the spindle vectors, solid lines indicate the radius. Scale bar, 10 µm.
d Quantification of spindle angles relative to the apical-basal axis in 5-day spheres. Each dot represents a mitotic event, three independent experiments
detected in each screen. The AGC-motif screen did not show any
significant classes due to the limited set of detected peptides.
However, the IMAC screen revealed that GO terms for actin
binding, cell junctions, cytoskeleton, and alternative splicing were
significantly overrepresented in the differentially expressed
phosphopeptides (Supplementary Table 3). To select putative
direct substrates of S6K1, we focused on phosphopeptides in both
screens that were down-regulated in Tsc1/S6k1-deficient cells and
contained an AGC-motif (Fig.
6
a, b, Supplementary Table 4).
Among the proteins with a function in the regulation of oriented
cell division were the following: Afadin, an actin binding and
adapter protein regulating the nectin and cadherin adhesion
systems
42; slingshot protein phosphatase 1 (SSH1), phosphatase
for the actin depolymerase cofilin
43; microtubule actin
cross-linking factor 1 (Macf1), spectraplakin binding actin and
microtubules
44; phosphatidylinositol 4-Kinase
α (PI4K),
regulat-ing endocytic traffickregulat-ing
45; myosin phosphatase-targeting subunit
1 and 2 (MyPT1 and MyPT2), myosin phosphatases regulating
actomyosin contractility
46; missing in metastasis protein (Mtss1),
cortactin-interacting protein
47.
Afadin emerged as a prime candidate for validation, as
loss-of-function mutants in a kidney tubular cell line displayed defects in
sphere formation and oriented cell division
48. Moreover, Afadin
is a known component of cell–cell junctions, potentially coupling
intercellular adhesions and cortical cues to spindle orientation.
Antibodies recognizing the S6K1-dependent phospho-S1795 site
of Afadin are commercially available, allowing site-specific
validation of the LC-MS/MS data. Phospho-Afadin levels were
increased in Tsc1-deficient mIMCD3 cells, while the levels in
Tsc1/S6k1-deficient cells were comparable to wild type (Fig.
7
a,
b). In addition, pharmacological inhibition of mTORC1 by
rapamycin and of S6K1 by LY-2779964 and PF-4708671
decreased Afadin phosphorylation in Tsc1-deficient cells after a
2-h treatment. The regulation of Afadin phosphorylation by Tsc1
and S6k1 was also confirmed in knock-out mouse kidney extracts
(Fig.
7
c, d). Next, Afadin phosphorylation was assessed in human
DA
PI
γ-tubulin
Par3
a
mIMCD3 WT mIMCD3 Tsc1 KO mIMCD3 Tsc1/S6k1 dKOmIMCD3 Tsc1/S6k1 dKO mIMCD3 Tsc1 KO mIMCD3 WT DA PI A rl1 3b aPKC
b
c
d
100 80 60 40 20 0 A n gl e of mitosis α (°) mIMCD3 Tsc1 KO mIMCD3 WT 0′ 20′ 30′ a b mIMCD3 Tsc1 KO mIMCD3 WT 0′ 20′ 30′ a ′ ′b nsFig. 5 Misoriented cell division and centrosome position inTsc1 mutant cells is not due to intrinsic defects. a Representative images of 5-day mIMCD3s
spheres immunolabelled withγ-tubulin, Par3 and DAPI to show the localization of the centrosomes compared to the apical markers. Scale bar, 10 µm.
b Representative images of 5-day mIMCD3s spheres immunolabelled with Arl13b, aPKC, and DAPI to show the localization of the primary cilia compared
to the apical markers. Scale bar, 5µm. c Representative images of cells cultured on L shape patterns and recorded by time-lapse microscopy for the
different genotypes. Scale bar, 20µm. d Distribution of mitotic spindle angles relative to pattern orientation (αb−αa) at anaphase onset. An average of 120
angles from three independent experiments were quantified for each genotype. Horizontal lines represent the mean ± SEM. Source data are provided as a
kidney surgical samples from TSC patients and non-TSC patients
(Fig.
7
e). Whenever possible, tumor samples (t) were compared to
adjacent normal tissue (n). The kidney tumors from TSC patients
were hybrid oncocytic-chromophobe renal cell carcinomas
(patients #1 and 2) or angiomyolipomas (patients #3 and 4).
The non-TSC patient samples were cystic nephromas (patient
#5), oncocytomas (patient #6), clear cell renal carcinomas
(patients #7 and 8), or well-differentiated liposarcomas (patient
#10). Of note, Afadin phosphorylation was significantly increased
in TSC patients, suggesting a clinical relevance of the
findings in
cellular and mouse models.
To demonstrate whether S6K1 could directly phosphorylate
Afadin, Tsc1/S6k1-deficient cells were transfected with a
point-mutant of S6K1 conferring sensitivity to bulky ATP-analogs
49.
The analog-sensitive S6K1 was able to thio-phosphorylate Afadin
in a rapamycin-sensitive manner (Fig.
7
g), demonstrating that
Afadin is a direct S6K1 substrate. Since we observed that total
Afadin levels correlated with the extent of phosphorylation
(Fig.
7
a, c), we asked whether its phosphorylation state affected
protein stability, as previously proposed
50. Cycloheximide
treat-ment suggested that the half-life of Afadin was longer in
Tsc1-versus Tsc1/S6k1-deficient cells, correlating with phosphorylation
status (Supplementary Fig. 10a, b). In addition, mRNA levels of
Afadin correlated with the activation of the mTORC1/S6K1
pathway (Supplementary Fig. 10c), indicating the control of
Afadin expression at different levels, precluding a clear-cut
determination of the effects on protein stability.
To investigate its functional role, Afadin expression was
disrupted using CRISPR-Cas9 in both wild-type and
Tsc1-deficient mIMCD3 cells, followed by lentiviral transduction of
wild-type (wt) Afadin, serine-to-alanine-1795 phospho-deficient
mutant (S1795A) or vector control (Supplementary Fig. 11a).
Both Afadin constructs were expressed similarly, below
endo-genous levels, and correctly localized at the membrane
(Supple-mentary Fig. 11b). Afadin knock-out and Afadin/Tsc1 double
knock-out cells had impaired formation of polarized spheres
(Fig.
8
a, b, and Supplementary Fig. 11c). Re-expression of
WT-Afadin and S1795A-WT-Afadin induced comparable rescue of sphere
formation in Afadin knock-out cells (Supplementary Fig. 11c),
likely because in the WT background, Afadin is not
hyperpho-sphorylated. However, in the Tsc1/Afadin double knock-out cells,
only the S1795A-Afadin phospho-mutant could partially rescue
the ability to form polarized spheres (Fig.
8
a, b). This
demonstrates that aberrant Afadin phosphorylation by S6K1
hyperactivation in Tsc1 mutants is partly responsible for the OCD
defect. In addition, the serine-to-glutamate-1795
phosphomi-metic (S1795E) mutant was introduced in wild-type cells to ask
whether this mutation was sufficient to alter sphere formation. Of
note, both the deficient (S1795A) and the
phospho-mimetic (S1795E) mutants were expressed at comparable levels
(Supplementary Fig. 11b), but the phospho-mimetic led to
disturbances in cellular adhesion, as indicated by formation of
thinner and less regular Afadin-junctions (Supplementary Fig. 11f,
g). Moreover, the ability to form spheres with polarized cilium
a
b
c
IMAC volcano plot
Tsc1/S6k1 dKO vs. Tsc1 KO AGC-motif volcano plot
Tsc1/S6k1 dKO vs. Tsc1 KO CAD 1859 BAD 112 RICTOR 1135 p70S6K 427 ACF7 3082, 3085 DNAJC2 47,49 Afadin 1795 2035 1932 Upregulated Peptides Downregulated Peptides 5 BAD 136 DNAJC2 47, 48 RICTOR 1135 ACF7 1376 Afadin 1795 S6 235, 236, 240, 241 MYPT1 508, 509 266 150 Upregulated Peptides Downregulated Peptides 4 3 (–)LogP (–)LogP 2 1 0 0 2 4 Actin-binding Cell junction Cytoskeleton Alternative splicing GO:0003779~actin binding GO:0030054~Cell junction GO:0005856~Cytoskeleton
0.00 0.50 1.00 Ontology fold enrichment
1.50 2.00 p Value 5.04E–04 1.94E–04 1.25E–04 3.10E–05 3.09E–05 2.90E–04 9.50E–05 –6 –3 –5 0 5
Log2 fold change Log2 fold change
0 3
Fig. 6 Phosphoproteomic screening ofTsc1 single knockout versus Tsc1/S6k1 double knockout cells. a Volcano plots of AGC kinase-motif antibody
enrichment andb IMAC enrichment. The x-axis shows log2-ratio for phosphopeptides between samples and the y-axis shows the −log10 p-value. The
horizontal blue bar represents the statistical cut-off of significance (p value of 0.05). Red dots represent downregulated phospho-peptides in the Tsc1/S6k1 double knock-out genotype and green dots represent up-regulated phospho-peptides. Afadin phospho-peptide is represented in yellow. The numbers in the
chart represent the number of statistically significant differentially enriched peptides. Representative peptides and their sites of modification are shown.
c Gene ontology analysis, using DAVID, showing statistically significant gene set enrichments comparing the IMAC statistically significant differentially
was reduced in cells expressing S1795E-Afadin (Fig.
8
c, d). These
data suggest that Afadin phosphorylation impairs the adhesion
system leading to defects in oriented cell division.
Therefore, Afadin localization was determined in mitotic cells
during sphere formation. E-Cadherin-based adhesions are the
main found in tubular cells. As Afadin is involved in their
regulation
51, the relative localization of the two proteins was
assessed by immunofluorescence. γ-Tubulin was used to
determine the spindle poles in mitotic cells. In wild-type cells,
Afadin was mainly at adherens junctions (AJ) in the two
apicolateral domains of both mitotic and interphase cells (Fig.
9
a
and insets). The tight-junction protein ZO-1 was also localized at
the apicolateral domains (Supplementary Fig. 12a). In
Tsc1-mutant cells, Afadin staining was more abundant and diffuse
a
b
* WT Tsc1 KO Tsc1/S6k1 dKO Tsc1 KO + 20nM Rapa Tsc1 KO + 1 μ M LY25 Tsc1 KO + 10 μ M PF47 AFADIN pCADS1859 pAKTS473 pS6KT389 ACTIN 4E-BP1 pAFADINS1795 pRPS6S240–244 Ksp-Cre; Tsc1 f/f Tsc1 f/f; S6k1 –/– Tsc1 f/f Ksp-Cre; Tsc1 f/f; S6k1 –/–Relative phospho afadin
levels/ACTIN 5 4 3 2 1 0
c
ACTIN AFADIN pAFADINS1795 * * WT Tsc1 KO Tsc1/S6k1 dKO Tsc1 KO + 20nM Rapa Tsc1 KO + 1μM LY25 Tsc1 KO + 10μM PF47Relative phospho afadin
levels/ACTIN 4 3 2 1 0 ** **
d
g
FLAG WB:FLAG WB:Thiophospho Short exposure Cell lysate IP:FLAG IMCDs Tsc1/S6k1 dKO AS-S6K1 + + AFADIN WT-FLAG Rapamycin 20nM – + + + pAFADINS1795 AFADIN pRPS6S240–244 ACTIN WB:Thiophospho Long exposure AFADINS1795 RPS6S240–244 ACTIN TSC1 AFADIN AKTS407 t n t t t t n t t n n n TSC patients Non-TSC patientsPatient #1 Patient #1 Patient #2 Patient #3 Patient #4 Patient #5 Patient #5 Patient #6 Patient #7 Patient #7 Patient #8 Patient #9
Sample type
e
f
* * ** **Relative protein levels
15 10 5 0 pAFADIN S1795 /AFADINTSC1/ACTIN pAFADIN S1795 /ACTIN pRPS6 S240–244 /ACTIN TSC patients non-TSC patients –70 kDa –65 kDa –250 kDa –250 kDa –250 kDa –32 kDa –20 kDa –44 kDa –250 kDa Tsc1 f/f Tsc1 f/f; S6k1–/– Ksp-Cre; Tsc1 f/f Ksp-Cre; Tsc1 f/f; S6k1–/– –250 kDa –44 kDa –250 kDa –44 kDa –250 kDa –150 kDa –65 kDa –32 kDa –250 kDa –250 kDa –250 kDa –250 kDa –250 kDa –250 kDa –44 kDa –32 kDa
Fig. 7 Afadin is phosphorylated by S6K1 inTsc1-mutant conditions. a Cells were serum starved overnight and subsequently amino acid starved with EBSS (Earle’s Balanced Salt Solution) for 1.5 h with or without the indicated treatments. They were then collected and cell lysates were probed with the indicated
antibodies. Asterisk represents non-specific cross-reactive bands. b Densitometry analysis and relative quantification of the phosphorylated forms of the
indicated proteins. Actin was used as a loading control. Mean ± SEM. n = 4 independent experiments were analyzed. c Western blots of mouse
whole-kidney extracts at pre-cystic age (post-natal day 20), randomly fed, and probed with the indicated antibodies.d Densitometry analysis and relative
quantification of the phosphorylated form of Afadin. Actin was used as a loading control. Mean ± SEM. n = 3 Tsc1 f/f, n = 3 Tsc1 f/f; S6k1 −/−, n = 4
Ksp-Cre; Tsc1 f/f, and n = 4 Ksp-Ksp-Cre; Tsc1 f/f; S6k1 −/− mice were analyzed. e Western blot of protein lysates extracted from patient samples. Renal tumors (t) or normal tissue adjacent to renal tumor (n) were collected from TSC patients and non-TSC patients. Protein lysates then probed with the indicated
antibodies.f Densitometry analysis and fold change of TSC patients over non-TSC patients of the indicated proteins relative to the indicated loading
control. Mean ± SEM. n = 5 TSC patients, n = 7 non-TSC patients were analyzed. g Analog-sensitive S6K1 was co-transfected in Tsc1/S6k1 dKO mIMCD3
cells with FLAG-Afadin-WT. An in vivo kinase assay was performed in the presence of 6‐Bn‐ATP‐γ‐S both in presence and in absence of 20 nM rapamycin.
After immunoprecipitation using an anti-FLAG antibody, the thio-phosphorylation of Afadin was revealed by western blot using an anti‐thiophosphate ester
antibody. Expression levels of Afadin, phospho-S1795-Afadin, FLAG and phospho-RPS6 were revealed by western blot on total extracts using the indicated
antibody. Source data are provided as a Source Datafile.
a
b
NEON-FLAG AFADIN WT-FLAG AFADIN S1795A-FLAG DAPI Arl13b γ-tubulin Tsc1/Afdn dKOc
NEON-FLAG AFADIN S1795A-FLAG AFADIN S1795E-FLAG mIMCD WT DAPI Arl13b γ-tubulin mIMCD WTPercentage of spheroid with polarized cilium
NEON-FLAG AFADIN S1795A-FLAG AFADIN S1795E-FLAG
d
Percentage of spheroid with polarized cilium
Tsc1/Afdn dKO
Tsc1/Afdn dKO + LV-NEON-FLAG Tsc1/Afdn dKO + LV-AFADIN WT-FLAG Tsc1/Afdn dKO + LV-AFADIN S1795A-FLAG WT IMCDs 0 10 20 30 40 50 60 * * * * * * * 0 10 20 30 40 50 60 70 80 *
Fig. 8 Effects of Afadin phospho-mutants on sphere formation. a Representative images of 5-day spheres from cells Tsc1/Afdn dKO transduced with
lentivirus FLAG-Neon, FLAG-Afadin-WT, or FLAG-Afadin-S1795A. Afterfixation, spheres were immunolabeled with γ-Tubulin, Arl13b, and DAPI to
quantify spheres with polarized centrosomes and primary cilia. Scale bar, 10µm. b Quantification of the percentage of spheres with polarized primary cilia
on total number of spheres from cells WT and Tsc1/Afdn dKO transduced with lentivirus FLAG-Neon, FLAG-Afadin-WT, or FLAG-Afadin-S1795A. The ratio was calculated on n = 70 spheres per experiment per each genotype. The histograms are an average of six independent experiments (for WT n = 3
independent experiments). Mean ± SEM.c Representative images of 5-day spheres from WT mIMCD cells transduced with lentivirus Neon,
FLAG-Afadin-S1795A (phospho-deficient) or FLAG-Afadin-S1795E (acidic phospho-mimetic). After fixation, spheres were immunolabeled with γ-Tubulin, Arl13b
and DAPI to quantify spheres with polarized centrosomes and primary cilia. Scale bar, 10µm. d Quantification of the percentage of spheres with polarized
primary cilia on total number of spheres per genotype from WT mIMCD cells transduced with lentivirus Neon, Afadin-S1795A, or FLAG-Afadin-S1795E. The ratio was calculated on n = 70 spheres per experiment per each genotype. The histograms are an average of three independent
throughout the whole apical domain (Fig.
9
a and Supplementary
Fig. 12a). During mitosis of wild type and Tsc1/S6k1-mutant cells,
the two Afadin spots at the AJs were found at opposite sides of
the spindle equator, each one close to one spindle pole (Fig.
9
a,
b). However, in the majority of Tsc1 mutant cells, the Afadin
spots were on the same side of the spindle equator, close to a
single pole, and in other mitotic events, it was impossible to
distinguish two spots, but rather a localization throughout the
whole apical domain. E-Cadherin was mainly basolateral in wild
type and Tsc1/S6k1-mutant cells during interphase and mitosis
(Fig.
9
a). Strikingly, in Tsc1-mutant cells, E-Cadherin was
aberrantly found at the apico-lateral domain (Fig.
9
a and
Supplementary Fig. 12b, c). Additional components of the
Cadherin adhesion system, including
α-catenin, β-catenin, and
a
b
150 100 50 0 WT Tsc1 KO Tsc1/S6k1 dKO Percentage of mitosisAFADIN spot close to a single pole One AFADIN spot close to each pole
* * mIMCD3 Tsc1/S6k1 DKO mIMCD3 Tsc1 KO mIMCD3 WT
c
mIMCD3 Tsc1/S6 k 1 DKO mIMCD3 Tsc1 KO mIMCD3 WT α-CATENIN ZO-1 MERGEe
MERGE + γ-TUBULIN INSET E-CA DHERIN A F A DIN KspCre +/–; Tsc1 f/f; S6k1 –/– KspCre +/–; Tsc1 f/f Tsc1 f/f KspCre +/–; Tsc1 f/f; S6k1 –/– KspCre +/–; Tsc1 f/f Tsc1 f/f A F A DIN MERGEd
DA PI ZO-1 α -CA TENINthe polarity protein Scribble, also displayed apical localization
instead of baso-lateral in Tsc1 mutants (Fig.
9
c and
Supplemen-tary Figs. 12b and 13a, b). Importantly, Afadin and
α-catenin also
decorated the apical surface in Tsc1-mutant kidneys at pre-cystic
stage (Fig.
9
d, e). These data suggest that mTOR/S6K1
hyperactivity alters spindle orientation relative to
Afadin-positive AJs and this correlates with a modification of the
cadherin-based adhesion system.
Discussion
Polycystic kidney is a common pathological consequence of
hyperactive mTORC1, as observed in TSC and additional
inherited diseases
2–5. Here we identify S6K1 as a direct
mTORC1 substrate required for cyst formation. S6K1 deletion
affects the orientation but not the rate of cell division in TSC
mutant mice, thus disconnecting the need for these two cell cycle
alterations at the origin of polycystic kidneys. Centrosome
mis-positioning in mitotic Tsc1-mutant cells accompanies the defect
in oriented cell division, as observed in Matrigel-embedded
cul-tures, where cells rely on cell-junctions to position the
centro-some. Performing an unbiased and comprehensive
S6K1-phosphoproteome in the TSC background, we highlight that
peptides whose phosphorylation is S6K1-dependent, are mainly
regulators of intercellular junctions and actomyosin cortex.
Among them, Afadin is a direct S6K1 substrate involved in the
control of oriented cell division, possibly by coupling intercellular
adhesions and cortical cues to the mitotic spindle.
An increasing list of mTORC1 targets has been implicated in
the physiological responses of macromolecule biosynthesis and
autophagy control. However, the molecular effectors of aberrant
mTORC1 signaling remain uncharacterized. Here we address a
pathway affecting OCD, by showing in vivo and in 3D cultures
the involvement of S6K1. Interfering with other major outputs of
mTORC1 activity, such as autophagy and cap-dependent
trans-lation, does not seem to affect cyst formation. Autophagy mutants
and 4E-BP1/4E-BP2-deficient mice do not recapitulate a
poly-cystic kidney phenotype
52,53. We can speculate that the
S6K1-dependent phosphoproteome orchestrates a pleiotropic response
required for the intense tissue remodeling in polycystic kidneys.
S6K1 is known to regulate proteins involved in protein and
nucleotide synthesis, folding, RNA splicing, and insulin
sensi-tivity. Interestingly, our MS data also suggest the existence of a
class of S6K1 substrates with a role in intercellular adhesion and
regulation of the actomyosin cortex. Taking advantage of Afadin
phospho-specific antibodies and mutant cells, we demonstrated
that Afadin is a direct S6K1 substrate participating in OCD
control.
Afadin is a 200-kDa adapter protein that stabilizes adherens
junctions (AJs), by interacting with both the nectin and
E-cadherin adhesion systems
42. The Afadin PDZ domain directly
binds and crosslinks the intracellular domain of Nectin to the
actomyosin cortex. In addition, Afadin strengthens the
associa-tion between p120-catenin and cadherin, thus inhibiting
E-cadherin endocytosis
51. The localization of Afadin at the cellular
cortex also plays an important role during cell division. In
epi-thelial cells, its accumulation at the AJs provides a cue for the
orientation of the spindle poles at the lateral cortex during
mitosis. Mechanistically, Afadin can interact with LGN, which in
complex with NuMA recruits the motor protein dynein to pull
the astral microtubules
54. Consistently, Afadin-deficient renal
tubular cells have misoriented cell division
48.
A previous study has revealed that in breast cancer cells, Afadin
phosphorylation by Akt promotes Afadin stability and cell
migration
50. In addition, Afadin knock-down experiments have
demonstrated that one of its functions is the commitment of cells
to adhere or migrate
50,55. In the present study, we show that the
Afadin phosphomimetic mutant alters the cell–cell junctions
while Afadin phosphorylation in TSC-mutant kidney cells is
accompanied by a striking alteration of the E-cadherin adhesion
system, which becomes localized at the apical surface. It is
tempting to speculate that Afadin phosphorylation may somehow
represent a switch between migration and adhesion, perhaps by
tuning the interaction between the Nectin/Afadin-Cadherin/
Catenin systems. TSC mutations have been previously shown to
result in alterations of both cell–matrix and cell–cell adhesion
systems. TSC1 inactivation in cell lines leads to a reduction of
focal cell–matrix adhesion, while TSC1 overexpression increases
focal adhesion and actin stress
fibers through ezrin and Rho
signaling
56. Similarly, TSC2 overexpression activates cell
attach-ment and reduces chemotactic cell migration
57. Cell lines from
Eker TSC2 mutant rats display intracellular E-cadherin retention
in the Golgi apparatus, increased invasion and ability to grow in
suspension
58–60. However, these studies did not reveal the
underlying direct mTORC1-dependent mechanism. Our data
open a new perspective, indicating that the deregulation of the
mTORC1-S6K1-Afadin axis may contribute to cystogenesis by
altering the adhesion and spindle orientation program.
OCD has been proposed to regulate kidney tubule
morpho-genesis, and its disruption has been associated with development
of polycystic kidney disease (PKD)
29–31,61–64. However, more
recently it has been suggested that OCD disruption may not
necessarily lead to cyst formation
33,34. Our results reconcile these
apparent contrasting
findings. Taking advantage of a unique
system, we could separate cystogenesis into its two crucial
com-ponents. Our results show that the inactivation of Tsc1 leads to
both hyper-proliferation and loss of OCD that, together, lead to
the onset of a cystic kidney phenotype. Here we demonstrate that
the concomitant loss of S6K1 prevents the impairment of OCD
without affecting the cell proliferation. Remarkably, in this
set-ting, the preservation of OCD combined with hyper proliferation
Fig. 9Tsc1-deficient spheres display altered Afadin/Cadherin-based adhesion system localization. a Representative images of 5-day mIMCD3s spheres
of the indicated genotypes immunolabelled with Afadin (red), E-cadherin (green),γ-Tubulin (magenta) antibodies, and DAPI to show the relative
localization of Afadin and E-cadherin in interphase and relative to the mitotic spindle poles in 3D spheroids. Insets show higher magnification of one mitotic cell per genotype, to show the relative localization of Afadin and E-cadherin in mitotic cells. In the insets, yellow arrows indicate the localization of the Afadin spots. White arrows indicate localization of the poles of the mitotic spindles. A dotted yellow line indicates Afadin staining in the whole apical
domain of mitotic cells. Scale bar, 10µm. b Percentage of mitosis showing one Afadin spot adjacent to each spindle pole (white), or perturbed afadin
localization adjacent to a single spindle pole (dark gray). An average of 10 mitosis were analyzed per experiment per each genotype. The histograms are an
average of three independent experiments. Mean ± SEM.c Representative images of 5-day mIMCD3s spheres of the indicated genotypes immunolabelled
withα-catenin, ZO-1 and DAPI to show the loss of baso-lateral presence of α-catenin in the Tsc1 KO, with a concomitant appearance of an apical
mislocalization relative to the apico-lateral marker ZO-1. Scale bar, 10µm. d Representative pictures of pre-cystic post-natal day 20 mice, immunolabelled
with Afadin antibody to show the localization of the protein in the indicated genotypes. Scale bar, 10µm. e Representative pictures of pre-cystic post-natal
day 20 mice, immunolabelled withα-catenin, ZO-1 and DAPI to show the localization of the proteins in the indicated genotypes. Source data are provided