HAL Id: hal-00296313
https://hal.archives-ouvertes.fr/hal-00296313
Submitted on 20 Aug 2007
HAL is a multi-disciplinary open access
archive for the deposit and dissemination of
sci-entific research documents, whether they are
pub-lished or not. The documents may come from
teaching and research institutions in France or
abroad, or from public or private research centers.
L’archive ouverte pluridisciplinaire HAL, est
destinée au dépôt et à la diffusion de documents
scientifiques de niveau recherche, publiés ou non,
émanant des établissements d’enseignement et de
recherche français ou étrangers, des laboratoires
publics ou privés.
First direct observation of the atmospheric CO2
year-to-year increase from space
M. Buchwitz, O. Schneising, J. P. Burrows, H. Bovensmann, M. Reuter, J.
Notholt
To cite this version:
M. Buchwitz, O. Schneising, J. P. Burrows, H. Bovensmann, M. Reuter, et al.. First direct
observa-tion of the atmospheric CO2 year-to-year increase from space. Atmospheric Chemistry and Physics,
European Geosciences Union, 2007, 7 (16), pp.4249-4256. �hal-00296313�
www.atmos-chem-phys.net/7/4249/2007/ © Author(s) 2007. This work is licensed under a Creative Commons License.
Chemistry
and Physics
First direct observation of the atmospheric CO
2
year-to-year
increase from space
M. Buchwitz, O. Schneising, J. P. Burrows, H. Bovensmann, M. Reuter, and J. Notholt
Institute of Environmental Physics (IUP), University of Bremen FB1, Bremen, Germany Received: 13 April 2007 – Published in Atmos. Chem. Phys. Discuss.: 16 May 2007 Revised: 19 July 2007 – Accepted: 25 July 2007 – Published: 20 August 2007
Abstract. The reliable prediction of future atmospheric CO2 concentrations and associated global climate change requires an adequate understanding of the CO2sources and sinks. The sparseness of the existing surface measurement network lim-its current knowledge about the global distribution of CO2 surface fluxes. The retrieval of CO2 total vertical columns from satellite observations is predicted to improve this situ-ation. Such an application however requires very high accu-racy and precision. We report on retrievals of the column-averaged CO2 dry air mole fraction, denoted XCO2, from the near-infrared nadir spectral radiance and solar irradiance measurements of the SCIAMACHY satellite instrument be-tween 2003 and 2005. We focus on northern hemispheric large scale CO2features such as the CO2seasonal cycle and show - for the first time - that the atmospheric annual in-crease of CO2 can be directly observed using satellite mea-surements of the CO2total column. The satellite retrievals are compared with global XCO2obtained from NOAA’s CO2 assimilation system CarbonTracker taking into account the spatio-temporal sampling and altitude sensitivity of the satel-lite data. We show that the measured CO2 year-to-year in-crease agrees within about 1 ppm/year with CarbonTracker. We also show that the latitude dependent amplitude of the northern hemispheric CO2 seasonal cycle agrees with Car-bonTracker within about 2 ppm with the retrieved amplitude being systematically larger. The analysis demonstrates that it is possible using satellite measurements of the CO2 total column to retrieve information on the atmospheric CO2on the level of a few parts per million.
Correspondence to: M. Buchwitz
(michael.buchwitz@iup.physik.uni-bremen.de)
1 Introduction
Carbon dioxide (CO2) is the most important anthropogenic greenhouse gas. In spite of the ratification of the Kyoto Protocol, the release of CO2 is expected to continue to in-crease (IPCC, 2007). By using the very accurate and pre-cise but sparse surface CO2measurements of the surface net-works (e.g., the NOAA CMDL CCGG cooperative air sam-pling network, see www.esrl.noaa.gov/gmd/ccgg/), which comprises about 100 ground stations not equally distributed over the globe, inverse modeling has yielded surface fluxes of CO2 globally by a variety of approaches (Gurney et al., 2002; R¨odenbeck et al., 2003; Patra et al., 2006). These studies, which primarily used surface CO2data on a weekly basis, reveal that the inferred uncertainties of the CO2 sur-face fluxes at the continental and ocean basin scale depend on many factors such as the a-priori assumptions made about the distribution of the CO2fluxes and their assumed uncer-tainties. In addition, attempts have been made for selected regions to better constrain the regional fluxes using continu-ous high-frequency CO2in-situ observations (Derwent et al., 2002; Peylin et al., 2005). As pointed out by Peylin et al. (2005) these regional results also depend critically on sev-eral assumptions related to the required smoothness, the ini-tial conditions, and the global flux field. Synthetic inverse modeling studies have suggested that satellite measurements of the column-averaged CO2dry air mole fraction, XCO2, as possible using nadir measurements in the near-infrared spec-tral region, have the potential to significantly improve the determination of source/sink distributions of CO2 (Rayner and O’Brien, 2001; Houweling et al., 2004). This results primarily from the large amounts of data that satellites pro-duce, but also because nadir satellite remote sensing mea-surements in the near-infrared spectral region can observe the CO2molecules in the entire air column. As a result ver-tical transport modeling errors are less criver-tical compared to inversions based on in-situ observations only.
4250 M. Buchwitz et al.: First direct observation of CO2increase from space
SCIAMACHY on ENVISAT (Burrows et al., 1995; Bovensmann et al., 1999) is the first satellite instrument, which makes the necessary observation of CO2 and O2 ab-sorptions in the back scattered solar near-infrared (NIR) spectral regions (Buchwitz et al., 2005a,b, 2006). Accord-ing to Rayner and O’Brien (2001) the precision, or random error, of the satellite measured XCO2is required to be less than approximately 2.5 ppm (0.7% of 375 ppm) for monthly averages and 8◦×10◦regions to constrain the CO2fluxes bet-ter than the surface network. Even more critical than random errors are potential systematic errors, as even a systematic er-ror of less than 1 ppm between regions may be misinterpreted as a significant CO2source or sink (Chevallier et al., 2007; Miller et al., 2007). For the near future dedicated greenhouse gas satellite missions are planned, most notably OCO (Crisp et al., 2004) and GOSAT (Hamazaki et al., 2004), which will also perform passive nadir observations in the near-infrared spectral region but optimized for CO2in terms of, e.g., bet-ter spectral and spatial resolution. For GOSAT the required relative accuracy for sub-continental spatial resolution and 3-month XCO2 averages is 1% or 4 ppm (Hamazaki et al., 2004).
Here we present three years (2003-2005) of SCIA-MACHY XCO2 retrievals. The XCO2 has been retrieved using the latest version of our retrieval algorithm WFM-DOAS (version 1.0). Details about the algorithm are given in Schneising et al. (2007)1. Here we present a first discus-sion of the new multi year XCO2data set focusing on large scale CO2features over the northern hemisphere. We demon-strate, for the first time, that the about 1–3 ppm/year increase of the atmospheric CO2, which primarily results from the burning of fossil fuels, can be directly observed from space. Indirectly, it been shown earlier by Aumann et al. (2005) that satellite measurements are sensitive enough to detect the CO2increase from space by analyzing AIRS middle to upper tropospheric temperature retrievals based on observations of the 4.3 micron CO2 band. In that study it has been found that the retrieved temperature shows a decreasing trend be-cause of the upward shift of the AIRS weighting functions with increasing CO2, thereby sampling colder parts of the troposphere (because of the negative lapse rate) when CO2 increases.
This paper is structured as follows: Sect. 2 gives a short overview about the SCIAMACHY satellite instrument. Sec-tion 3 introduces the XCO2retrieval algorithm. As not all the satellite XCO2measurements are useful, for example, due to clouds, the satellite retrieved XCO2must be filtered. This is described in Sect. 4. The main section of this paper is Sect. 5 where the XCO2data set is presented and discussed. Final conclusions are given in Sect. 6.
1Schneising, O., Buchwitz, M., Burrows, J. P., et al.: Three years
of greenhouse gas column-averaged dry air mole fractions retrieved from satellite – Part 1: Carbon dioxide, in preparation, 2007.
2 SCIAMACHY
The SCIAMACHY project (Burrows et al., 1995; Bovens-mann et al., 1999) was intitiated in 1988 and is a German, Dutch and Belgian contribution to the ESA ENVISAT, which flies in a sun-synchronous orbit in descending node, cross-ing the equator at 10:00 a.m. local time. The SCIAMACHY instrument is a grating spectrometer, which measures so-lar radiation, reflected at the Earth’s surface, backscattered from the atmosphere, transmitted through the atmosphere, or emitted from the atmosphere in the ultraviolet, visible, and NIR spectral regions (240–1750 nm, 1940–2040 nm, 2265–2380 nm) at moderate spectral resolution (0.2–1.4 nm). SCIAMACHY observes the Earth’s atmosphere in various viewing geometries. Of relevance for this study is the nadir viewing mode (down-looking) and the 1558–1594 nm and 755–775 nm spectral regions containing molecular CO2and oxygen (O2) absorption lines. The column-averaged dry air mole fraction of CO2, XCO2, is calculated from the retrieved columns of CO2and O2(Buchwitz et al., 2005a). The hor-izontal resolution, i.e., the size of a single ground pixel, is typically 30 km along track (approximately north-south) and 60 km across track (approximately east-west). On the Earth’s day side an alternating sequence of nadir and limb measure-ments is performed. Full longitudinal (global) coverage in nadir is achieved at the equator in six days and more rapidly at higher latitudes. As shown in Buchwitz et al. (2005a), the sensitivity of the SCIAMACHY CO2measurements is only weakly dependent on altitude throughout the troposphere and down to the Earth’s surface. The latter is a pre-requisite to obtain regional CO2 source/sink information, which is the main scientific goal of the SCIAMACHY CO2 measure-ments.
3 SCIAMACHY XCO2retrieval algorithm
Different groups have developed different algorithms to re-trieve CO2columns or XCO2from the SCIAMACHY nadir spectra (e.g., Houweling et al. (2005); Barkley et al. (2006, 2007); B¨osch et al. (2006)). We use the Weighting Func-tion Modified Differential Optical AbsorpFunc-tion Spectroscopy (WFM-DOAS) method to retrieve the XCO2 from SCIA-MACHY as described in detail elsewhere (Buchwitz et al., 2000, 2005a,b, 2006). In short, WFM-DOAS is a least-squares method based fitting a linearized radiative transfer model plus a low-order polynomial to the logarithm of the measured sun-normalized radiance. The low order polyno-mial is included in the fit to account for not well known, ide-ally multiplicative, low frequency spectral radiance modula-tions, arising from residual radiometric calibration errors or (to first order, depending on optical thickness) radiance vari-ability due to aerosols, residual clouds, and the surface spec-tral reflectivity. The fit parameters for the trace gases yield directly the vertical columns. The WFM-DOAS reference
spectra are the logarithm of the sun-normalized radiance and its derivatives, computed with a radiative transfer model tak-ing into account multiple scattertak-ing.
The CO2column fit parameter is the relative deviation of the CO2 vertical column from the atmospheric model ver-tical column assumed for the radiative transfer simulations. The assumed CO2 vertical mixing ratio profile is constant (370 ppm) and this profile is converted to number density and scaled during the fitting procedure without changing the profile shape. For the results presented here it is important to point out that the retrieval algorithm has no knowledge about CO2variations in time and space. In order to convert the retrieved absolute CO2 vertical column into XCO2, the CO2column has to be divided by the corresponding dry air column. We obtain the dry air column using simultaneous measurements of molecular oxygen (O2), assuming a con-stant mixing ratio of O2 (0.2095). The CO2 column is re-trieved from the spectral region 1558–1594 nm located in the NIR part of the electromagnetic spectrum (sometimes also referred to as SWIR (shortwave infrared); note that this pa-per does not discriminate between NIR and SWIR), and the O2column is retrieved from the spectral region 755–775 nm (O2A-band).
The satellite XCO2 year 2003–2005 data set presented here has been obtained with an improved version (version 1.0) of our retrieval algorithm WFM-DOAS (WFMDv1.0) (Schneising et al., 20071). As will be shown in Schneis-ing et al. (2007)1the main problems of the previous version WFMDv0.4 (Buchwitz et al., 2005a,b) have been solved by using better calibrated spectra (WFMDv1.0 uses the oper-ational Level 1 version 5 data product instead of the pre-vious Level 1 version 4 data product which has been used for WFMDv0.4; the Level 1 data product is the geolo-cated and spectrally and radiometrically calibrated (earth-shine) spectral radiance and solar irradiance), a better consid-eration of surface spectral reflectivity variability, improved spectroscopic line parameters (HITRAN 2004 (Rothman et al., 2005) instead of HITRAN 2000/2001 (Rothman et al., 2003)), and by the implementation of several minor improve-ments. This resulted in higher accuracy of the retrieved XCO2. For example, it is no longer required to apply a quite large empirical scaling factor as was necessary for WFMDv0.4 XCO2.
4 Quality filtering of the SCIAMACHY XCO2
Because of the demanding requirements on accuracy and pre-cision, we have applied a stringent quality filter to the data shown here. As a result of this filtering, many measurements are currently rejected. The filtering (see below) removes most of the measurements at high latitudes and over the southern hemisphere, because the analysis of SCIAMACHY XCO2is restricted to cloud free and snow and ice free land surfaces. In this study we focus on northern hemispheric low
and mid latitudes. For the future we will aim at further im-proving the retrieval algorithm to be able to relax the quality filtering in order to extend the XCO2data set.
The quality filtering approach is described in detail in Schneising et al. (2007)1. Here we restrict the description to a short overview. Quality flags marking successful measure-ments are set for each observed ground scene. For cloud de-tection, the measured oxygen columns and the sub-scene in-formation provided by the SCIAMACHY Polarization Mea-surement Devices (PMDs) are used. A ground pixel is classi-fied sufficiently cloud free if both, the PMD and the oxygen measurements indicate a cloud free pixel. In contrast to the oxygen measurements, the PMD threshold algorithm (Buch-witz et al., 2005a) can not not discriminate between clouds and snow or ice covered surfaces and therefore also rejects most of the measurements over snow or ice covered sur-faces (snow and ice have low reflectivity in the near-infrared spectral region, therefore this results in the rejection of mea-surements with typically lower quality compared to typical snow and ice free land surfaces). With the exception of sun-glint conditions, water has a much lower surface spec-tral reflectance in the NIR specspec-tral region than typical land surfaces, resulting in low signal-to-noise ratios of the SCIA-MACHY nadir measurements in the NIR spectral region. Be-cause of the lower quality of the CO2 measurements over water, the analysis presented here is restricted to measure-ments over land. In addition, several criteria are employed to ensure a high significance and quality of the spectral fits. As the maximum ground altitude (pressure) currently con-sidered for WFM-DOAS radiative transfer simulations of the nadir spectra is 4 km, we have also filtered out scenes corre-sponding to a surface elevation larger than 4.1 km. To reject ground scenes with strong aerosol contamination we have additionally filtered the SCIAMACHY XCO2measurements using NASA’s Absorbing Aerosol Index (AAI) data product (Herman et al., 1997) from TOMS/Earthprobe.
5 Discussion of the XCO2data set
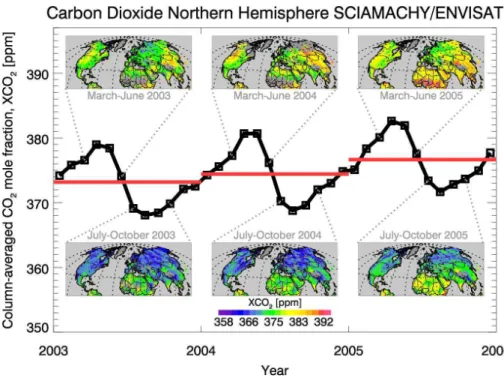
Figure 1 provides an overview about the northern hemi-spheric XCO2satellite data set. Shown are northern hemi-spheric monthly averages (square symbols) and annual aver-ages (red horizontal lines). Clearly visible is the CO2 year-to-year increase and the northern hemispheric seasonal cycle of CO2, i.e., the regular once per year up and down of the at-mospheric CO2due to uptake and release of CO2(primarily) by the terrestrial biosphere. Shown are also northern hemi-spheric maps obtained by sampling the seasonal cycle during its XCO2maximum and minimum time periods during the years 2003–2005. As can be seen, the satellite XCO2data set has spatial data gaps which change with time. They pri-marily result from the applied quality filter which may reject many measurements over extended areas for long time peri-ods for example in case of significant aerosol contamination
4252 M. Buchwitz et al.: First direct observation of CO2increase from space
Fig. 1. Atmospheric CO2over the northern hemisphere during 2003-2005 as retrieved from SCIAMACHY satellite measurements. Shown
is the column-averaged dry air mole fraction of CO2, denoted XCO2, in parts per million, ppm. The thick black curve shows the time
dependence of the retrieved XCO2over the northern hemisphere in the time period 2003–2005 based on monthly averages (square symbols).
Clearly visible is the seasonal cycle of CO2and its annual increase (the annual averages are shown as red horizontal lines). The maps show
the spatial pattern of the retrieved XCO2over the northern hemisphere. For each map all quality filtered XCO2measurements within a 4
months time period have been averaged. The spatial resolution is 7◦×7◦. The maps provide a visualization of the CO2“breathing” of our
planet; here the term breathing refers to the regular uptake and release of CO2primarily by the terrestrial vegetation on a seasonal timescale, observed as higher than average March-June atmospheric CO2followed by lower than average July-October atmospheric CO2.
in case of desert dust storms or due to persistent cloud cover-age. Therefore, the monthly mean values shown in Fig. 1 are not averages representative for an average over all northern hemispheric land surfaces but suffer from a sampling error. The sampling of the satellite data has to be taken into account when the satellite retrievals are being compared with, for ex-ample, global model data (as done when discussing Fig. 2, see below). The satellite data shown in Fig. 1 have been scaled with 1.01 to compensate for an approximately 1% low bias as concluded from the comparison with ground-based Fourier Transform Spectroscopy (FTS) XCO2measurements (Schneising et al., 20071).
In order to assess the quality of the retrieved XCO2 we present in the following comparisons with independent ref-erence data. Figure 2 shows a comparison of the retrieved XCO2 with that determined from the global assimilation system CarbonTracker (Peters et al., 20072, see also http: //carbontracker.noaa.gov) for two northern hemispheric lat-itude bands. CarbonTracker is a global assimilation sys-2Peters, W., Jacobson, A. R., Sweeney, C., et al.: An
atmo-spheric perspective on North American carbon dioxide exchange: CarbonTracker, Proceedings of the National Academy of Sciences of the United States of America, submitted, 2007.
tem developed by NOAA ESRL in cooperation with many partners. CarbonTracker is a reanalysis of the recent global surface fluxes of carbon dioxide, as estimated from a large set of atmospheric CO2mole fractions produced via a data assimilation system. The CarbonTracker XCO2 field as used for this study has been sampled in space and time as the SCIAMACHY satellite instrument measures. The SCIAMACHY altitude sensitivity has been taken into ac-count by applying the SCIAMACHY CO2 column averag-ing kernels (Buchwitz et al., 2005a) to the CarbonTracker CO2vertical profiles. Concerning the accuracy of Carbon-Tracker, NOAA’s comparison to about 14,000 independent aircraft sampled mostly over North America shows agree-ment within one standard deviation of ±1.9 ppm over multi-ple years, distributed as ±1.5 ppm in winter, and ±2.7 ppm in summer; biases are within 0.5 ppm in each season and nearly zero for the multiyear average (Wouter Peters, NOAA, personal communication; see also the CarbonTracker prod-uct evaluations website http://www.esrl.noaa.gov/gmd/ccgg/ carbontracker/profiles.php showing agreeement within typi-cally ±4 ppm).
Figure 2 shows monthly mean composite values of XCO2 retrieved from SCIAMACHY, averaged over ±20◦latitude
Fig. 2. Comparison between satellite and CarbonTracker XCO2for two latitude bands. The top panels show a comparison of seasonal
averages (based on monthly mean anomalies smoothed using a 3 months running average). Shown is the retrieved XCO2(blue; left axis)
and the CarbonTracker XCO2(dark green; left axis) for two latitude bands of width +/–20◦centered at a latitude of 19.53◦N corresponding
to Mauna Loa, Hawaii, USA, (left) and a latitude of 53.33◦N corresponding to Mace Head, Ireland (right). Also shown are the CO2
measurements based on flask sampling (red; right axis) at the two stations Mauna Loa (MLO; latitude: 19.53◦N, longitude: –155.58◦E, altitude: 3397 m) and Mace Head (MHD; latitude: 53.33◦N, longitude: –9.90◦E, altitude: 25 m). Also shown are the local CarbonTracker results (light green, right axis) at the locations of the two ground stations. The bottom panels show the corresponding yearly mean anomalies as horizontal lines. For each data set the difference between two contiguous years has been computed (2004–2003 and 2005–2004) and the corresponding numbers are given in the bottom panels. They correspond to the year-to-year CO2increase in the corresponding latitude band
(first two rows; for SCIAMACHY (blue) and CarbonTracker (dark green)) or locally at the two ground stations (last two rows; for the ground stations (red) and CarbonTracker (light green)).
bands, centerd at the latitudes of two selected ground based stations, namely Mauna Loa (20◦N) and Mace Head (53◦N). The average surface observations at the two stations, based on weekly flask sampling, are also shown (obtained from ftp://ftp.cmdl.noaa.gov/ccg/co2/flask/month/). The quantita-tive comparison of the surface observations and the satel-lite XCO2 is not possible because of the different spatio-temporal sampling of the different types of measurements and retrievals resulting in different seasonal cycles with re-spect to phase and amplitude (Olsen et al., 2004; Warneke et al., 2005). A direct comparison of the satellite XCO2and the CarbonTracker XCO2 is possible using the CarbonTracker results obtained by sampling and averaging CarbonTracker in the same way as the satellite observations. Within the two latitude bands, the phase of the XCO2seasonal cycle as re-trieved from satellite and modelled by CarbonTracker is in good agreement. The retrieved amplitude of XCO2is how-ever somewhat larger, especially in the latitude band centered at Mauna Loa. The surface observations and CarbonTracker show that the amplitude of the CO2seasonal cycle is larger at higher latitudes, i.e., at the latitude of Mace Head, 53◦N,
compared to the latitude of Mauna Loa, 20◦N. This increase
of the amplitude of the CO2seasonal cycle with increasing latitude is also observed by the satellite.
As shown in Buchwitz and Burrows (2004) the single mea-surement precision due to instrument noise is typically about 1% for SCIAMACHY XCO2 measurements over land. In addition to instrument noise, also other errors contribute to the retrieval precision most notably variations of atmospheric and surface parameters which introduce additional retrieval noise. Based on the analysis of the SCIAMACHY XCO2 at various locations we estimate this single measurement re-trieval precision to about 1.5% for typical measurements over land (Schneising et al., 20071). Here we discuss large scale features obtained from averaging large amounts of data. As the precision improves upon averaging, random errors are not a significant concern for the results discussed here in contrast to potential systematic errors which remain after averaging.
Several error sources contribute to the overall error. Con-cerning the error on the XCO2seasonal cycle, we have inves-tigated in particular three error sources, namely errors due to the variability of atmospheric temperature, water vapour, and
4254 M. Buchwitz et al.: First direct observation of CO2increase from space
CO2mixing ratio vertical profiles (Schneising et al., 20071). A similar error analysis has been performed by Barkley et al. (2006) for SCIAMACHY WFM-DOAS CO2 total col-umn retrievals. Concerning these three error sources we find that the CO2profile variability error is the dominating one with an estimated amplitude of about 1.0–1.5 ppm. The time dependence of this error is significantly correlated with the XCO2seasonal cycle also showing a minimum around Au-gust. These findings are consistent with the results reported in Barkley et al. (2006). The CO2profile shape variability er-ror may, therefore, explain a significant fraction of the differ-ences with respect to CarbonTracker shown in Fig. 2. In ad-dition, also aerosols and undetected clouds, e.g., sub-visual cirrus, result in errors of the retrieved XCO2. As described, the satellite XCO2data set is filtered for clouds and strong aerosol contamination but some contamination will remain affecting the retrieval. Several studies have been performed to estimate aerosol and cloud related errors (e.g., Buchwitz and Burrows, 2004; Barkley et al., 2006; Aben et al., 2006). These studies focused on single measurement errors. De-pending on the assumed scenario the errors cover a larger range from less than 1 ppm to up to several ppm, even if ex-treme cases are neglected.
To what extent these errors reduce when averaging large amounts of data is difficult to assess. Houweling et al. (2005), using several assumptions, have estimated the aerosol related SCIAMACHY CO2 retrieval error that may results when one year of global data over the continents has been averaged and estimated this error to be 3 ppm. This value has been obtained by averaging over scenes with large errors (up to 10%), such as desert dust storms, which are fil-tered out for our study. Of relevance for this study would be to know to what extent these error sources affect the re-trieved XCO2 seasonal cycle and the year-to-year changes. To obtain an estimate of this seems hardly possible without introducing major assumptions. Therefore a reliable error es-timate is currently not available. This also appears to be true for other error sources such as errors of the spectroscopic data. For example, the error on the air broadened line width of the strongest CO2lines used for the retrieval are 5–10% (Rothman et al., 2005) but this error is assumed to be mostly random. If however a certain fraction of this error would be systematic, a significant systematic error could be introduced which could be 1 ppm or larger and would also show a sea-sonal cycle as it depends on the solar zenith angle (Schneis-ing et al., 20071).
Because of the difficulty of obtaining a reliable indepen-dent end-to-end error estimate taking into account all poten-tial error sources and their correlations, we estimate, at this stage, the error of the satellite retrievals using the compari-son with the CarbonTracker reference data. The difference between the satellite retrievals and the Carbontracker XCO2 can be interpreted as a conservative estimate of the system-atic error of the satellite data as both, the satellite retrieval er-ror and the CarbonTracker erer-ror, contribute to this difference.
This interpretation requires that the CarbonTracker errors do not compensate the errors of the satellite data, which is very likely a realistic assumption.
From Fig. 2 one can see that the amplitudes of the retrieved seasonal cycles differs up to about 2 ppm from the amplitudes of the CarbonTracker data. Therefore, the error of the ampli-tude of the retrieved seasonal cycle should be less than about 2 ppm. How significant the systematically larger amplitude of the satellite retrievals compared to CarbonTracker is cur-rently not clear. Such an assessment would require a reliable independent estimate of the error of the satellite retrievals, which is currently not available as explained above.
The annual CO2 increase as retrieved from the satellite data shown in Fig. 2 is in reasonable agreement with Car-bonTracker and similar to the increase observed by the two ground stations. The year-to-year increase depends on time an latitude and is between 1–3 ppm/year. From the compari-son with CarbonTracker we conclude that the systematic er-ror of the annual increase as obtained from the satellite data is less than about 1 ppm/year.
6 Conclusions
We have presented and discussed three years of satellite mea-surements of the column-averaged CO2dry air mole fraction, denoted XCO2, retrieved from the SCIAMACHY instru-ment on board ENVISAT using the scientific retrieval algo-rithm WFM-DOAS version 1.0. The satellite retrievals have been compared with NOAA’s global CO2 assimilation sys-tem CarbonTracker. We have discussed several error sources which affect the retrieval but have not aimed at a full error analysis because of the challenge of reliably estimating the overall systematic errors which remain after averaging large amounts of data corresponding to many different conditions with several error sources and their correlations to be con-sidered. Instead we interpret the differences with respect to the independent CarbonTracker reference data set as conser-vative estimates of the systematic error of the satellite re-trievals.
We have shown, for the first time, that the CO2 annual increase, which primarily results from the burning of fossil fuels (oil, coal, gas), can be observed from space. The re-trieved CO2increase is, depending on time and latitude band, between 1–3 ppm/year. Based on the comparison with Car-bonTracker we conclude that the year-to-year CO2changes can be determined with an accuracy of about 1 ppm/year. For two low and mid latitude bands over the northern hemisphere we have shown that the latitude dependent amplitude of the CO2seasonal cycle can be retrieved with an accuracy of bet-ter than about 2 ppm.
To what extent the satellite XCO2data set presented here is accurate enough to increase our knowledge about the carbon cycle still needs to be assessed. A very promising approach to assess this is the one used for methane by Bergamaschi et
al. (2007) based on inverse modeling which enables to inves-tigate the consistency of data from various sources (e.g., sur-face, aircraft and satellite). The strength of column-averaged CO2measurements to increase our knowledge about the car-bon cycle, and the difficulty in interpreting surface mea-surements in terms of surface fluxes using transport mod-els which suffer from an imperfect parameterization of ver-tical mixing in the troposphere, has recently been shown in Yang et al. (2007). In that study it has been found that the seasonally varying northern hemispheric CO2fluxes appear to be substantially larger than assumed until now. Here we have shown that the amplitude of the CO2seasonal cycle as retrieved from the satellite data is systematically larger by about 1–2 ppm compared to CarbonTracker. Our error anal-ysis indicates that this may be explained at least partially by assuming a constant CO2profile for the retrieval. To what extent the findings of Yang et al. (2007) also explain parts of the differences between the satellite data and CarbonTracker as shown here needs to be assessed.
In this study we have limited the discussion to large scale CO2 features. The main objective of the satellite XCO2is to improve our knowledge about CO2fluxes on the regional scale. More details concerning the new WFM-DOAS version 1.0 retrieval algorithm and the XCO2year 2003 to 2005 data set, including regional details and a comparison with ground-based FTS XCO2measurements, will be presented elsewhere (e.g., in Schneising et al. (2007)1).
Acknowledgements. We thank ESA and DLR for provid-ing us with the SCIAMACHY Level 1 data. We ap-preciate the availability of CarbonTracker results from http://carbontracker.noaa.gov and comments on the ini-tial manuscript from Wouter Peters and Pieter Tans from NOAA/ESRL/GMD. We thank Thomas J. Conway and colleagues, also NOAA/ESRL/GMD, for the CO2 surface measurements
(obtained from ftp://ftp.cmdl.noaa.gov/ccg/co2/flask/month/). We also thank Paul Wennberg (Caltech, Pasadena, California, USA) for comments on the initial manuscript. This paper has been sig-nificantly improved due to comments from two referees (Christian Frankenberg and a second anonymous referee). The SCIAMACHY XCO2 has been filtered for strong aerosol contamination using
TOMS/Earthprobe Absorbing Aerosol Index (AAI) data product obtained from NASA/GSFC, which has been produced by the TOMS Ozone Processing Team (OPT). Funding for this study came from the German Ministry for Research and Education (BMBF) via DLR-Bonn (projects 50EE0027 and 50EE0507), from ESA (GSE project PROMOTE) and from the University and the State of Bremen. We acknowledge exchange of information within the European Commission Network of Excellence ACCENT. Edited by: T. Wagner
References
Aben, I., Hasekamp, O., and Hartmann, W.: Uncertainties in the space-based measurements of CO2columns due to scattering in
the Earth’s atmosphere, J. Quant. Spectrosc. Rad. Transfer, 104, 450–459, 2006.
Aumann, H. H., Gregorich, D., and Gaiser, S.: AIRS hyper-spectral measurements for climate research: Carbon dioxide and nitrous oxide effects, Geophys. Res. Lett., 32, L05806, doi:10.1029/2004GL021784, 2005.
Barkley, M. P., Frieß, U. and Monks, P. S.: Measuring atmospheric CO2from space using full spectral initiation (FSI) WFM-DOAS,
Atmos. Chem. Phys., 6, 3517–3534, 2006, http://www.atmos-chem-phys.net/6/3517/2006/.
Barkley, M. P., Monks, P. S., Hewitt, A. J., Machida, T., Desai, A., Vinnichenko, N., Nakazawa, T., Yu Arshinov, M., Fedoseev, N., and Watai, T.: Assessing the near surface sensitivity of SCIA-MACHY atmospheric CO2retrieved using (FSI) WFM-DOAS,
Atmos. Chem. Phys. Discuss., 7, 2477–2530, 2007, http://www.atmos-chem-phys-discuss.net/7/2477/2007/. Bergamaschi, P., Frankenberg, C., Meirink, J.F., Krol, M.,
Den-tener, F., Wagner, T., Platt, U., Kaplan, J.O., K¨orner, S., Heimann, M., Dlugokencky, E. J., and Goede, A.: Satellite char-tography of atmospheric methane from SCIAMACHY onboard ENVISAT: 2. Evaluation based on inverse model simulations, J. Geophys. Res., 112, D02304, doi:10.1029/2006JD007268, 2007. B¨osch, H., Toon, G. C., Sen, B., Washenfelder, R. A., Wennberg, P. O., Buchwitz, M., de Beek, R., Burrows, J. P., Crisp, D., Christi, M., Connor, B. J., Natraj, V., and Yung, Y. L.: Space-based near-infrared CO2measurements: Testing the Orbiting Carbon Ob-servatory retrieval algorithm and validation concept using SCIA-MACHY observations over Park Falls, Wisconsin, J. Geophys. Res., 111, D23302, doi:10.1029/2006JD007080, 2006.
Bovensmann, H., Burrows, J. P., Buchwitz, M., Frerick, J., No¨el, S., Rozanov, V. V., Chance, K. V., and Goede, A.: SCIAMACHY – Mission Objectives and Measurement Modes, J. Atmos. Sci., 56, 127–150, 1999.
Buchwitz, M., Rozanov, V. V., and Burrows, J. P.: A near infrared optimized DOAS method for the fast global retrieval of atmo-spheric CH4, CO, CO2, H2O, and N2O total column amounts
from SCIAMACHY/ENVISAT-1 nadir radiances, J. Geophys. Res., 105, 15 231–15 246, 2000.
Buchwitz, M. and Burrows, J. P.: Retrieval of CH4, CO, and CO2
total column amounts from SCIAMACHY near-infrared nadir spectra: Retrieval algorithm and first results, in: Remote Sensing of Clouds and the Atmosphere VIII, edited by: Sch¨afer, K. P., Com`eron, A., Carleer, M. R., and Picard, R. H. (PDF file avail-able from WFM-DOAS web site http://www.iup.uni-bremen.de/ sciamachy/NIR NADIR WFM DOAS/index.html), Proceedings of SPIE, 5235, 375–388, 2004.
Buchwitz, M., de Beek, R., Burrows, J. P., Bovensmann, H., Warneke, T., Notholt, J., Meirink, J. F., Goede, A. P. H., Bergam-aschi, P., K¨orner, S., Heimann, M., and Schulz, A.: Atmospheric methane and carbon dioxide from SCIAMACHY satellite data: Initial comparison with chemistry and transport models, Atmos. Chem. Phys., 5, 941–962, 2005a.
Buchwitz, M., de Beek, R., No¨el, S., Burrows, J. P., Bovensmann, H., Bremer, H., Bergamaschi, P., K¨orner, S., and Heimann, M.: Carbon monoxide, methane, and carbon dioxide retrieved from SCIAMACHY by WFM-DOAS: year 2003 initial data set, At-mos. Chem. Phys., 5, 3313–3329, 2005b.
Buchwitz, M., de Beek, R., No¨el, S., Burrows, J. P., Bovensmann, H., Schneising, O., Khlystova, I., Bruns, M., Bremer, H.,
Berga-4256 M. Buchwitz et al.: First direct observation of CO2increase from space
maschi, P., K¨orner, S., and Heimann, M.: Atmospheric carbon gases retrieved from SCIAMACHY by WFM-DOAS: version 0.5 CO and CH4and impact of calibration improvements on CO2 retrieval, Atmos. Chem. Phys., 6, 2727–2751, 2006,
http://www.atmos-chem-phys.net/6/2727/2006/.
Burrows, J. P., H¨olzle, E., Goede, A. P. H., Visser H., and Fricke, W., SCIAMACHY – Scanning Imaging Absorption Spectrom-eter for Atmospheric Chartography, Acta Astronautica, 35(7), 445–451, 1995.
Chevallier, F., Br´eon, F.-M., and Rayner, P. J.: Contribu-tion of the Orbiting Carbon Observatory to the estimaContribu-tion of CO2 sources and sinks: Theoretical study in a variational data assimilation framework, J. Geophys. Res., 112, D09307, doi:10.1029/2006JD007375, 2007.
Crisp, D., Atlas, R. M., Br´eon, F.-M., Brown, L. R., Burrows, J. P., Ciais, P., Connor, B. J., Doney, S. C., Fung, I. Y., Jacob, D. J., Miller, C. E., O’Brien, D., Pawson, S., Randerson, J. T., Rayner, P., Salawitch, R. S., Sander, S. P., Sen, B., Stephens, G. L., Tans, P. P., Toon, G. C., Wennberg, P. O., Wofsy, S. C., Yung, Y. L., Kuang, Z., Chudasama, B., Sprague, G., Weiss, P., Pollock, R., Kenyon, D., and Schroll, S.: The Orbiting Carbon Observatory (OCO) mission, Adv. Space Res., 34, 700–709, 2004.
Derwent, R. G., Ryall, D. B., Manning, A. J., Simmonds, P. G., O’Doherty, S., Biraud, S., Ciais, P., Ramonet, M., and Jennings, S. G.: Continuous observations of carbon dioxide at Mace Head, Ireland from 1995 to 1999 and its net European ecosystem ex-change, Atmospheric Environment, 36, 2799–2807, 2002. Gurney, K. R., Rachel M. Law, R. M., Denning, A. S., Rayner, P.
J., Baker, D., Bousquet, P., Bruhwiler, L., Chen, Y.-H., Ciais, P., Fan, S., Fung, I. Y., Gloor, M., Heimann, M., Higuchi, K., John, J., Maki, T., Maksyutov, S., Masarie, K., Peylin, P., Michael Prather, M., Pak, B. C., Randerson, J., Jorge Sarmiento, J., Shoichi Taguchi, S., Takahashi, T., and Yuen, C.-W.: Towards robust regional estimates of CO2sources and sinks using
atmo-spheric transport models, Nature, 415, 626–630, 2002.
Hamazaki, T., Kaneko, Y., and Kuze, A., Carbon dioxide monitor-ing from the GOSAT satellite, Proceedmonitor-ings XXth ISPRS confer-ence, Istanbul, Turkey, 12-23 July 2004, p.3, http://www.isprs. org/istanbul2004/comm7/papers/43.pdf, 2004.
Herman, J. R., Bhartia, P. K., Torres, O., Hsu, C., Seftor, C., and Celarier, E., Global distribution of UV absorbing aerosols from Nimbus7/TOMS data, J. Geophys. Res., 102, 16 911–16 922, 1997.
Houweling, S., Br´eon, F.-M., Aben, I., R¨odenbeck, C., Gloor, M., Heimann, M., and Ciais, P.: Inverse modeling of CO2sources
and sinks using satellite data: A synthetic inter-comparison of measurement techniques and their performance as a function of space and time, Atmos. Chem. Phys., 4, 523–538, 2004, http://www.atmos-chem-phys.net/4/523/2004/.
Houweling, S., Hartmann, W., Aben, I., Schrijver, H., Skidmore, J., Roelofs, G.-J., and Br´eon, F.-M.: Evidence of systematic errors in SCIAMACHY-observed CO2due to aerosols, Atmos. Chem.
Phys., 5, 3003–3013, 2005,
http://www.atmos-chem-phys.net/5/3003/2005/.
IPCC, Alley, R., Berntsen, T., Bindoff, N. L., et al., (drafting authors), Climate change 2007: The physical basis - Sum-mary for policy makers, Contribution of working group I to the Fourth Assessment Report of the Intergovernmental Panel on Climate Change (IPCC), IPCC web page (http://www.ipcc.ch/
SPM2feb07.pdf), 2007.
Miller, C. E., Crisp, D., DeCola, P. L., Olsen, S. C., Randerson, J. T., Michalak, A. M., Alkhaled, A., Rayner, P., Jacob, D. J., Sun-tharalingam, P., Jones, D. B. A., Denning, A. S., Nicholls, M. E., Doney, S. C., Pawson, S., Boesch, H., Connor, B. J., Fung, I. Y., O’Brien, D. O., Salawitch, R. J., Sander, S. P., Sen, B., Tans, P., Toon, G. C., Wennberg, P. O., Wofsy, S. C., Yung, Y. L., and Law, R. M.: Precision requirements for space-based XCO2 data, J. Geophys. Res., 112, D10314, doi:10.1029/2006JD007659, 2007. Olsen, S. C. and Randerson, J. T.: Differences between sur-face and column atmospheric CO2 and implications for
carbon cycle research, J. Geophys. Res., 109, D02301, doi:10.1029/2003JD003968, 2004.
Patra, P. K., Gurney, K. R., Denning, A. S. Maksyutov, S., Nakazawa, T., Baker, D. Bousquet, P., Bruhwiler, L., Chen, Y.-H., Ciais, P., Fan, S., Fung, I., Gloor, M., Heimann, M., Higuchi, K., John, L., Law, R. M., Maki, T., Pak, B. C., Peylin, P., Prather, M., Rayner, P. J., Sarmiento, J., Taguchi, S., Takahashi, T., and Yuen, C.-W.: Sensitivity of inverse estimation of an-nual mean CO2sources and sinks to ocean-only sites versus
all-sites observational networks, Geophys. Res. Lett., 33, L05814, doi:10.1029/2005GL025403, 2006.
Peylin, P., Rayner, P. J., Bousquet, P., Carouge, C., Hourdin, F., Heinrich, P., Ciais, P., and AEROCARB contributors: Daily CO2flux estimates over Europe from continuous atmospheric
measurements: 1, inverse methodology, Atmos. Chem. Phys., 5, 3173–3186, 2005,
http://www.atmos-chem-phys.net/5/3173/2005/.
Rayner, P. J. and O’Brien, D. M.: The utility of remotely sensed CO2 concentration data in surface inversions, Geophys. Res.
Lett., 28, 175–178, 2001.
R¨odenbeck, C., Houweling, S., Gloor, M., and Heimann, M.: CO2
flux history 1982–2001 inferred from atmospheric data using a global inversion of atmospheric transport, Atmos. Chem. Phys., 3, 1919–1964, 2003,
http://www.atmos-chem-phys.net/3/1919/2003/.
Rothman, L. S., Barbe, A., Benner, D. C., Brown, L. R., Camy-Peyret, C., Carleer, M. R., Chance, K., Clerbaux, C., Dana, V., Devi, V. M., Fayt, A., Flaud, J. M., Gamache, R. R., Goldman, A., Jacquemart, D., Jucks, K. W., Lafferty, W. J., Mandin, J. Y., Massie, S. T., Nemtchinov, V., Newnham, D. A., Perrin, A., Rins-land, C. P., Schroeder, J., Smith, K. M., Smith, M. A. H., Tang, K., Toth, R. A., Vander Auwera, J., Varanasi, P., and Yoshino, K.: The HITRAN molecular spectroscopic database: edition of 2000 including updates through 2001, J. Quant. Spectrosc. Ra-diat. Transfer, 82, 5–44, 2003.
Rothman, L. S., Jaquemart, D., Barbe, A., et al.: The HITRAN 2004 molecular spectroscopic database, J. Quant. Spectrosc. Radiat. Transfer, 96, 139–204, 2005.
Warneke, T., Yang, Z., Olsen, S., K¨orner, S., Notholt, J., Toon, G. C., Velazco, V., Schulz, A., and Schrems, O., Seasonal and latitudinal variations of columns averaged volume-mixing ratios of atmospheric CO2, Geophys. Res. Lett., 32, L03808, doi:10.1029/2004GL021597, 2005.
Yang, Z., Washenfelder, R. A., Keppel-Aleks, G., Krakauer, N. Y., Randerson, J. T., Tans, P. P., Sweeney, C., and Wennberg, P. O.: New constraints on Northern Hemispheric growing season net flux, Geophys. Res. Lett., 34, L12807, doi:10.1029/2007GL029742, 2007.