HAL Id: hal-02528337
https://hal.archives-ouvertes.fr/hal-02528337
Submitted on 2 Apr 2020
HAL is a multi-disciplinary open access
archive for the deposit and dissemination of
sci-entific research documents, whether they are
pub-lished or not. The documents may come from
teaching and research institutions in France or
abroad, or from public or private research centers.
L’archive ouverte pluridisciplinaire HAL, est
destinée au dépôt et à la diffusion de documents
scientifiques de niveau recherche, publiés ou non,
émanant des établissements d’enseignement et de
recherche français ou étrangers, des laboratoires
publics ou privés.
Distributed under a Creative Commons Attribution - NonCommercial| 4.0 International
License
Eloi Chazelas, Bernard Srour, Elisa Desmetz, Emmanuelle Kesse-Guyot,
Chantal Julia, Valérie Deschamps, Nathalie Druesne-Pecollo, Pilar Galan,
Serge Hercberg, Paule Latino-Martel, et al.
To cite this version:
Eloi Chazelas, Bernard Srour, Elisa Desmetz, Emmanuelle Kesse-Guyot, Chantal Julia, et al.. Sugary
drink consumption and risk of cancer: results from NutriNet-Santé prospective cohort. BMJ, BMJ
Publishing Group, 2019, 366, pp.l2408. �10.1136/bmj.l2408�. �hal-02528337�
Sugary drink consumption and risk of cancer: results from
NutriNet-Santé prospective cohort
Eloi Chazelas,
1Bernard Srour,
1Elisa Desmetz,
1Emmanuelle Kesse-Guyot,
1Chantal Julia,
1,2Valérie Deschamps,
3Nathalie Druesne-Pecollo,
1Pilar Galan,
1Serge Hercberg,
1,2Paule Latino-Martel,
1Mélanie Deschasaux,
1Mathilde Touvier
1ABSTRACT
OBJECTIVE
To assess the associations between the consumption of sugary drinks (such as sugar sweetened beverages and 100% fruit juices), artificially sweetened beverages, and the risk of cancer.
DESIGN
Population based prospective cohort study.
SETTING AND PARTICIPANTS
Overall, 101 257 participants aged 18 and over (mean age 42.2, SD 14.4; median follow-up time 5.1 years) from the French NutriNet-Santé cohort (2009-2017) were included. Consumptions of sugary drinks and artificially sweetened beverages were assessed by using repeated 24 hour dietary records, which were designed to register participants’ usual consumption for 3300 different food and beverage items.
MAIN OUTCOME MEASURES
Prospective associations between beverage
consumption and the risk of overall, breast, prostate, and colorectal cancer were assessed by multi-adjusted Fine and Gray hazard models, accounting for competing risks. Subdistribution hazard ratios were computed.
RESULTS
The consumption of sugary drinks was significantly associated with the risk of overall cancer (n=2193 cases, subdistribution hazard ratio for a 100mL/d increase 1.18, 95% confidence interval 1.10 to 1.27, P<0.0001) and breast cancer (693, 1.22, 1.07 to 1.39, P=0.004). The consumption of artificially sweetened beverages was not associated with the risk of cancer. In specific subanalyses, the consumption of 100% fruit juice was significantly associated with the risk of overall cancer (2193, 1.12, 1.03 to 1.23, P=0.007).
CONCLUSIONS
In this large prospective study, the consumption of sugary drinks was positively associated with the risk of overall cancer and breast cancer. 100% fruit juices were also positively associated with the risk of overall cancer. These results need replication in other large scale prospective studies. They suggest that sugary drinks, which are widely consumed in Western countries, might represent a modifiable risk factor for cancer prevention.
STUDY REGISTRATION
ClinicalTrials.gov NCT03335644.
Introduction
The consumption of sugary drinks has increased worldwide in the last decades; according to the Global Burden of Disease,1 their “summary exposure value”
(taking into account the extent of exposure by risk level and the severity of that risk’s contribution to disease burden) increased by more than 40% from 1990 to 2016. The impact of sugary drinks on cardiometabolic health is well studied:2 they are associated with an increased
risk of weight gain, being overweight, or obesity;3 4 a
greater incidence of type 2 diabetes (independently of adiposity);5 a higher risk of hypertension;6 and with
cardiometabolic death.7 In 2010, Singh and colleagues
estimated that among all worldwide yearly deaths from diabetes and cardiovascular diseases, about 178 000 were attributable to sugary drink consumption.8
Sugary drink consumption was one of the behavioural risk factors that contributed the most to the increase in global attributable deaths and disability adjusted life years (DALYs) between 1990 and 2016.1 Artificially
sweetened beverages were initially envisioned as a healthier alternative, however, they are associated with a higher incidence of hypertension,9 obesity,10 and
type 2 diabetes.5 Besides, some artificial sweeteners
were suggested to increase glucose intolerance by altering the gut microbiota.11
In contrast, the association between sugary drinks and the risk of cancer has been less investigated. However, this potential relation raises increasing concerns owing to its mechanistic plausibility. Indeed, sugary drinks are convincingly associated with the risk of obesity,3 4 which in turn, is recognised as a strong
risk factor for many cancers.12 Apart from the obesity
and adiposity pathways, mechanisms underlying a link between sugary drinks and cancer might involve insulin resistance caused by their high glycaemic index or glycaemic load, which have been related to breast cancer,13 14 hepatocellular cancer,15 and diabetes
related carcinomas.16 The chemical compounds in
WHAT IS ALREADY KNOWN ON THIS TOPIC
The consumption of sugary drinks has increased worldwide during the last decades
Sugary drinks are convincingly associated with the risk of obesity, which is a strong risk factor for many cancers
WHAT THIS STUDY ADDS
The consumption of sugary drinks (including 100% fruit juice) was associated with an increased risk of overall cancer and breast cancer
In specific subanalyses, the consumption of 100% fruit juices were also associated with an increased risk of overall cancers
The consumption of artificially sweetened beverages was not associated with a risk of cancer, but statistical power was probably limited owing to a relatively low consumption in this sample
1Sorbonne Paris Cité
Epidemiology and Statistics Research Center (CRESS), Inserm U1153, Inra U1125, Cnam, Paris 13 University, Nutritional Epidemiology Research Team (EREN), 74 rue Marcel Cachin F-93017 Bobigny Cedex, France
2Public Health Department,
Avicenne Hospital, AP-HP, Bobigny, France
3Santé Publique France, The
French Public Health Agency, Nutritional Epidemiology Surveillance Team (ESEN), Bobigny, France
Correspondence to: B Srour b.srour@eren.smbh.univ-paris13.fr (or @BernardSrour on Twitter; ORCID 0000-0002-1277-3380)
Additional material is published online only. To view please visit the journal online.
Cite this as: BMJ 2019;365:l2408
http://dx.doi.org/10.1136/bmj.l2408 Accepted: 7 May 2019
on 2 April 2020 by guest. Protected by copyright.
http://www.bmj.com/
sugary drinks, such as 4-methylimidazole in drinks containing caramel colourings (defined as possibly carcinogenic to humans by the International Agency for Research on Cancer, IARC),17 18 pesticides in fruit
juices,19 20 or artificial sweeteners such as aspartame
might play a role in carcinogenesis.21
However, epidemiological literature on sugary drinks and the risk of cancer is still limited and there was not enough evidence to support a link in the recent report by the World Cancer Research Fund/American Institute for Cancer Research.12 Very few prospective
studies have been conducted on the association between sugary drinks and individual cancer site. Two prospective cohorts published contrasting results regarding breast cancer: one suggesting an increased risk in post-menopausal women (Melbourne Collaborative Cohort Study, 946 cases),22 and the
other observing no association (Framingham Offspring cohort, 124 cases).23 Increased risks were also
suggested for adiposity related and obesity related cancers in recent surveys,22 23 as well as for pancreas,24
gallbladder, 25 and endometrial cancers,26 although
some other studies observed null results.12 27-29 Thus,
literature concerning sugary drinks and the risk of cancer is inconsistent and needs further explorations. Furthermore, sugary drinks and artificially sweetened beverages were rarely analysed separately in previous studies. Thus, the aim of this study is to investigate the relations between the consumptions of sugary drinks and artificially sweetened beverages and the risk of first cancer in a large prospective cohort with detailed and up to date dietary intake assessment.
Methods
Study population
NutriNet-Santé is a French, ongoing, web-based cohort launched in 2009 aiming to study the associations between nutrition and health as well as the determinants of dietary behaviours and nutritional status. This cohort has been previously described in detail.30 Participants aged over 18 with access to
the internet have been continuously recruited from the general population since May 2009 by means of large multimedia campaigns. Questionnaires are completed online on a dedicated website. Participants are followed by using an online platform connected to their email address. The NutriNet-Santé study is registered at ClinicalTrials.gov as NCT03335644.
Data collection
At inclusion, participants completed a set of five questionnaires related to sociodemographic and lifestyle characteristics (eg, date of birth, sex, educa-tional level, smoking status, number of children),31
anthropometry (height, weight),32 33 dietary intakes
(see below),34 35 36 physical activity (validated seven
day International Physical Activity Questionnaire),37
and health status (eg, personal and family history of diseases, menopausal status, drug use including hormonal treatment for menopause and oral contraceptives). Weight was collected every six months.
The web-based self administered anthropometric questionnaire was compared with a traditional paper questionnaire,33 and reported weight was also validated
against weight measured with a calibrated scale (BC-418MA, TANITA, Tokyo, Japan) by trained investigators in a validation study on a subsample,32 showing high
consistency. Other web-based questionnaires used to collect baseline characteristics of the participants (eg, sociodemographic and lifestyle data) have also been tested against traditional paper questionnaire,31
showing very high consistency between the two methods, and even a lower proportion of missing or abnormal values in the web questionnaire, owing to integrated controls, mandatory fields, and conditional skip patterns. Other methodological studies were conducted to test for the reliability of the data declared online by the participants and also observed very high levels of consistency.38 For instance, the consistency
between declared information on sex, date of birth, and department of birth of a sample of participants and the first digits of their social security number was checked.
Regarding dietary data collection, at baseline and every six months (to vary the season of completion), participants were asked to fill three non-consecutive validated web-based 24 hour dietary records, randomly assigned over a two week period (two weekdays and one weekend day in order to take into account the variability of the diet during the week). The calculation of the mean daily dietary intake across the study period was weighted in order to respect the 5:7 and 2:7 ratios of week days and weekend days.34 35 39
At least two 24 hour dietary records during the first two years of follow-up were mandatory in order to be included in the nutritional analyses. Appendix 1 shows the details on qualitative and quantitative assessment of food and beverage intake performed in NutriNet-Santé. Dietary under-reporting was identified on the basis of the method proposed by Black, by using the basal metabolic rate and Goldberg cut-off, and under-reporters of energy intake were excluded (20.0%).40
Appendix 2 shows the details on the method for detection of under-reporters.
Beverage consumption
The NutriNet-Santé composition table included 97 sugary drink items and 12 artificially sweetened beverage items. The sugary drinks group consisted of all sugar sweetened beverages containing more than 5% of simple carbohydrates, as well as 100% fruit juices (with no added sugar). It included soft drinks (carbonated or not), syrups, 100% juice, fruit drinks, sugar sweetened hot beverages, milk-based sugar sweetened beverages, sport drinks, and energy drinks. Median sugar content for sugary drinks was 10.7 g/100mL. The sugary drinks group was then subdivided into 100% fruit juices (median sugar level 10.3 g/100mL) and sugary drinks except 100% fruit juices (median sugar level 10.9 g/100mL). The group artificially sweetened beverages included all beverages containing non-nutritive sweeteners, such as diet
on 2 April 2020 by guest. Protected by copyright.
http://www.bmj.com/
soft drinks, sugar-free syrups, and diet milk-based beverages.
Biological sampling and clinical examination
Participants in the NutriNet-Santé study were invited, on a voluntary basis, for a visit in one of the local centres specifically set up for biological sampling and clinical examination, including bioimpedance measurements, in each region (83 hospital centres). A visceral fat index was calculated with a calibrated impedance body composition analyser (BC-418MA, TANITA, Tokyo, Japan), based on total body and regional % fat estimations which were previously validated against dual-energy X-ray absorptiometry.41
More generally, fat estimates by body composition analyser were validated against dual-energy X-ray absorptiometry in several studies.42 43 The visceral
fat index ranges from 0 to 60 units, and is considered excessive when over 12 units. These biological and clinical data were collected for 19 772 participants of the cohort, among which 15 637 pertained to the study sample of the present study.
Case ascertainment
Health events were self declared through a yearly questionnaire, a specific check-up questionnaire (every three months), or at any time through a specific interface on the study website. Each declaration of incident cancer was controlled by a physician from the study team who contacted participants and asked them to provide any relevant medical records. When additional information was needed, we contacted the patient’s physician, or hospital, or both. All medical data was reviewed by a committee of physicians. The NutriNet-Santé cohort is linked to medico-administrative databases of the national health insurance system (SNIIRAM databases) and to the French national cause specific mortality registry (CépiDC). Based on these databases, we could complete information regarding health events and deaths, thereby limiting any potential bias owing to participants with cancer who might not report their disease to the study investigators. Cancer cases were classified by using the ICD-10 (international classification of diseases, 10th revision). In this study, we considered all first primary cancers diagnosed between the inclusion date and 11 January 2018 to be cases, except for basal cell skin carcinoma, which was not considered as a cancer. Medical records were obtained for more than 90% of cancer cases. Because of the high validity of self reports (95% of self reported cancers for which a medical record was obtained were confirmed by our physicians), all participants who self reported incident cancers were included as cases, unless they were identified as non-case participants by a pathology report.
Statistical analysis
We defined baseline as the date of inclusion in the cohort (when participants finished completing the set of baseline questionnaires on diet, physical activity, health,
sociodemographic characteristics, and anthropometry). We included 101 257 participants without cancer at baseline who provided at least two valid 24 hour dietary records during their first two years of follow-up. Appendix 3 shows the study flow. Appendix 4 compares included with excluded participants.
We performed variance reduction by calculating usual daily beverage intakes with the method proposed by the US National Cancer Institute (SAS macros %MIXTRAN followed by %INDIVINT) to correct for within person and between person variability and to deal with zeroes (non-consumption).44 We calculated
daily dietary intakes in this prospective analysis by taking into account all 24 hour dietary records available during the first two years of each participant’s follow-up and used these as baseline usual dietary intakes. We used the Multiple Imputation by Chained Equations method by fully conditional specification (15 imputed datasets) to handle missing data in covariates for the following variables: smoking status (0.1% of missing data), level of education (6.3%), physical activity level (14.0%), height (0.6%), and BMI (0.6%).45We estimated weight gain during follow-up
as the percentage of weight gain between inclusion of participants and the last weight declared to date (excluding weight data reported during the two years preceding a patient developing cancer). We defined sex specific quarters of consumption for each type of sugary drink. Participants were included at different entry dates, had different follow-up durations, and censored data. Studied cancers were overall, breast, prostate, and colorectal cancers (the most frequent cancer sites in the cohort), and lung cancer in the secondary analyses.
Since the main objective was to compare the risk of cancer across different levels of sugary drink consumption (coded as continuous variables or quarters) while accounting for competing events (mortality and other cancer sites than the one studied in cancer site-specific analyses), we used multivariable Fine and Gray models with age as the primary time scale and a left truncation to compute subdistribution hazard ratios and their 95% confidence intervals.
This model estimates the absolute incidence of the event of interest, allowing us to model directly the association between the exposure variable and the rate of cancer after accounting for competing risks and allowing a direct (but non-numeric) inference on the risk of cancer.46 47 Thus, subdistribution hazard
ratios can be interpreted as the change in cancer rate according to sugary drink consumption, in patients who are either event-free or who have experienced a competing event:48 a subdistribution hazard ratio
significantly >1 reflects an increased risk and a subdistribution hazard ratio significantly <1 reflects a decreased risk. As a sensitivity analysis, another approach to take into account competing risk was tested using cause-specific Cox models, providing cause-specific hazard ratios.
We tested the proportional hazard assumption of the Fine and Gray model by using rescaled
on 2 April 2020 by guest. Protected by copyright.
http://www.bmj.com/
type residuals computed along with the SAS macro %PSHREG as described by Kohl and colleagues.49
The corresponding P values were obtained by testing Pearson correlations between residuals and log (follow-up duration) (appendix 5).
In continuous models, the increment for the different beverage types was adapted according to the distribution of their consumption. An increment of 100 mL/d was adapted for sugary drinks, but it was excessive for artificially sweetened beverages regarding their range of consumption in this study (as shown in distribution plots, appendix 6). Thus, an increment of 10 mL/d was selected for artificially sweetened beverages. The increment for sugar from sugary drinks was 10 g/d.
We assessed and tested the potential nonlinear effects of continuous exposure variables by using restricted cubic spline transformations in multivariable models of competing endpoints (appendix 7).50
Participants contributed person time until the date of diagnosis of cancer, the date of last completed questionnaire, the date of death, or 11 January 2018, whichever occurred first. We performed stratifications by menopausal status for breast cancer analyses. For these, women contributed person time to the premenopausal model until their age at menopause and to the postmenopausal model from their age at menopause.
The main model was adjusted for age (time scale), sex, energy intake without alcohol (kcal/d, continuous), sugar intake from other dietary sources (all sources except sugary drinks), alcohol, sodium, lipid and fruit and vegetable intakes (g/d, continuous), body mass index (kg/m2, continuous), height (cm,
continuous), physical activity (high, moderate, low, calculated according to International Physical Activity Questionnaire recommendations),37 smoking
status (never, former, current smokers), number of 24 hour dietary records (continuous), family history of cancer (yes or no), educational level (less than high school degree, less than two years after high school degree, two or more years after high school degree), and the following prevalent conditions at baseline: type 2 diabetes (yes or no), hypertension (yes or no), major cardiovascular event (myocardial infarction or stroke; yes or no), and dyslipidaemia (triglycerides or cholesterol, or both; coded as 0, 1, 2, according to the number of dyslipidaemia). We made additional adjustments for the number of biological children (continuous), menopausal status at baseline (menopausal or non-menopausal), hormonal treatment for menopause at baseline and during follow-up (for postmenopausal analyses; yes or no), and oral contraception use at baseline and during follow-up (for premenopausal analyses; yes or no) for breast cancer analyses.
We performed stratified analyses according to baseline BMI status (< or ≥25 kg/m2) and percentage
weight gain since baseline (≤ or >5%). Since some antioxidants might interact with tobacco smoke,51 we
tested the interaction between fruit juice intake (as well
as other types of sugary drinks) and smoking status on the risk ofcancer. We tested other exposure variables in multivariable models, such as energy intake from sugary drinks, as well as sugar sweetened sodas. We applied a bootstrap approach to the estimation of usual dietary intakes by variance reduction as sensitivity analysis, followed by testing Fine and Gray models to account for extra variation. Lower and upper bounds of empirical confidence intervals were defined respectively as the 2.5th and 97.5th centiles of the distribution of subdistribution hazard ratios obtained across all iterations (n=200). Appendix 11 shows the methods and results of a series of other sensitivity analyses.
We performed multivariable linear regression as a secondary analysis in order to investigate the association between quarters of consumption of sugary drinks and visceral adiposity index, taking into account potential confounders: age, sex, energy intake without alcohol, sugar intake from other dietary sources, alcohol intake, body mass index, physical activity, smoking status, number of 24 hour dietary records and educational level.
All tests were two sided, with P<0.05 considered to be statistically significant. We used SAS version 9.4 for the analyses.
Patient and public involvement
The research question developed in this article corresponds to a strong concern of the participants involved in the NutriNet-Santé cohort, and of the general public. The results of the present study will be disseminated to the NutriNet-Santé participants through the cohort website, public seminars, and a press release.
Results
Description of the study population
A total of 101 257 participants (21 533 (21.3%) men and 79 724 (78.7%) women) were included in the analyses. Mean age at baseline was 42.2 (SD 14.4, range 18.0-72.7): 46.9 (15.2, 18.0-71.0) for men and 40.9 (13.9, 18.0-72.7) for women. Mean number of dietary records was 5.6 (SD 3.0), with a minimum of 2 (which represented 7.7% (7802/101 257) of the population) and up to 15 records per patient. Table 1 shows the baseline characteristics of the study population according to quarters of sugary drink consumption, after correction for within person and between person variability and variance reduction. Compared with lower consumers of sugary drinks (first quarter), higher consumers (fourth quarter) tended to be younger, more educated, less physically active, and tended to have less family history of cancer, and to have less prevalent cardiometabolic diseases (crude/ unadjusted descriptive comparisons). They also had higher energy, carbohydrate, lipid, and sodium intakes and lower alcohol intake, compared with lower consumers. The proportion of current smokers was slightly higher in the fourth quarter of sugary drinks consumption compared with the first quarter. Median
on 2 April 2020 by guest. Protected by copyright.
http://www.bmj.com/
daily consumption of sugary drinks was greater in men than in women (90.3 mL v 74.6 mL, respectively; P<0.001, not tabulated). Appendix 3 shows the distribution of total sugary drinks consumption in men and women. Mean number of dietary records was slightly higher in higher consumers (fourth quarter) than in lower consumers (first quarter) of sugary drinks (6.4 v 5.4).
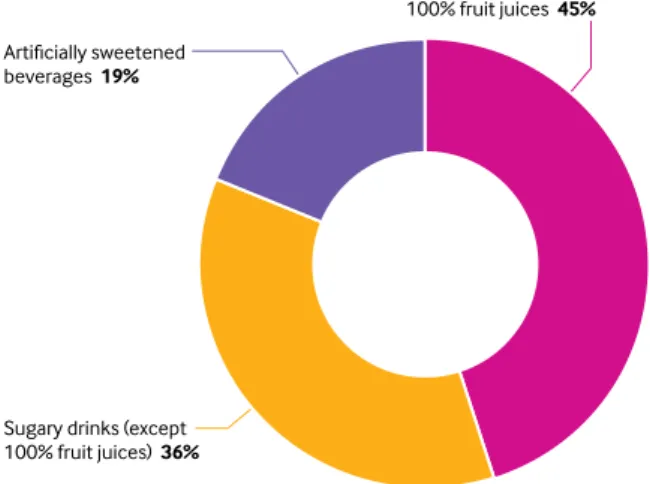
Figure 1 shows that beverages contributing to sugary drinks and artificially sweetened beverages were 100% fruit juices (45%), sugary drinks except 100% fruit juices (36%), and artificially sweetened beverages (19%). The Pearson correlation coefficients between sugary drinks and energy intake were 0.23 for overall sugary drinks, 0.17 for sugary drinks except 100% fruit juices, and 0.17 for 100% fruit juices. During follow-up (493 884 person years, median follow-up time 5.1 years, range 0.003-8.8), 2193 first incident cases of cancer were diagnosed and validated, among which were 693 breast cancers (283 premenopausal, 410 postmenopausal), 291 prostate cancers, and 166 colorectal cancers. Mean age at cancer diagnosis was 58.5 ±12.0.
Main associations between sugary drinks, artificially sweetened beverages, and risk of cancer
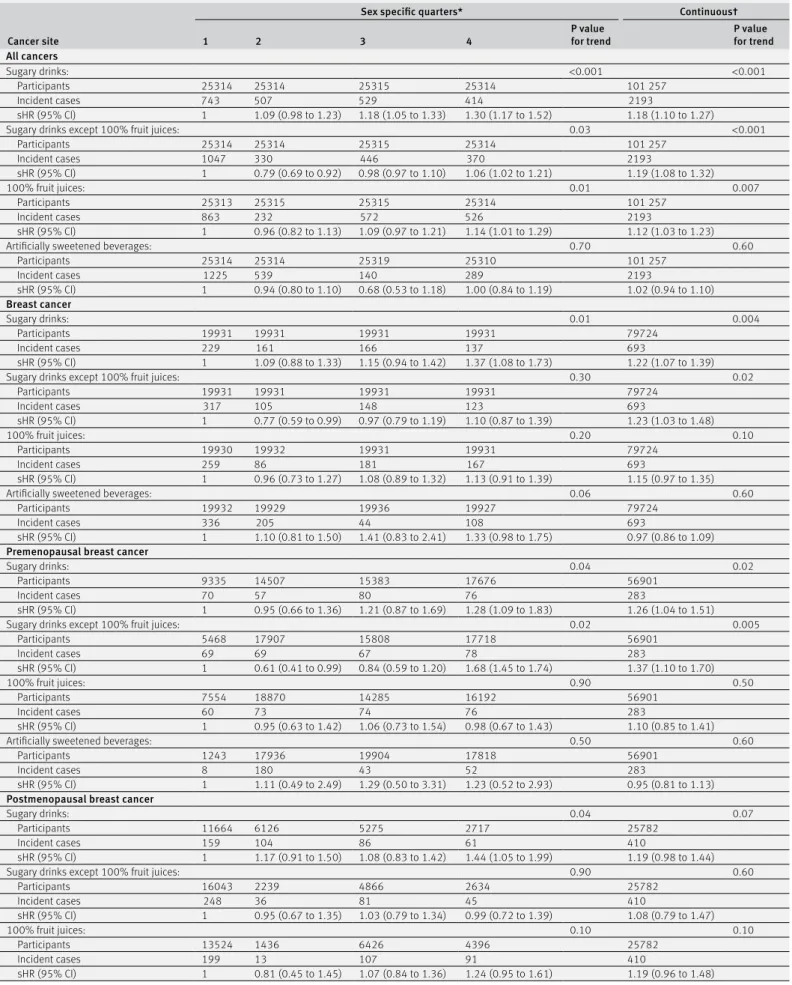
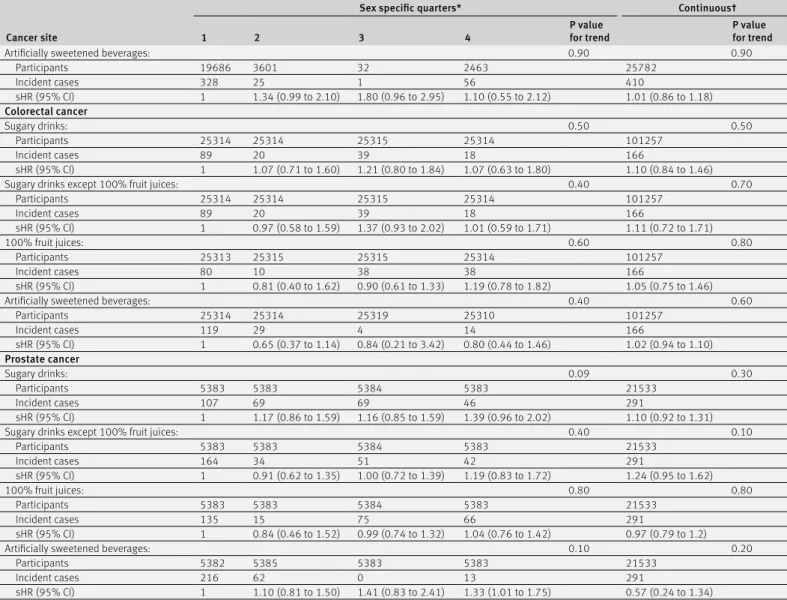
The proportional hazard assumptions of the Fine and Gray models were met (appendix 5), as well as the assumption of linear dose-response between the intakes of sugary drinks, sugar from sugary drinks, and cancer (appendix 7). Table 2 shows the subdistribution hazard ratios for the associations between sugary drink consumption (continuous and by quarters of consumption) and the risk of cancer. There was a positive association between the consumption of sugary drinks and overall cancer (subdistribution hazard ratio for a 100 mL/d increase 1.18, 95% confidence interval 1.10 to 1.27, P<0.001) and breast cancer (1.22, 1.07 to 1.39, P=0.004) rates. The latter association was more specifically observed for premenopausal (P=0.02) than for postmenopausal (P=0.07) breast cancer. However, the median consumption of sugary drinks was lower in menopausal (88.2 mL/d) compared with premenopausal (43.2 mL/d) women. No association was detected for prostate and colorectal cancers. Appendix 8 shows the models stratified by sex for the association between sugary drinks and colorectal cancer rates. The association between sugary drink consumption and the risk of lung cancer was not significant (subdistribution hazard ratio for a 100 mL/d increase 0.61, 95% confidence interval 0.43 to 1.12, P=0.1, total 101 257, incident cases 88) but statistical power was very limited for this cancer location. Results of the association between sugary drinks and the risk of cancer were similar when stratification was performed according to BMI status or weight gain during follow-up (appendix 9).
An increase in the consumption of 100% fruit juice was positively associated with overall cancer rate (subdistribution hazard ratio for a 100 mL/d increase 1.12, 95% confidence interval 1.03 to 1.23, P=0.007;
table 2). No interaction was detected between fruit juice intake and smoking status (P=0.16), nor between sugary drinks overall and smoking status (P=0.13).
Table 2 shows that an increased consumption of other sugary drinks (that is, all except 100% fruit juices) was positively associated with overall cancer rate (subdistribution hazard ratio for a 100 mL/d increase 1.19, 95% confidence interval 1.08 to 1.32, P<0.001) and breast cancer (1.23, 1.03 to 1.48, P=0.02), particularly in premenopausal women (P=0.005).
Artificially sweetened beverages were not associated with the risk of cancer for all cancer sites (P>0.20, table 2).
The association between sugar sweetened soda specifically and cancer rate was borderline non-significant (subdistribution hazard ratio for a 100 mL/d increase 1.03, 95% confidence interval 0.99 to 1.23, P=0.06, total 101 257, incident cases 2193 for overall cancer; 1.10, 0.95 to 1.46, P=0.07, 79 724, 693 for breast cancer, data not tabulated), but the consumption was limited (median consumption=5.8 mL/d).
Appendix 10 shows that an increase of sugar from sugary drinks was positively associated with overall cancer (subdistribution hazard ratio for a 10g/d increase in sugar 1.16, 95% confidence interval 1.09 to 1.24, P<0.001) and breast cancer (1.18, 1.05 to 1.33, P=0.006) rates. Consistently, when the main model was further adjusted for sugar from sugary drinks, the relation between sugary drinks and the risk of overall cancer was not significant (P=0.30; appendix 11). Appendix 10 shows that energy intake from sugary drinks was also associated with cancer rate (subdistribution hazard ratio for an increase of 100 kcal/d (1 kcal=4.18 kJ=0.00418 MJ) from sugary drinks 1.46, 95% confidence interval 1.26 to 1.68, P<0.001 for overall cancer; 1.54, 1.18 to 2.01, P=0.001 for breast cancer).
Sensitivity analyses
Further adjustments for several indicators of the quality of the diet did not substantially modify the findings, nor did any other sensitivity analyses (appendix 11). Results remained stable when applying a bootstrap approach to account for extra variation (subdistribution hazard ratio for a 100 mL/d increase in sugary drink consumption 1.18, 95% confidence interval 1.02 to 1.34 for overall cancer; 1.23, 1.02 to 1.60 for breast cancer). Appendix 12 shows that cause-specific Cox proportional hazard models provided similar results.
Association between the consumption of sugary drinks and visceral adiposity
Among the 15 637 participants for whom bioimpedance data was available, an association between quarters of consumption of sugary drinks and visceral adiposity index was observed (mean 7.43, standard error 0.03 for quarter 4 v 7.34, 0.03 for quarter 1; P=0.04). No association was observed with artificially sweetened beverages (P=0.07; appendix 13).
on 2 April 2020 by guest. Protected by copyright.
http://www.bmj.com/
Table 1 | Baseline characteristics of the study population. NutriNet-Santé cohort, France, 2009-18. Values are numbers (percentages) unless stated otherwise
Characteristics All participants
Sex specific quarters of sugary drink consumption*
1 2 3 4
No 101 257 25 314 25 314 25 315 25 314
Mean (SD) age (years) 42.2 (14.4) 52.6 (11.0) 41.8 (14.0) 40.3 (13.8) 34.2 (12.3)
Women 79724 (78.7) 19931 (78.7) 19931 (78.7) 19931 (78.7) 19931 (78.7)
Mean (SD) height (cm)† 166.8 (8.0) 165.8 (7.9) 166.8 (8.0) 167.1 (8.0) 167.8 (8.2)
Mean (SD) body mass index (kg/m2)† 23.6 (4.4) 24.5 (4.7) 23.6 (4.4) 23.4 (4.3) 23.1 (4.2)
Mean (SD) visceral adiposity index‡ 7.1 (4.3) 7.9 (3.9) 6.8 (4.0) 6.7 (4.1) 5.4 (4.0)
Family history of cancer§ 34060 (33.6) 11662 (46.1) 8401 (33.2) 7962 (31.5) 6035 (23.8)
Type 2 diabetes 1386 (1.4) 794 (3.1) 267 (1.1) 203 (0.8) 122 (0.5)
Hypertension 7977 (7.9) 3445 (13.6) 1838 (7.3) 1709 (6.8) 985 (3.9)
Major cardiovascular event (myocardial infarction or stroke) 1049 (1.0) 480 (1.9) 227 (0.9) 204 (0.8) 138 (0.5) Dyslipidemia (triglycerides or cholesterol) 8370 (8.3) 3249 (12.8) 1950 (7.7) 1842 (7.3) 1329 (5.2) Higher education: No 17277 (17.1) 6212 (24.5) 4585 (18.11) 3756 (14.8) 3460 (13.7) Yes, <2 years 17306 (17.1) 4069 (16.1) 3411 (13.5) 4281 (16.9) 4336 (17.1) Yes, ≥2 years 60325 (59.6) 13332 (52.7) 15486 (61.2) 15854 (62.6) 16614 (65.6) Missing 6349 (6.3) 1701 (6.7) 1832 (7.2) 1424 (5.6) 1304 (5.1) Smoking status: Never 50861 (50.3) 11027 (43.6) 12418 (49.0) 13010 (51.4) 14420 (56.9) Former 32819 (32.4) 10760 (42.5) 8260 (32.6) 7818 (30.9) 5960 (23.5) Current 17503 (17.3) 3509 (13.9) 4617 (18.2) 4469 (17.6) 4915 (19.4) Missing 74 (0.1) 18 (0.1) 19 (0.1) 18 (0.1) 19 (0.1)
IPAQ physical activity level:
High 28158 (27.8) 8231 (32.5) 7173 (28.3) 6698 (26.5) 5853 (23.12)
Moderate 37576 (37.1) 8866 (35) 9870 (39) 9992 (39.5) 10186 (40.2)
Low 21416 (21.1) 4462 (17.6) 5203 (20.6) 5147 (20.3) 5473 (21.6)
Missing 14107 (14.0) 3755 (14.8) 3068 (12.1) 3478 (13.7) 3802 (15.0)
Mean (SD) no of biological children** 1.2 (1.2) 1.8 (1.2) 1.3 (1.2) 1.2 (1.2) 0.8 (1.1)
Menopausal status:**
Premenopausal 57284 (71.8) 9515 (47.7) 14588 (73.2) 15462 (77.6) 17719 (88.9)
Postmenopausal 22440 (28.1) 10416 (52.3) 5343 (26.8) 4469 (22.4) 2112 (11.1)
Use of hormonal treatment for menopause** 4010 (5.0) 1762 (8.8) 973 (4.9) 842 (4.2) 433 (2.2)
Oral contraception** 22473 (28.2) 2379 (11.9) 5334 (26.8) 6168 (30.9) 8592 (43.1)
Energy intake without alcohol (kcal/d):
Mean (SD) 1849.9 (452.2) 1816.7 (454.2) 1857.7 (464.7) 1915.2 (454.9) 2026.9 (477)
Median (interquartile range) 1844.5
(1584.5-2161.4) 1756.8 (1510.4-2064.1) 1800.9 (1545.3- 2111.0) 1862.7 (1599.9-2168.3) 1961.4 (1698.7- 2280.8) Alcohol intake (g/d):
Mean (SD) 7.7 (11.8) 8.9 (13) 7.6 (11.7) 7.7 (11.5) 6.7 (10.9)
Median (interquartile range) 3.2 (0.0-10.6) 4.1 (0.0-12.5) 3.1 (0.0-10.5) 3.3 (0.0-10.7) 2.5 (0.0-8.9) Total lipid intake (g/d):
Mean (SD) 81.6 (25.3) 77.7 (24.8) 80 (25.5) 82.2 (24.6) 86.7 (25.4)
Median (interquartile range) 78.9 (64.6-95.8) 74.9 (61.0-91.6) 77.5 (63.0-94.3) 79.5 (65.3-96.1) 83.8 (69.4-100.3) Carbohydrate intake (g/d):
Mean (SD) 198.6 (57.6) 182.6 (56.8) 191.4 (56.6) 200.8 (53.8) 219.5 (56.5)
Median (interquartile range) 192.6 (160.1-230.5) 176.7 (144.3-214.2) 185.3 (154.0-222.4) 194.5 (164.3-231.5) 212.2 (181.3-249.3) Sodium intake (mg/d):
Mean (SD) 2719.7 (886.8) 2699.2 (912.9) 2695.7 (893.2) 2717.3 (872.9) 2766.4 (865.8)
Median (interquartile range) 2605.7
(2119.2-3190.4) 2582.0 (2078.1-3189.0) 2586.8 (2088.9-3169.9) 2602.2 (2122.2-3185.8) 2650.6 (2184.6- 3216.5) Sugary drinks intake (mL/d):
Mean (SD) 92.9 (68.9) 27.6 (6.8) 57.0 (12.3) 101.4 (15.6) 185.8 (65.8)
Median (interquartile range) 77.6 (39.4-126.9) 27.2 (22.3-32.5) 55.5 (46.8-66.4) 100.8 (88.8-113.3) 166.8 (143.9-205.6) 100% fruit juice intake (mL/d):
Mean (SD) 55.8 (51.1) 16.2 (5.2) 33.7 (19) 66 (35.2) 107.5 (63.2)
Median (interquartile range) 29.3 (17.6-85.4) 15.3 (13.0-18.0) 25.2 (19.8-46.6) 70.8 (26.3-94.1) 112.0 (58.3-144.3) Sugary drinks (except 100% fruit juices) intake (mL/d):
Mean (SD) 45.0 (50.3) 12.8 (5.4) 25.8 (13.4) 43.2 (27.2) 98.3 (70.2)
Median (interquartile range) 24.6 (13.7-58.7) 11.7 (8.9-15.3) 23.0 (16.9-32.3) 37.8 (19.9-63.1) 89.4 (47.1-132.2) Artificially sweetened beverage intake (mL/d):
Mean (SD) 24.4 (58.4) 15.3 (46.3) 25.3 (61.5) 24.5 (56.3) 32 (66.5)
Median (interquartile range) 6.9 (4.1-10.9) 4.3 (3.1-6.2) 7.3 (4.2-10.7) 7.7 (4.6-11.2) 9.9 (6.7-12.8) Sugar intake from sugary drinks intake (g/d):
Mean (SD) 9.7 (7.3) 3.1 (1.3) 6.1 (2) 10.5 (2.3) 19.1 (7.3)
Median (interquartile range) 8.0 (4.2-13.1) 2.9 (2.3-3.6) 5.7 (4.8-6.9) 10.3 (8.9-11.7) 17.1 (14.5-21.4) *Sex specific quarters of sugary drinks intake; sex specific cut-offs for quarters were 46.1, 90.3, and 141.7 mL/d in men and 38.1, 74.6, and 123.0 mL/d in women.
†Height and BMI were missing for 647 participants: 160 in quarter 1, 152 in quarter 2, 184 in quarter 3, and 151 in quarter 4. ‡Available for 15 637 participants
§Among first degree relatives. **Among women.
IPAQ=International Physical Activity Questionnaire; 1 kcal=4.18 kJ=0.00418 MJ
on 2 April 2020 by guest. Protected by copyright.
http://www.bmj.com/
Discussion
We found that an increase in sugary drink consumption was positively associated with the risk of overall cancer and breast cancer. When the group of sugary drinks was split into 100% fruit juices and other sugary drinks, the consumption of both beverage types was associated with a higher risk of overall cancer. In contrast, no association was detected between artificially sweetened beverage consumption and the risk of cancer in this study. These results were robust after a wide range of sensitivity analyses.
Comparison with other studies
Except for pancreatic cancer (non-significant, six prospective studies, 2010),52 no meta-analysis was
performed by the World Cancer Research Fund/ American Institute for Cancer Research on the association between sugary drinks and the risk of cancer. A meta-analysis showed no link between the consumption of sweetened,29 carbonated beverages
and the risk of overall cancer and specific locations, unlike our findings. However, this meta-analysis, funded by one of the biggest soda producing companies, did not show the isolated associations in sugary drinks and artificially sweetened beverages, which might have impaired the possibility to detecta potential role of sugar (main driver of the associations in our study). Genkinger and colleagues observed an increased risk of pancreatic cancer associated with sugar sweetened carbonated soft drink consumption in the framework of the Pooling Project (14 cohorts),24
and Navarrete-Muñoz and colleagues observed no association in the EPIC cohort.27
Data are scarce regarding other cancer sites, notably for breast cancer. The two published prospective cohorts were consistent with our findings; Hodge and colleagues observed an increased risk of breast cancer associated with sugary drinks (Melbourne Collaborative Cohort Study, participants aged 40 and over, 946 cases).22 This association was only observed
for postmenopausal breast cancer. In contrast with our results, Makarem and colleagues observed no
association with breast cancer (Framingham Offspring cohort), which might result from a lack of statistical power (124 cases).23
In line with our results, a recent meta-analysis observed no association for the risk of colorectal cancer,28 even though statistical power was limited
for this cancer in our cohort. Results are contrasted regarding prostate cancer in the literature: in line with our findings, no association was observed for sugar sweetened and artificially sweetened sodas in a meta-analysis combining two prospective studies.29
Consistently, no association was observed in the Framingham Offspring cohort for sugary drinks,23 but
an increased risk was observed for 100% fruit juices; however, statistical power was also limited in this study (157 cases). Sweetened beverage intake was associated with an increased risk of gallbladder cancer in the Swedish Mammography Cohort and Cohort of Swedish Men.25 Sugary drinks were associated with
increased risk of endometrial cancer in the Swedish Mammography Cohort.26 The limited number of cases
did not allow us to perform site-specific analyses for these cancer locations in our cohort.
Lastly, and in line with our results, two recent prospective studies observed an increased risk of obesity-related cancers and adiposity-related cancers associated with sugary drink consumption.22 23
Furthermore, associations were observed between fruit juice intake and an increased risk of thyroid carcinomas,53 and in the EPIC cohort between citrus
fruits and juices and increased risk of basal cell and squamous cell carcinomas of the skin.54 Of note,
despite their overall healthy and natural image in the general population, and some studies suggesting lower health risks compared with sugar sweetened beverages,55-58 100% fruit juices generally contain
high levels of simple sugar (median=10.3 g/100 mL in this study, sometimes higher than regular soda),59 and
their glycaemic indexes are higher than that of whole fruits.60
Mechanisms
The association between sugary drinks and the risk of cancer might be partly explained by their effect on overweight and obesity onset,34 61 since in turn, excess
weight is a strong risk factor for mouth, pharynx, larynx, oesophageal (adenocarcinoma), stomach (cardia), pancreatic, gallbladder, liver, colorectal, breast (postmenopause), ovarian, endometrial, pro-state (advanced), and kidney cancers.12 However, in
this study, all analyses testing different adjustments or stratifications related to BMI or weight change (no adjustment for BMI, adjustment for BMI at baseline or as a time dependent variable, adjustment for the percentage of weight change during follow-up, stratification by baseline BMI status, or by the percentage of weight change during follow-up) provided similar results. These elements suggest that being overweight and weight gain might not be the only drivers of the association between sugary drinks and the risk of cancer. More specifically, it has been
Artificially sweetened beverages 19%
Sugary drinks (except 100% fruit juices) 36%
100% fruit juices 45%
Fig 1 | Contribution of each beverage type to the total of sugary drinks and artificially sweetened beverage consumption
on 2 April 2020 by guest. Protected by copyright.
http://www.bmj.com/
Cancer site
Sex specific quarters* Continuous†
1 2 3 4 P value for trend P value for trend
All cancers
Sugary drinks: <0.001 <0.001
Participants 25314 25314 25315 25314 101 257
Incident cases 743 507 529 414 2193
sHR (95% CI) 1 1.09 (0.98 to 1.23) 1.18 (1.05 to 1.33) 1.30 (1.17 to 1.52) 1.18 (1.10 to 1.27)
Sugary drinks except 100% fruit juices: 0.03 <0.001
Participants 25314 25314 25315 25314 101 257 Incident cases 1047 330 446 370 2193 sHR (95% CI) 1 0.79 (0.69 to 0.92) 0.98 (0.97 to 1.10) 1.06 (1.02 to 1.21) 1.19 (1.08 to 1.32) 100% fruit juices: 0.01 0.007 Participants 25313 25315 25315 25314 101 257 Incident cases 863 232 572 526 2193 sHR (95% CI) 1 0.96 (0.82 to 1.13) 1.09 (0.97 to 1.21) 1.14 (1.01 to 1.29) 1.12 (1.03 to 1.23)
Artificially sweetened beverages: 0.70 0.60
Participants 25314 25314 25319 25310 101 257 Incident cases 1225 539 140 289 2193 sHR (95% CI) 1 0.94 (0.80 to 1.10) 0.68 (0.53 to 1.18) 1.00 (0.84 to 1.19) 1.02 (0.94 to 1.10) Breast cancer Sugary drinks: 0.01 0.004 Participants 19931 19931 19931 19931 79724 Incident cases 229 161 166 137 693 sHR (95% CI) 1 1.09 (0.88 to 1.33) 1.15 (0.94 to 1.42) 1.37 (1.08 to 1.73) 1.22 (1.07 to 1.39)
Sugary drinks except 100% fruit juices: 0.30 0.02
Participants 19931 19931 19931 19931 79724 Incident cases 317 105 148 123 693 sHR (95% CI) 1 0.77 (0.59 to 0.99) 0.97 (0.79 to 1.19) 1.10 (0.87 to 1.39) 1.23 (1.03 to 1.48) 100% fruit juices: 0.20 0.10 Participants 19930 19932 19931 19931 79724 Incident cases 259 86 181 167 693 sHR (95% CI) 1 0.96 (0.73 to 1.27) 1.08 (0.89 to 1.32) 1.13 (0.91 to 1.39) 1.15 (0.97 to 1.35)
Artificially sweetened beverages: 0.06 0.60
Participants 19932 19929 19936 19927 79724
Incident cases 336 205 44 108 693
sHR (95% CI) 1 1.10 (0.81 to 1.50) 1.41 (0.83 to 2.41) 1.33 (0.98 to 1.75) 0.97 (0.86 to 1.09)
Premenopausal breast cancer
Sugary drinks: 0.04 0.02
Participants 9335 14507 15383 17676 56901
Incident cases 70 57 80 76 283
sHR (95% CI) 1 0.95 (0.66 to 1.36) 1.21 (0.87 to 1.69) 1.28 (1.09 to 1.83) 1.26 (1.04 to 1.51)
Sugary drinks except 100% fruit juices: 0.02 0.005
Participants 5468 17907 15808 17718 56901 Incident cases 69 69 67 78 283 sHR (95% CI) 1 0.61 (0.41 to 0.99) 0.84 (0.59 to 1.20) 1.68 (1.45 to 1.74) 1.37 (1.10 to 1.70) 100% fruit juices: 0.90 0.50 Participants 7554 18870 14285 16192 56901 Incident cases 60 73 74 76 283 sHR (95% CI) 1 0.95 (0.63 to 1.42) 1.06 (0.73 to 1.54) 0.98 (0.67 to 1.43) 1.10 (0.85 to 1.41)
Artificially sweetened beverages: 0.50 0.60
Participants 1243 17936 19904 17818 56901
Incident cases 8 180 43 52 283
sHR (95% CI) 1 1.11 (0.49 to 2.49) 1.29 (0.50 to 3.31) 1.23 (0.52 to 2.93) 0.95 (0.81 to 1.13)
Postmenopausal breast cancer
Sugary drinks: 0.04 0.07
Participants 11664 6126 5275 2717 25782
Incident cases 159 104 86 61 410
sHR (95% CI) 1 1.17 (0.91 to 1.50) 1.08 (0.83 to 1.42) 1.44 (1.05 to 1.99) 1.19 (0.98 to 1.44)
Sugary drinks except 100% fruit juices: 0.90 0.60
Participants 16043 2239 4866 2634 25782 Incident cases 248 36 81 45 410 sHR (95% CI) 1 0.95 (0.67 to 1.35) 1.03 (0.79 to 1.34) 0.99 (0.72 to 1.39) 1.08 (0.79 to 1.47) 100% fruit juices: 0.10 0.10 Participants 13524 1436 6426 4396 25782 Incident cases 199 13 107 91 410 sHR (95% CI) 1 0.81 (0.45 to 1.45) 1.07 (0.84 to 1.36) 1.24 (0.95 to 1.61) 1.19 (0.96 to 1.48) Table 2 | Associations between sugary drinks and artificially sweetened beverage consumption and risk of cancer, NutriNet-Santé cohort, France, 2009-18
on 2 April 2020 by guest. Protected by copyright.
http://www.bmj.com/
suggested that sugary drinks might promote gains in visceral adiposity independently of body weight; this was the case in the prospective Framingham Third Generation Cohort.62 Two randomised trials
also support the hypothesis that sugary drinks promote visceral fat deposits.63 64 Visceral adiposity
might promote tumorigenesis through alterations in adipokine secretion and cell signalling pathways.65 In
our study, sugary drinks consumption was associated with increased visceral adiposity, suggesting that it might have played a role in the association with cancer, independently of body weight.
Another pathway could relate to the high glycaemic index or glycaemic load of sugary drinks. Glycaemic index is associated with hyperinsulinemia and type 2 diabetes,66 both potentially involved
in breast carcinogenesis.67 Rapidly absorbed
carbohydrates were previously associated with the risk of postmenopausal breast cancer in women
who were overweight and women with large waist circumference in the EPIC-France (E3N) cohort.68
Also, glycaemic load is associated with increased proinflammatory markers, such as C reactive protein,69
and systemic inflammation is suggested to increase the risk of several cancers, including breast cancer.70
Furthermore, two meta-analyses of prospective cohort studies suggest that high dietary glycaemic index is associated with a noticeably increased risk of breast cancer.13 14 Also, glycaemic index is associated
with diabetes-related carcinomas (liver, pancreas, endometrium, colorectal, breast, bladder, and reduced risk of prostate cancer).16 71 Advanced glycation end
products present in several sugary drinks were also suggested to impair endothelial function in patients with and without diabetes.72 In this study, daily intake
of sugar from sugary drinks was positively associated with overall cancer and breast cancer. Adjustment for sugar from sugary drinks cancelled the association
Cancer site
Sex specific quarters* Continuous†
1 2 3 4 P value for trend P value for trend
Artificially sweetened beverages: 0.90 0.90
Participants 19686 3601 32 2463 25782 Incident cases 328 25 1 56 410 sHR (95% CI) 1 1.34 (0.99 to 2.10) 1.80 (0.96 to 2.95) 1.10 (0.55 to 2.12) 1.01 (0.86 to 1.18) Colorectal cancer Sugary drinks: 0.50 0.50 Participants 25314 25314 25315 25314 101257 Incident cases 89 20 39 18 166 sHR (95% CI) 1 1.07 (0.71 to 1.60) 1.21 (0.80 to 1.84) 1.07 (0.63 to 1.80) 1.10 (0.84 to 1.46)
Sugary drinks except 100% fruit juices: 0.40 0.70
Participants 25314 25314 25315 25314 101257 Incident cases 89 20 39 18 166 sHR (95% CI) 1 0.97 (0.58 to 1.59) 1.37 (0.93 to 2.02) 1.01 (0.59 to 1.71) 1.11 (0.72 to 1.71) 100% fruit juices: 0.60 0.80 Participants 25313 25315 25315 25314 101257 Incident cases 80 10 38 38 166 sHR (95% CI) 1 0.81 (0.40 to 1.62) 0.90 (0.61 to 1.33) 1.19 (0.78 to 1.82) 1.05 (0.75 to 1.46)
Artificially sweetened beverages: 0.40 0.60
Participants 25314 25314 25319 25310 101257 Incident cases 119 29 4 14 166 sHR (95% CI) 1 0.65 (0.37 to 1.14) 0.84 (0.21 to 3.42) 0.80 (0.44 to 1.46) 1.02 (0.94 to 1.10) Prostate cancer Sugary drinks: 0.09 0.30 Participants 5383 5383 5384 5383 21533 Incident cases 107 69 69 46 291 sHR (95% CI) 1 1.17 (0.86 to 1.59) 1.16 (0.85 to 1.59) 1.39 (0.96 to 2.02) 1.10 (0.92 to 1.31)
Sugary drinks except 100% fruit juices: 0.40 0.10
Participants 5383 5383 5384 5383 21533 Incident cases 164 34 51 42 291 sHR (95% CI) 1 0.91 (0.62 to 1.35) 1.00 (0.72 to 1.39) 1.19 (0.83 to 1.72) 1.24 (0.95 to 1.62) 100% fruit juices: 0.80 0.80 Participants 5383 5383 5384 5383 21533 Incident cases 135 15 75 66 291 sHR (95% CI) 1 0.84 (0.46 to 1.52) 0.99 (0.74 to 1.32) 1.04 (0.76 to 1.42) 0.97 (0.79 to 1.2)
Artificially sweetened beverages: 0.10 0.20
Participants 5382 5385 5383 5383 21533
Incident cases 216 62 0 13 291
sHR (95% CI) 1 1.10 (0.81 to 1.50) 1.41 (0.83 to 2.41) 1.33 (1.01 to 1.75) 0.57 (0.24 to 1.34) *Sex specific cut-offs for quarters of sugary drinks intake were 38.1, 74.6, and 123.0 mL/d in women and 46.1, 90.3, and 141.7 mL/d in men. Sex specific cut-offs for quarters of 100% fruit juices intake were 19.9, 34.9, and 97.8 mL/d in men and 17.0, 26.2, and 81.9 mL/d in women. Sex specific cut-offs for quarters of sugary drinks except 100% fruit juices intake were 14.0, 27.1, and 65.5 mL/d in men and 13.6, 24.1, and 57.1 mL/d in women. Sex specific cut-offs for quarters of artificially sweetened beverages intake were 2.7, 4.7, and 7.9 mL/d in men and 4.6, 7.7, and 11.6 mL/d in women.
†For sugary drinks (all), sugary drinks except 100% fruit juices, and 100% fruit juices, subdistribution hazard ratios are given for an increase of 100 mL/d. For artificially sweetened beverages, subdistribution hazard ratios are given for an increase in 10 mL/d.
Table 2 | Continued
on 2 April 2020 by guest. Protected by copyright.
http://www.bmj.com/
between sugary drinks and cancer. These results suggest that the relation observed between sugary drinks and the risk of cancer was strongly driven by the sugar content. Of note, even sugary drinks with lower sugar content were associated with cancer in this study, probably because they were consumed in higher amounts than sugary drinks with higher sugar content. In contrast, water and unsweetened tea and coffee were not associated with cancer in this study. In many countries, water is the only beverage public health authorities recommend drinking.73 74
Although sugar appears as a strong driver of the association, other chemical compounds might also play a role, such as 4-methylimidazole, an additive in drinks that contain caramel colouring (eg, sodas) or pesticides that might be associated with increased risk of cancer and could be present in fruit juice.19 18 20 75
Regarding 100% fruit juices, one other explanation could be that fruit juice antioxidants might interact with tobacco smoke to potentialise carcinogenesis.51
However, the absence of an interaction between fruit juice consumption and smoking status does not support this hypothesis.
Null results observed in this study regarding the association between artificially sweetened beverages and the risk of cancer does not support the hypothesis of an adverse effect of artificial sweeteners. However, caution is needed in interpreting this finding because statistical power might have been limited to investigate this association owing to the relatively low level of consumption in this population study (median=6.9 mL/d). Some experimental studies sug-gest a possible carcinogenic effect for some artificial sweeteners, but this point is debated.76-78 In order to
evaluate accurately these associations in humans, it will be necessary to distinguish the different types of artificial sweeteners (eg, aspartame, sucralose, acesulfam K), and also to take into account all dietary sources for these additives (eg, yogurts, candies) and not only artificially sweetened beverages.
Strengths and limitations of this study
Strengths of our study include its large sample size and its detailed and up to date assessment of consumed beverage types. Some limitations include generalisability of the findings: by definition, recruited participants in volunteer based cohorts are not representative of the general population of the country. Since the participants of the NutriNet-Santé cohort were more often women, with health conscious behaviours and higher socioprofessional and educational levels than the general French population,79 this might have
resulted in a lower cancer incidence compared with national estimates (age and sex standardised incidence rate per 100 000 persons per year: 620 cases in this study v 972 cases in France)8 and a lower exposure to
sugary drinks overall, thus a lower contrast between extreme categories. Indeed, although the comparison is not straightforward owing to differences in beverage type definitions, mean intake of sugary drinks and artificially sweetened beverages represented 117.3
mL/d in our study, versus approximately 270.0 mL/dfor non-alcoholic refreshing drinks in the recent French national INCA3 survey.80 Although overestimation
cannot be totally excluded, these points rather tended to underestimate the strength of the associations in this study compared with the real associations in the general French adult population.
Secondly, even if cancer cases where identified by multiple sources, exhaustive identification cannot be guaranteed.
Thirdly, the number of cases was limited for some cancer locations, thus reducing the statistical power, which could have impaired our ability to detect associations, for instance for colorectal carcinomas, and for lung cancer (probably owing to a lower proportion of smokers in the cohort compared with the general population).
Fourthly, lower consumers were older than high consumers of sugary drinks in this study, and as such, they also had a lower educational level, higher alcohol intake, and more cardiometabolic disorders (all expected associations with older age). However, these associations could not explain our aetiological findings since, on the contrary, the potential confounding bias would have acted towards an underestimation of the strength of the associations in our study, compared with the reality. Indeed, lower consumers of sugary drinks were at higher risk of cancer regarding these characteristics, whereas after adjustment, we observed that higher sugary drink consumers had a higher risk of cancer.
Fifthly, measurement bias owing to misreporting cannot be ruled out, especially since exposures, covariates, and outcomes were based on self report measures. Notably, diet is one of the most complex exposures to assess and its evaluation is challenging.81
This challenge is not specific to our study but rather shared by all major epidemiological studies conducted worldwide in this field.82 83 The NutriNet-Santé cohort
benefits from a detailed dietary assessment measured by repeated and validated (versus biomarkers)84 85
24 hour dietary records. In addition, the prospective design of the cohort guaranteed that potential measurement errors in dietary exposure (eg, amounts of sugary drinks consumed) were non-differential regarding the outcome. They could have led to a non-differential classification bias (identically in future cases and other participants), most probably leading to an underestimation of the observed associations, although overestimation cannot be entirely ruled out. In nutritional epidemiology, a compromise has to be found between a high number of records per patient (better accuracy of the data but higher selection bias towards a very compliant population) or conversely, a smaller number of dietary records (lower degree of precision but lower selection bias compared with the general population). There is no perfect answer, thus we tested and presented the different possibilities, which showed consistent results. We also applied the variance reduction method proposed by the US National Cancer Institute to all dietary exposure variables to account for within person and between
on 2 April 2020 by guest. Protected by copyright.
http://www.bmj.com/
person variability,44 which is adapted for
occasionally-consumed foods and beverages.
Next, mean age at baseline was 42.2 but participants were followed up to nine years, the cohort included a large range of age (up to 72.7), and mean age at diagnosis was 58.5. Furthermore, the cohort was launched in 2009 and follow-up lasted until early 2018, thus, including participant with up to nine years of follow-up. This allowed us to study midterm associations between sugary drink consumption and cancer. Besides, as is usually the case in nutritional epidemiology, the assumption is made that the measured exposure at baseline (especially since we averaged a two year period of exposure) actually reflects more generally the usual eating habits of the individual during adulthood, including several years before his or her entry into the cohort. Nevertheless, since some carcinogenic processes can take several decades, it will be important in the future to reassess the associations between sugary drinks and cancer in the cohort, to investigate longer-term effects. This will be one of the objective for the next 10 years.
Finally, this is an observational study, thus causality of the observed associations cannot be established and residual confounding cannot be entirely ruled out. For instance, although BMI (used for adjustment in this study) is considered as a good indicator of adiposity,86
it would have been useful to test adjustment for more precise indicators such as waist circumference or visceral adiposity, but these data were not available for the whole cohort. Moreover, glycaemic index or glycaemic load were not available in this study and should be integrated in future investigations in order to better elucidate the mechanistic pathway involved in the associations between sugary drinks and cancer. However, a wide range of confounding factors were included in the analyses and many sensitivity analyses were performed (testing further adjustments or stratifications, or both). None substantially modified the findings, which remained statistically significant and stable. Besides, mechanistic data support the epidemiological findings observed here, as detailed above. In the future, if these results are replicated in other large cohort prospective studies and if causality is established, it will be interesting to conduct a substitution analysis and simulation studies to model the decrease in cancer incidence associated with the replacement of sugary drink consumption by water, for instance.
Conclusions
In a context where the World Health Organization is questioning the level of evidence of the scientific data supporting the implementation of a tax on sugary drinks, the results of this observational study based on a large prospective cohort suggest that a higher consumption of sugary drinks is associated with the risk of overall cancer and breast cancer. Of note, 100% fruit juices were also associated with the risk of overall cancer in this study. If these results are replicated in further large-scale prospective studies and supported by mechanistic experimental data, and given the large
consumption of sugary drinks in Western countries, these beverages would represent a modifiable risk factor for cancer prevention, beyond their well established impact on cardiometabolic health. These data support the relevance of existing nutritional recommendations to limit sugary drink consumption, including 100% fruit juice,12 87 as well as policy
actions, such as taxation and marketing restrictions targeting sugary drinks, which might potentially contribute to the reduction of cancer incidence.88 89 We thank all the volunteers of the NutriNet-Santé cohort. We also thank Younes Esseddik (IT manager); Frédéric Coffinieres, Thi Hong Van Duong, Paul Flanzy, Régis Gatibelza, Jagatjit Mohinder, and Maithyly Sivapalan (computer scientists); Cédric Agaesse (dietitian); Julien Allègre, Nathalie Arnault, Laurent Bourhis, Véronique Gourlet, and Fabien Szabo de Edelenyi (data managers or biostatisticians); and Rolland Andrianasolo and Fatoumata Diallo (physicians) for their technical contribution to the NutriNet-Santé study.
Contributors: EC, BS, and MT designed the study. SH, PG, MT, CJ, and EKG conducted the study. EC performed the statistical analysis. MT and BS supervised the statistical analysis. EC drafted the manuscript. BS and MT supervised the writing. All authors contributed to the data interpretation and revised each draft for important intellectual content. All authors read and approved the final manuscript. All authors had full access to the data in the study and can take responsibility for the integrity of the data and the accuracy of the data analysis. MT is the guarantor. The corresponding author (BS) attests that all listed authors meet authorship criteria and that no others meeting the criteria have been omitted.
Funding: The NutriNet-Santé study was supported by the following public institutions: Ministère de la Santé, Santé Publique France, Institut National de la Santé et de la Recherche Médicale (INSERM), Institut National de la Recherche Agronomique (INRA), Conservatoire National des Arts et Métiers (CNAM), and Université Paris 13. BS was funded by the French National Cancer Institute (grant number INCa_8085) and the Fondation de France. Researchers were independent from funders. Funders had no role in the study design, the collection, analysis, and interpretation of data, the writing of the report, and the decision to submit the article for publication. Competing interests: All authors have completed the ICMJE uniform disclosure form at www.icmje.org/coi_disclosure.pdf and declare: no support from any organisation for the submitted work; no financial relationships with any organisations that might have an interest in the submitted work in the previous three years; no other relationships or activities that could appear to have influenced the submitted work. Ethical approval: The study is conducted according to the Declaration of Helsinki guidelines and was approved by the Institutional Review Board of the French Institute for Health and Medical Research (IRB Inserm n°0000388FWA00005831), the Commission Nationale de l’Informatique et des Libertés (CNIL n°908450/n°909216/ n°1460707), and the Consultation Committee for the Protection of Participants in Biomedical Research (C09-42 on 5 May 2010). Electronic informed consent is obtained from each participant. Data sharing: No additional data are available.
The guarantor (MT) affirms that the manuscript is an honest, accurate, and transparent account of the study being reported; that no important aspects of the study have been omitted; and that any discrepancies from the study as planned have been explained. This is an Open Access article distributed in accordance with the Creative Commons Attribution Non Commercial (CC BY-NC 4.0) license, which permits others to distribute, remix, adapt, build upon this work non-commercially, and license their derivative works on different terms, provided the original work is properly cited and the use is non-commercial. See: http://creativecommons.org/licenses/by-nc/4.0/. 1 GBD 2016 Risk Factors Collaborators. Global, regional, and national
comparative risk assessment of 84 behavioural, environmental and occupational, and metabolic risks or clusters of risks, 1990-2016: a systematic analysis for the Global Burden of Disease Study 2016. Lancet 2017;390:1345-1422. doi:10.1016/S0140-6736(17)32366-8
2 Mozaffarian D. Dietary and Policy Priorities for Cardiovascular Disease, Diabetes, and Obesity: A Comprehensive Review. Circulation 2016;133:187-225. doi:10.1161/ CIRCULATIONAHA.115.018585
on 2 April 2020 by guest. Protected by copyright.
http://www.bmj.com/