HAL Id: halshs-01425453
https://halshs.archives-ouvertes.fr/halshs-01425453
Preprint submitted on 3 Jan 2017
HAL is a multi-disciplinary open access archive for the deposit and dissemination of sci-entific research documents, whether they are pub-lished or not. The documents may come from teaching and research institutions in France or abroad, or from public or private research centers.
L’archive ouverte pluridisciplinaire HAL, est destinée au dépôt et à la diffusion de documents scientifiques de niveau recherche, publiés ou non, émanant des établissements d’enseignement et de recherche français ou étrangers, des laboratoires publics ou privés.
Sekou Keita, Jérôme Valette
To cite this version:
Sekou Keita, Jérôme Valette. Natives’ attitudes and immigrants’ unemployment durations. 2017. �halshs-01425453�
C E N T R E D'E T U D E S E T D E R E C H E R C H E S S U R L E D E V E L O P P E M E N T I N T E R N A T I O N A L
SÉRIE ÉTUDES ET DOCUMENTS
Natives’ attitudes and immigrants’ unemployment
durations
Sekou Keita
Jérôme Valette
Études et Documents n° 23
December 2016
To cite this document:
Sekou K., Valette J. (2016) “Natives’ attitudes and immigrants’ unemployment durations”,
Études et Documents, n° 23, CERDI.
http://cerdi.org/production/show/id/1836/type_production_id/1
CERDI
65 BD. F. MITTERRAND
63000 CLERMONT FERRAND – FRANCE
TEL.+33473177400
FAX +33473177428
2
The authors
Sekou Keita PhD in Economics
CERDI – Clermont Université, Université d’Auvergne, UMR CNRS 6587, 65 Bd F. Mitterrand, 63009 Clermont-Ferrand, France.
E-mail: sekou.theo.keita@gmail.com
Jérôme Valette
PhD Student in Economics
CERDI – Clermont Université, Université d’Auvergne, UMR CNRS 6587, 65 Bd F. Mitterrand, 63009 Clermont-Ferrand, France.
E-mail: jerome.valette@udamail.fr
Corresponding author: Jérôme Valette
This work was supported by the LABEX IDGM+ (ANR-10-LABX-14-01) within the program “Investissements d’Avenir” operated by the French National Research Agency (ANR).
Études et Documents are available online at: http://www.cerdi.org/ed Director of Publication: Vianney Dequiedt
Editor: Catherine Araujo Bonjean Publisher: Mariannick Cornec ISSN: 2114 - 7957
Disclaimer:
Études et Documents is a working papers series. Working Papers are not refereed, they constitute
research in progress. Responsibility for the contents and opinions expressed in the working papers rests solely with the authors. Comments and suggestions are welcome and should be addressed to the authors.
3
Abstract
Which factors determine the performance of immigrants in the destination country labor market? Evidence in the literature suggests that discrimination may be a barrier to the economic assimilation of immigrants. However, depending on their country of origin, immigrants are heterogeneous with respect to the discrimination they face. This paper investigates how the attitude of natives affects immigrants’ unemployment duration in Germany. Using individual level panel data from the German Socio Economic Panel from 1984 to 2012, we employ survival analysis methods to model immigrants’ unemployment duration. We find that lower trust levels of natives towards the citizens of a given country, measured using Eurobarometer surveys, positively influence the unemployment duration of immigrants originating from this country. We show that this result is not driven by origin-specific unobserved heterogeneity, and that it is robust to different definitions of unemployment and different specifications. The results of our paper highlight the fact that immigrants face different obstacles depending on their origin when it comes to integrating destination country labor markets.
Keywords
Immigrant workers, Unemployment duration, Discrimination.
JEL Codes
J61, J64, J71
Acknowledgment
We thank Michel Beine, Simone Bertoli, Herbert Brücker, Jean-Louis Combes, Vianney Dequiedt, Flore Gubert, Pascale Phélinas, Anne Viallefont, Pedro Vicente, Ekrame Boubtane and Ababacar Gueye for their helpful comments. We also thank Herbert Brücker for providing us data on immigration and unemployment rates in Germany. The dataset used in this paper was made available to us by the German Institute for Economic Research (DIW), Berlin. All remaining errors are our own responsibility.
1 Introduction
Germany is currently confronted with the challenge of integrating sizable inflows of foreign-born populations which include both economic migrants and refugees.1 The public debate on the reception of immigrants and asylum seekers sparked very divergent reactions within the German population, ranging from warm welcome demonstrations to violent protestations against this historical surge in foreign born population. Such mixed feelings about immigra-tion are not new and the integraimmigra-tion of the foreign-born populaimmigra-tion in the local labor market has been at the heart of concerns for decades. In this context, a question that is often overlooked is how the attitude of natives affects the integration of immigrants.
The fact that immigrants underperform natives in the labor market has been often ob-served in the literature (Borjas, 2014). Many potential explanations have been proposed, including immigrants’ lower ability, firms’ difficulties in properly assessing qualifications ob-tained in a foreign country, lack of language skills, or discrimination. Empirical evidence suggests that immigrants are indeed discriminated in the labor market (Kaas and Manger, 2012). However, immigrants from different countries of origin do not necessarily face the same obstacles in the destination country labor market. There is a gap in the literature when it comes to exploring the heterogeneity in terms of labor market discrimination against immigrants. In particular, a plausible but unexplored hypothesis is that different levels of trust that natives associate with immigrants depending on their country of origin might capture origin-specific discrimination. Indeed, trust can condition the willingness to engage in economic transactions with immigrants since trust is a prerequisite for contracts in the absence of complete information (Göran and Hägg, 1994).
While trust levels can affect different labor market outcomes such as wages and job quality, the focus of the present analysis is on unemployment spells for several reasons. First, we observe an over-representation of immigrants in the unemployed population. Indeed, while the unemployment rate stood at 4.5% for the German native population, it reached 9.2% among immigrants in 2014.2 We also observe a large heterogeneity by origin country. Second, prolonged unemployment spells bear high costs on society because of poorer health of the unemployed, skill depreciation, forgone tax incomes, slower assimilation, etc.
In this paper we investigate empirically whether trust levels that Germans associate with 1According to the Statistisches Bundesamt (German federal statistical office), 1,226,000 people immigrated to Germany in 2013, an increase of 146,000, or 13%, with respect to 2012. Source:https://www.destatis. de/EN/FactsFigures/SocietyState/Population/Migration/Current.html accessed on July 16, 2016. 2Source: Eurostat: http://ec.europa.eu/eurostat/statistics-explained/index.php/Migrant_
the citizens of an immigrants’ country of origin influence his or her unemployment duration. The rationale can be conveyed by a standard job search model in which discriminated groups of immigrants, captured by lower levels of trust, receive fewer job offers. As a consequence, immigrants who originate from countries which Germans perceive as less trustworthy end up with lower exit rates out of unemployment.3
We carry out the empirical analysis building on an individual-level panel dataset, the German Socio-Economic Panel (GSOEP). Specifically, we use monthly calendar information to construct labor market activity spells over the period 1984-2012. We then model immi-grant’s unemployment duration using Cox and Weibull proportional hazard models. We test whether the level of trust that Germans associate with an immigrants’ country of origin is a significant determinant of unemployment duration. Our measure for the level of trust is the share of Germans declaring in Eurobarometer surveys that citizens of the country in ques-tion are trustworthy. We exploit variaques-tion in levels of trust towards different origin countries both at the national and the regional level. Working at the regional level allows us to con-trol for origin-specific factors which account for the adverse consequences of selection into migration. Indeed, a major drawback of analyzing a self-selected stock-sample is that it ex-cludes potential migrants for whom discrimination is most costly. This in turn can confound the identification of the effect of discrimination on immigrant’s labor market outcome. In line with this concern, our analysis highlights the importance to overcome the identification challenge posed by varying self-selection patterns across origin countries.
The results of our analysis suggest that natives’ attitudes strongly influence the labor market outcomes of immigrants. In particular, our findings indicate that if Germans had the same positive attitudes towards Turkish citizens that they have towards Austrian citizens, Turkish migrants would see their average unemployment duration reduced by three months on average. Our results are robust to alternative specifications and to several definitions of unemployment and levels of aggregation of the variable capturing levels of trust. Furthermore, the results are at odds with a number of alternative explanations.
This paper is related to several strands of the literature. First, it contributes to the liter-ature investigating the determinants of immigrants’ performance on the destination country labor market. The seminal work by Chiswick (1978), dealing with the effects of American-ization on the earnings of immigrants, has given rise to a vast literature trying to understand 3Reducing the arrival rate of jobs offer has two opposed effects. On the one hand, the unemployment duration of discriminated workers decreases because they become less choosy and reduce their reservation wage. On the other hand, the lower expected number of occasions of leaving unemployment increases immigrant’s unemployment duration. van den Berg (1994) shows that under relatively weak conditions the latter effect dominates.
the labor market performance of immigrants in the destination country. Empirical results generally suggest that the ability to engage in social interactions with natives increases the labor market performance of immigrants. For instance, Aldashev et al. (2009) find that lan-guage proficiency significantly affects labor market participation, employment probability, and occupational choice of foreigners in Germany. The literature review by Constant and Zimmermann (2009) also suggests that ethnic identities and attitudes seem to have impli-cations for the economic performance of immigrants in the host country. With respect to immigrants’ ties to host and origin country, Constant and Zimmermann (2009) find that, conditional upon entering unemployment, those not attached to the host country but rather strongly attached to their country of origin reintegrate more slowly into the German labor market. The authors argue that this group of migrants exerts a relatively low search effort and that it has reservation wages above the level that would imply employment probabili-ties observed for other groups of migrants. Using the European Social Survey, Bisin et al. (2011) also find that non-EU immigrants in Europe with a strong ethnic identity experience a penalty with respect to labor market outcomes. However, Casey and Dustmann (2010) argue that home country identity and host country identity per se are not strong determinants of immigrants’ labor market outcomes in Germany. This suggests that the attitude of natives might also play an important role in the economic assimilation of immigrants.
A second strand of the literature related to this paper investigates how negative attitudes and discrimination affect individuals in their job search process. The economic literature on discrimination distinguishes two forms of discrimination. The first type of discrimination, well-known as taste discrimination, was first described in the seminal paper of Becker (1957). Taste discrimination occurs when members of a minority group are unequally treated re-garding members of a majority group despite identical characteristics. The second form of discrimination, namely statistical discrimination, tries to rationalize this unequal treatment. Phelps (1972), Arrow (1973) or Akerlof (1976) analyze discrimination across the informa-tional spectrum and signal theory. They argue that discrimination arises from the fact that employers lack information about the productivity of job applicants. It becomes therefore rational for them to use observable characteristics like gender or race to infer their productiv-ity, by using the average productivity of the group they belong to. Concerning immigrants, Baker and Benjamin (1994) document the existence of persistent differences in labor mar-ket outcomes and small rates of assimilation for different cohorts of immigrants in Canada. The authors argue that the role of discrimination cannot be ruled out. Evidence on im-portant wage differences between natives and immigrants is also found in Germany (Gundel
and Peters, 2007; Zibrowius, 2012). The literature suggests that observed wage gaps are not exclusively due to differences in productivity. Indeed, field experiments provide causal evidence that subjective perceptions of recruiters based on race or origin also play an impor-tant role (Bertrand and Mullainathan, 2004; Kaas and Manger, 2012; Biavaschi et al., 2013). Focusing more specifically on natives’ self-reported sentiments towards immigrants, Larsen and Waisman (2007) find that in Swedish municipalities with strong negative attitudes, well educated immigrants from developing countries suffer from a sizable income penalty. Fur-thermore, quasi-experimental evidence indicates that changes in natives attitudes reduce the attractiveness of the host country for immigrants. Based on a household survey, Friebel et al. (2013) find that xenophobic attacks in South Africa against immigrants from neighboring countries decreased the migration intention of household heads in Mozambique. In a similar vein, following a widely documented crime, De Coulon et al. (2016) also identify a significant effect of anti-immigrant attitudes on the intended duration of stay of Romanian migrants in Italy. Gould and Klor (2015) show that the 9/11 terrorist attacks induced a backlash against the Muslim community in the US, slowing their assimilation rate. However, Åslund and Rooth (2005) and Braakmann (2007) find that the variation in attitudes following the attacks of 9/11 did not cause a severe decline in job prospects of Muslims in the Swedish and German labor markets, respectively. In a more general review of the literature on the labor market outcomes of minority groups, Lang and Lehmann (2012) underline that assessing dif-ferences in terms of unemployment duration due to discrimination is rather puzzling from a theoretical perspective. Indeed, since standard job search models ignore the reaction of firms, one might expect that the labor market adjusts through wages and that differences in the exit rate out of unemployment between groups of workers cancel at equilibrium. However, more sophisticated equilibrium search-matching models show that longer unemployment duration for discriminated minority groups can exist at equilibrium. For instance, Rosén (1997) shows that groups of workers with a lower probability of being hired for a job for which they apply end up with lower wages and higher unemployment rate and that this equilibrium is stable. Furthermore, Lang and Lehmann (2012) show that a simple extension of the model by Rosén (1997) can also explain longer unemployment duration and higher turnover for discriminated groups.
A third strand of the literature related to this paper suggests that perceptions such as trust, rooted in group-specific cultural norms, beliefs, and values, strongly influence economic outcomes. For instance Nunn and Wantchekon (2011) demonstrate that the consequences of the slave trade in terms of mistrust between groups of population in Africa are still observable
nowadays. By conditioning the level of social capital and cooperation among agents, inher-ited trust facilitates economic transactions which is mirrored in macroeconomic outcomes such as economic development (Knack and Keefer, 1997; Fafchamps, 2006) and economic growth (Algan and Cahuc, 2010). Finally Guiso et al. (2009) show that bilateral trust be-tween European countries influences bilateral trade flows, portfolio investments, and direct investments.
The remainder of the paper is organized as follows. Section 2 introduces the data used in the analysis and Section 3 presents the descriptive statistics. Section 4 presents the empirical strategy and Sections 5 and 6 the main results and some robustness analysis, respectively. Finally, Section 7 draws the main conclusions.
2 Data
We use the German Socio-Economic Panel (GSOEP hereafter), the most extensive (still ongoing) tracking survey of private households and persons in Germany. Started in 1984 in the Federal Republic of Germany and extended to the German Democratic Republic in 1990,4 the GSOEP consists of several samples introduced in different years and targeting specific subgroups of the German population (see appendix Table A1). Samples B and D are the most relevant in the context of our analysis since they oversample households with immigration background.5
We combine annual longitudinal biographical information on immigrants with monthly calendar data in order to precisely reconstruct individual labor market activity over time. This information is then matched with German’s levels of trust towards the different coun-tries of origin of immigrants in the sample. Information on natives’ attitudes is taken from two particular surveys i.e. the Eurobarometer (for the years 1976-1997) and the European Election surveys (for the year 2004).
2.1 Labor market activity: The German Socio-Economic Panel
In each wave of the GSOEP, respondents are asked to provide information on their monthly activities of the previous year. Specifically, respondents are asked to choose among 11 differ-ent categories the ones corresponding to their main activities in each month. Figure A1 in 4With the exception of Berlin, our sample contains only regions from western Germany. This is due to thefact that these regions concentrate the bulk of surveyed immigrants.
the appendix provides an example taken from the questionnaire.
We build on this information to generate spells of activity for the year preceding the survey. In particular, we obtain individual-specific monthly activity spells by recoding the 11 activity categories into three labor market statuses: employed, unemployed, and out of labor force. Individuals are classified as employed in months in which they declared being either full-time employed or part-time employed. The definition of unemployment is less straightforward because of the difficulty to identify discouraged workers i.e. workers who are not officially registered as unemployed but who are still available for work.6 It is important to take this particular group into account in our analysis since those individuals could have left the active population precisely because of discrimination. Our sample of analysis consists of individuals officially registered as unemployed as well as individuals who are not officially registered as unemployed but who declare that they are actively looking for work and/or are available for work in the two weeks following the interview. Both pieces of information are taken from the annual biographical questionnaires. We allocate these annual answers to all months of the survey year. Hence, individuals who do not correspond to either activity status are con-sidered out of the labor force and are not included in the analysis. In order to assess the sensitivity of our results to the definition of unemployment, we construct alternative samples with different definitions of unemployment (see Section 6.2).
2.2 Trust data: Eurobarometer and European Election surveys
The trust data are taken from different surveys sponsored by the European Commission and designed to measure public opinions on various topics. They were conducted on a representative sample of the total population of age sixteen and older (about 1,000 individuals per country and per year). Specifically, we use waves of Eurobarometer surveys between 1976 and 1997 that collected self-reported trust information of Germans with respect to citizens from 33 countries; we complement this information with the European Election Survey which collected similar information in 2004.7 In the Eurobarometer surveys, respondents are asked 6The International Labour Organization (ILO) resolutions concerning economically active population, em-ployment, unemployment and underemployment adopted by the 13th International Conference of Labour Statisticians, October 1982, paragraph 10, state the following definition: The unemployed comprise all per-sons above a specified age who during the reference period were: (i) without work, that is, were not in paid employment or self-employment during the reference period; (ii) currently available for work, that is, were available for paid employment or self-employment during the reference period; and (iii) seeking work, that is, had taken specific steps in a specified recent period to seek paid employment or self-employment.7Unfortunately, Eurobarometer surveys and the European Election Survey do not provide information on the nativity status of respondents. The surveys are designed to capture the opinion of the resident population. Hence it is possible that the opinion of some immigrants were taken into account. According to the 2011
the following question: “I would like to ask you a question about how much trust you have in people from various countries. For each, please tell me whether you have a lot of trust, some trust, not very much trust, or no trust at all”. To construct a measure of bilateral trust from Germans towards other nations, we use the share of positive answers among the total answers i.e. the share of Germans who answered “very trustworthy” or “fairly trustworthy”. In the waves 1995 and 1997 of the Eurobarometer surveys and in the European Election Survey in 2004, the question is slightly different. The wording of the question is “do you trust citizens from country X?”. Only two answers were possible: “I trust them” or “I do not trust them”. For these years, the share of those who answered “I trust them” is used as an indicator of positive opinions.
We are interested in the general level of trust that Germans have towards individuals from different countries of origin. There may be some ambiguity in the interpretation of this measure of trust. Guiso et al. (2009) argue that the correlation with other questions in separate surveys suggests that the level of trust captured in Eurobarometer surveys reflects the subjective probability that a random person from a given country is trustworthy rather than the respondent’s ability to identify trustworthy people in a different country.8
The factors that shape the perception of the trustworthiness towards citizens from a given country have in common that they are rather stable over time. This is illustrated in Figure A2 in appendix. The upper figure shows that the evolution of levels of trust over time is driven by common shocks that do not affect the ranking between countries very much. This appears even more clearly in the lower figure where we partial out year fixed effects that capture shocks such as economic or political conditions in Germany affecting general levels of trust Germans have towards others. This is in line with the literature review on public attitudes towards immigration by Hainmueller and Hopkins (2014) who find that there is little accumulated evidence that immigration-related attitudes are based on personal economic situations and that attitudes seem to be rather driven by symbolic and cultural concerns. Differences in Census, foreigners represented around 10 percent of the German population and diasporas for single origin countries (including German citizens with foreign background i.e. not only migrants strictly speaking) do not reach 4 percent of the total population. Therefore the share of positive opinions we use should not be influenced in a major way by the opinions of migrants.
8Specifically, Guiso et al. (2009) mention a sample of 1,990 individuals who were asked the two following questions: (i) “Suppose that a random person you do not know personally receives by mistake a sum of 1,000 euros that belong to you. He or she is aware that the money belongs to you and knows your name and address. He or she can keep the money without incurring in any punishment. According to you what is the probability (a number between zero and 100) that he or she returns the money?” and (ii) “How good are you (very good, good, not very good, not good at all) in detecting people who are trustworthy?” They find that the first question is highly statistically correlated with the measure of trust used in this paper, but the second one is not.
levels of trust are indeed determined by many factors including historical events such as wars, cultural differences, differences in political systems, and the quality of law and its enforcement (Guiso et al., 2009).9 Hence we obtain our variable of interest by calculating time-invariant origin-specific mean values of the share of Germans who declare that they trust citizens of the origin country in question. We calculate this variable both at the national and regional level. One could be concerned that the variable T rust computed at the regional level reflects statistical noise due to the small number of annual respondents when the Eurobarometer surveys are split between 11 German regions. This concern is mitigated by the fact that the mean value is computed over several waves of Eurobarometer surveys. On average, the mean value of the T rust variable for each region is computed over a sample of 422 individuals.
3 Descriptive statistics
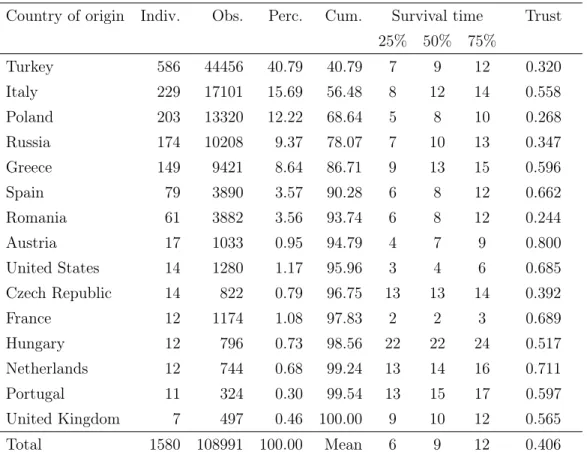
Our main sample of analysis is restricted to unemployment spells that do not exceed 48 months.10 This leaves us with a sample of 108,991 individual-month observations between January 1984 and December 2012. The sample contains 1,580 individuals originating from 15 countries and located in 11 regions (Länder) in Germany. On average, 40.6 percent of Germans declare that they trust citizens that originate from the countries included in our sample of analysis (see Table 2). This mean value hides a lot of variability between countries of origin: Table 1 shows that only 24.4 percent of Germans perceive Romanians as trustworthy while as much as 80 percent perceive Austrians as trustworthy.
Figure A3 in the appendix reveals that trust towards citizens of a given country also varies greatly between regions. It is interesting to note that the variability across regions is in line with the average at the country level: the minimum value and maximum of average levels of trust at the regional level are generally within a 20 percentage points range of the country level mean. Hence, the relative level of trust towards citizens of a given country is reflected at the regional level with varying intensity.
9Table A7 in Appendix shows the Pearson correlations between our variable T rust and some measures of distances computed by Spolaore and Wacziarg (2009). We clearly see that T rust is highly correlated with indexes of cultural, genetic and religious distance.
10We suspect unemployment spells above this threshold to be unusual or potentially artificial (due to early retirement for example). Nonetheless, such observations correspond to less than one percent of the total observations and all results are robust with estimates including unemployment spells above this threshold.
Table 1: Origin countries of immigrants
Country of origin Indiv. Obs. Perc. Cum. Survival time Trust
25% 50% 75% Turkey 586 44456 40.79 40.79 7 9 12 0.320 Italy 229 17101 15.69 56.48 8 12 14 0.558 Poland 203 13320 12.22 68.64 5 8 10 0.268 Russia 174 10208 9.37 78.07 7 10 13 0.347 Greece 149 9421 8.64 86.71 9 13 15 0.596 Spain 79 3890 3.57 90.28 6 8 12 0.662 Romania 61 3882 3.56 93.74 6 8 12 0.244 Austria 17 1033 0.95 94.79 4 7 9 0.800 United States 14 1280 1.17 95.96 3 4 6 0.685 Czech Republic 14 822 0.79 96.75 13 13 14 0.392 France 12 1174 1.08 97.83 2 2 3 0.689 Hungary 12 796 0.73 98.56 22 22 24 0.517 Netherlands 12 744 0.68 99.24 13 14 16 0.711 Portugal 11 324 0.30 99.54 13 15 17 0.597 United Kingdom 7 497 0.46 100.00 9 10 12 0.565 Total 1580 108991 100.00 Mean 6 9 12 0.406
Source: Author’s elaboration on GSOEP panel data, Eurobarometer and European Election Survey data. Survival time is the time elapsed before failure i.e. exit out of unemployment. It is interpreted as the number of months necessary for x% of the unemployed population to find a job. Trust is the mean of the share of Germans who expressed that they trust citizens from a given country, calculated by country of origin.
This can be explained by the heterogeneity within German regions with respect to open-ness, inherited cultural values and beliefs, which in turn translates into heterogeneity in terms of norms such as family values and attitudes more in general (Bertram and Nauck, 1995; Silbereisen and von Eye, 1999; Bertram, 2013; Bertram et al., 2013, for references).
The question at the heart of this paper is whether varying levels of trust that Ger-mans associate with different countries of origin influence the unemployment duration of immigrants. On average, unemployment spells last for 25.76 months in our main sample of analysis.11 However, immigrants from different countries of origin experience very different average lengths of unemployment spells. For instance, individuals who originate from Turkey have unemployment spells of 26.53 months on average while the corresponding figure stands 11This figure is reduced to an average of 21.73 months if we consider only unemployment spells that end with
at 15.49 months for individuals originating from the US. As can be observed in Table 1, longer average spells of unemployment tend to coincide with lower perceived trustworthiness by Germans. Indeed, this table shows that it takes on average 13 months for 75 percent of unemployed immigrants from Russia (low level of trust) to escape unemployment while the corresponding figure for Austrian immigrants (high level of trust) is only nine months.
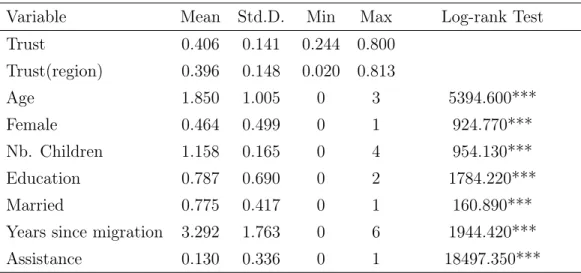
Table 2: Descriptives statistics
Variable Mean Std.D. Min Max Log-rank Test
Trust 0.406 0.141 0.244 0.800 Trust(region) 0.396 0.148 0.020 0.813 Age 1.850 1.005 0 3 5394.600*** Female 0.464 0.499 0 1 924.770*** Nb. Children 1.158 0.165 0 4 954.130*** Education 0.787 0.690 0 2 1784.220*** Married 0.775 0.417 0 1 160.890***
Years since migration 3.292 1.763 0 6 1944.420***
Assistance 0.130 0.336 0 1 18497.350***
Source: Author’s elaboration on GSOEP panel data, Eurobarometer and European Election Survey data. Trust is the mean of the share of Germans who expressed that they trust citizens from a given country, calculated by country of origin. Age is a categorical variable with four groups: younger than 25 (0), between 25 and 34 (1), between 35 and 44 (2) and above 44 years old (3). Female is a dummy variable equal to one if the respondent is a woman and zero otherwise. Nb. children is a categorical variables with five groups: no child (0), One child (1), two children (2), three children (3) and four children (4) present in the household. Education is a categorical variable with three groups: low ISCED (0), middle ISCED (1) and high ISCED (2). Married is a dummy variable equal to one if the respondent is married and zero otherwise. Years since migration to Germany is a categorical variable with seven groups: less than 5 years (0), between 5 and 9 years (1), between 10 and 14 years (2), between 15 and 19 years (3), between 20 and 24 years (4), between 25 and 29 years (5) and 30 years or more (6). Assistance is a dummy variable equal to one if the respondent received social assistance and zero otherwise. The log-rank test compares estimates of the hazard functions of the several groups at each time for categorical variables. The null hypothesis assumes no difference between the survival curves of the different groups.
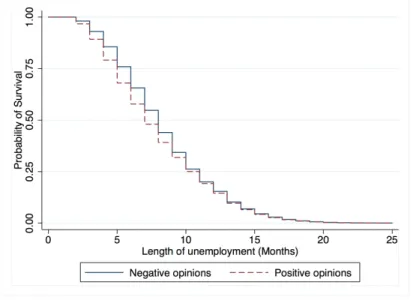
Figure 1: Kaplan-Meier estimates of immigrant’s unemployment duration by natives’ attitudes levels
Source: Author’s elaboration on GSOEP panel data, Eurobarometers and European Election Survey data. The Kaplan-Meier estimator is a non parametric estimate of the survivor function, which is the probability of failing after the month m (Cleves et al., 2010). The survival function (defined as in Eq. 2) reports the probability of remaining unemployed beyond the month m (There was no failure before m). At any month m, it gives the percentage of the population remaining unemployed. Positive and negative opinions refer respectively to the mean of the share of Germans who expressed that they trust or distrust citizens from a given country.
A similar picture is conveyed by Figure 1 which presents survival functions associated with different levels of the variable T rust. Indeed, when the share of Germans who perceive the country of origin as trustworthy exceeds 50 percent, the probability of exiting unemployment is higher than when this figure is below 50 percent. However, Table 1 also shows that the relationship between the survival time and the level of trust is not systematic. This is not surprising since individuals from different countries of origin are very different in terms of observable characteristics, such as age and years of education, that may influence the duration of unemployment spells (see Table A3 in the appendix). This calls for a more sophisticated analysis that can account for such confounding factors.
4 Empirical Analysis
This section introduces our empirical analysis. After presenting the duration model, we discuss the implications of self-selection of migrants for our analysis, which is due to the stock-sample nature of our dataset. We also discuss how we address this issue by looking at
the effect of natives’ attitudes at the regional level.
4.1 Duration model
We model immigrants’ unemployment duration in Germany using survival analysis methods where unemployment duration is reported in months. We define a failure as the transition from unemployment to part-time or full-time employment. Unemployment spells that are not stopped by hiring are treated as right-censored. Let M be a non-negative random variable, called the survival time, denoting the time spent unemployed expressed in number of months. The cumulative distribution of M, F (m) is such as:
F (m) = P r[M m] =
Z m 0
f (s)ds (1)
with f(m) its density function. We define S(m), the survival function, as the probability for an individual surviving (remaining unemployed) beyond month m. It is therefore the probability that the individual does not find a job prior to m. The survival function can be written as follows:
S(m) = P r[M m]
= 1 F (m) (2)
This function shows therefore which proportion of unemployed immigrants remains unem-ployed (i.e. experiences no failure) prior to a given month m. At the heart of duration models, hazard functions focus on the instantaneous probability that an individual finds a job in a given month m, conditional on the fact that he had remained unemployed until this month.12 Our hazard function is therefore defined such as:
h(m) = lim m!0 P r(m + m > M > m|M > m) m = f (m) S(m) (3)
Proportional hazard models (PH) assume that the hazard faced by an individual i, which varies in response to individual’s characteristics, is multiplicatively proportional to a baseline hazard h0(m), faced by all individuals. If we define xim as a vector of covariates with the 12Months vary from 1 (January 1984) to 348 (December 2012). Individuals enter the analysis in the first month
subscripts i for individual and m for month, our main specification can be written such as: hi(m|T rusto, xim) = h0(m) exp{ 0+ 1T rusto+ 0xxim} (4) where T rusto represents, for an individual i, Germans’ trust level towards his or her origin country o. The coefficient of interest 1 captures the effect of native’s attitudes on immi-grants’ unemployment duration. A positive 1 means that a higher level of Germans’ trust towards the origin country of a given individual increases his instantaneous probability to leave unemployment i.e reduces his expected length of unemployment.13 Note that our base-line specification takes into account year, seasonal and regional fixed-effects and that xim, the full vector of individual characteristics includes age, sex, education, marital status, number of years since migration and whether the unemployed received social assistance.14 Our em-pirical analysis uses two different specifications in order to estimate these hazards.15 These two specifications differ in the assumptions made about the hazard shape over time. First, the semi-parametric Cox-proportional hazard model makes no assumption on time depen-dency.16 Thus, hazards can be either an increasing, a decreasing, or a constant function of time. Second, we use the parametric Weibull model which allows us to rewrite the hazard function such as:17
hi(m|T rusto, xim) = h0(m) exp{ 0+ 1T rusto+ x0xim} = pmp 1exp{ 0 + 1T rusto+ x0xim}
(5) with p a parameter, estimated from the data and which models the time dependency of the hazard. If p > 1 (p < 1) then the hazard is an increasing (decreasing) function of time. Also, our model allows for multiple unemployment spells. In order to avoid time-dependency for the unemployment spells of the same individual over time, we correct the covariance matrix of the estimators by clustering the errors at the individual level (Lin and Wei, 1989).18 13Our tables report hazard ratios exponentiated coefficients. Different from traditional hazard ratios,
exponen-tiated coefficients have not to be compared with one but with zero.
14All these categorical variables have a p-value below 0.01 for the log-rank test of equality. The null hypothesis of the log-rank test assumes equality of survival distributions for each level of a categorical variable. Non parametric estimates of covariates with the Kaplan-Meier estimator are available in appendix Figure A4. All results remain unchanged when the variable assistance is removed from the regression.
15Irrespective of the model we use, hazard functions are estimated using a maximum likelihood approach. 16Semi-parametric models imply however that the effect of covariates is assumed to take a certain form, by
opposition to non parametric models, as the Kaplan-Meier estimator.
17The Weibull model is retained against the gamma, log-logistic, log-normal and exponential models, regarding its lower AIC and BIC criteria.
18Successive failures are assumed to be unordered and of the same type. 40% of the individuals in the baseline sample experienced only one unemployment spell.
4.2 Empirical strategy
Equation 5 is useful for looking at cross-country differences. However, it does not account for origin-specific factors that might influence the exit rate of immigrants out of unemployment. Indeed, an important concern arises from the fact that our analysis builds on a stock-sample of migrants who have chosen to migrate to Germany despite the potential discrimination they would face. Specifically, discrimination might influence the composition of the self-selected group of observed immigrants because different labor market opportunities may lead immigrants from highly discriminated origin countries to be drawn from a different part of the population than their counterparts from less discriminated origin countries.
To the extent that discrimination influences the distribution of wage offers faced by poten-tial migrants, the standard Roy model (Roy, 1951), applied to the analysis of the migration decision by Borjas (1991), predicts that, holding other determinants of individual earnings constant, immigrants originating from a highly discriminated origin country will have on average lower reservation wages compared to immigrants originating from less-discriminated origin countries. This in turn leads to higher acceptance rates of job offers and lower un-employment durations.19 The self-selection of migrants regarding discrimination levels at destination implies that it is crucial to control for origin-specific effects.20
In order to overcome the adverse consequences of selection at the national level, we esti-mate a second equation which considers natives’ attitudes at the regional level. In particular, we compute the variable T rustor for 15 origin countries o in each German region r. Our es-timated equation becomes:
hi(m|T rustor, xim) = pmp 1exp{ 0 + 1T rustor+ x0xim} (6) This specification exploits the variation between origin-region pairs. It allows us to control 19Notice that a different argument could lead to the same prediction. For instance, if migrants originating from countries which Germans associate with lower levels of trust also have higher monetary migration costs, the migration in itself would deplete their savings available for the job search period, thus reducing their optimal reservation wage. As a result such migrants would have lower reservation wages as well as shorter unemployment durations.
20Lower levels of trust can also influence the selection patterns of immigrants who decide to leave Germany. Individuals suffering the most from discrimination may have greater incentives to leave Germany for another destination or returning back to their origin country. This would imply that the remaining pool of immigrants in Germany is composed of those who are able to mitigate the effects of discrimination due to lower origin-specific trust. Our data reveal that around 10 percent of our sample corresponds to migrants who left Germany between 1984 and 2012. Surprisingly, we found that the mean of the variable T rust is higher for this group (around 50 percent of positive opinions) compared to the mean value for stayers (around 40 percent of positive opinions). This suggests that return migrants are possibly drawn disproportionately more from origin countries towards which Germans express higher trust levels.
for unobserved origin-specific factors such as quality of education and self-selection patterns by including origin fixed-effects interacted with year fixed-effects. We expect therefore an increase in our coefficient of interest 1. It is worth noting that institutions such as col-lective bargaining and unions can mitigate the downward bias induced by the selection at the national level since they result in a compression of the wage distribution, lower reserva-tion wages in groups of highly discriminated immigrants are not sufficient to fully offset the unemployment effect of lower job offer rates.21 Indeed, immigrants whose reservation wage is lower than the minimum wage offered by firms cannot increase their exit probability out of unemployment by taking advantage of job offers between their reservation wage and the minimum wage.
Finally, a legitimate concern would be that a similar self-selection effect might occur at the regional level. Indeed, as long as we cannot fully correct for self-selection into Ger-man regions, our empirical analysis can only determine a conservative estimate of the effect of discrimination on unemployment spells if the migrants in low-trust regions reduce their reservation wage. Figure A5 in the appendix shows that observable characteristics are not systematically different for migrants from a given origin country when we compare regions that express relatively higher levels of trust compared to regions that express relatively low levels of trust towards citizens of this origin country. Hence this Figure suggests that mi-grants in our sample do not systematically self-select into regions that express higher levels of trust towards citizens of their origin country. Although it is not necessarily informative about self-selection on unobserved characteristics, the Figure reduces the concerns regarding self-selection at the regional level.
5 Results
This section presents the results of our empirical analysis starting first with the results ob-tained with the variable T rust at the national level and second with the variable T rust(region) at the regional level. This allows us to discuss the role played by origin-specific unobserved heterogeneity such as self-selection of migrants along the lines discussed in the previous section. Finally, we discuss some threats to identification that could confound our interpre-tation of the observed correlation between natives’ attitudes and immigrant’s unemployment 21Collective bargaining is very common in Germany and labour unions play an important role in the determina-tion of the wages (Franz and Pfeiffer, 2006). This may lead to a compression of wages at the lower end of the distribution even in non-union firms (Blau and Kahn, 1999). Kahn (2000) documents a positive relationship between collective bargaining coverage or union density and low relative employment for less-skilled workers.
duration.
5.1 Trust at the national level
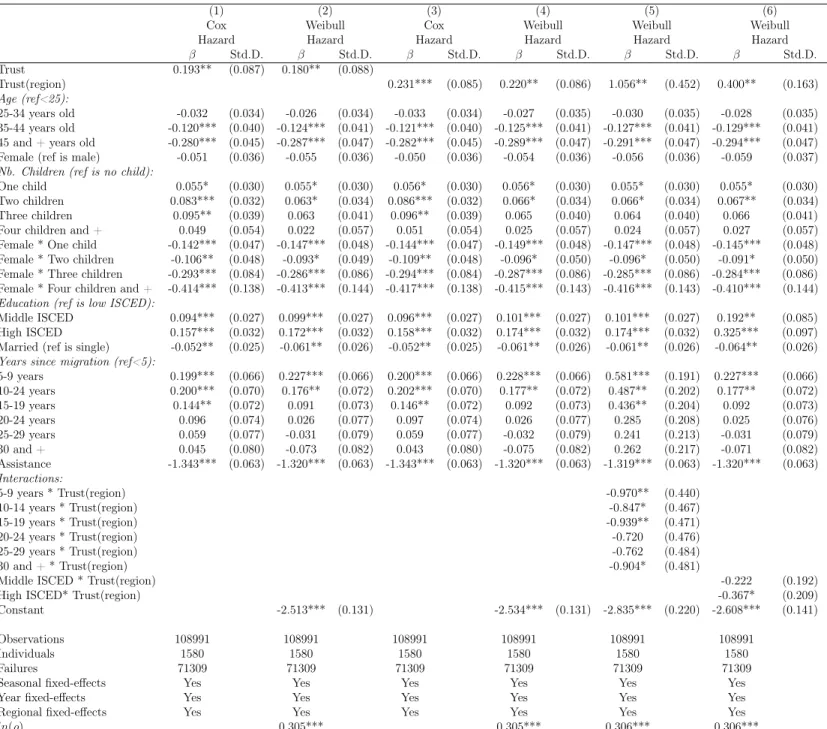
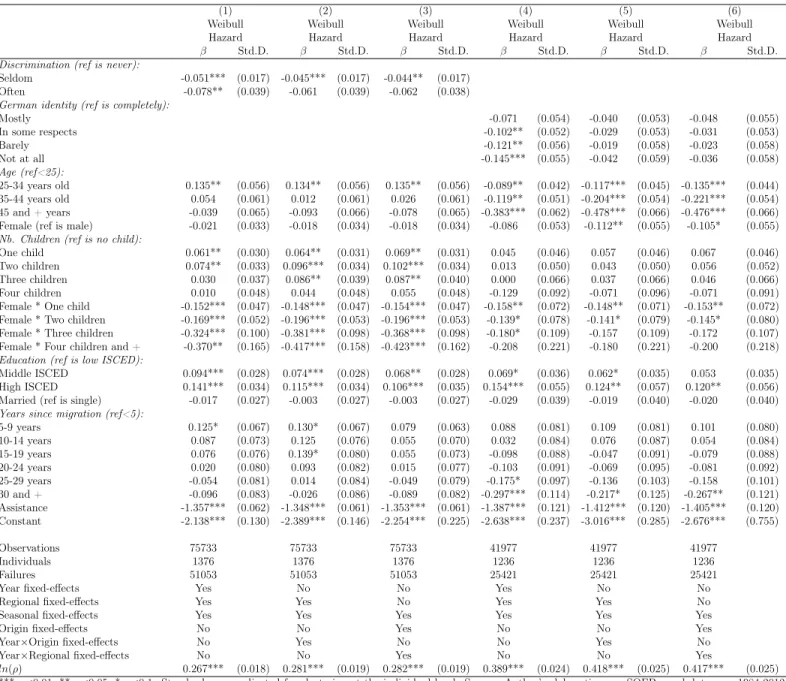
Columns (1) and (2) in Table 3 report the effect of Germans’ trust levels towards the different countries of origin of migrants at the national level. It is worth noticing that these estimates include a full set of individual controls and several sets of fixed-effects. Focusing on our vari-able of interest, the first two columns also show that regardless of the estimator we employ, a higher level in natives’ trust towards a given origin country is associated with a higher instan-taneous exit probability out of unemployment for immigrants originating from this country.22 This effect is significant at the 5% level in both the Cox and Weibull models. The evidence that lower levels of origin-specific trust are associated with longer unemployment spell for immigrants suggests that immigrants originating from different countries experience diverse barriers to entry when it comes to integrating into the German labor market. Nevertheless, it is important to bear in mind that the coefficients of interest in columns (1) and (2) do not ac-count for the origin-specific self-selection process which, according to a standard Roy model, leads the most discriminated immigrants to be drawn from the lower part of the reservation wage distribution in their home country. Hence these coefficients are potentially downward biased. Regarding individual level variables, it clearly appears that, being aged, being fe-male, having many children, or being married comparatively to single persons, increases immigrants’ unemployment duration.23 Conversely, we observe that conditional upon being unemployed, highly educated immigrants have a higher instantaneous probability of finding a job comparatively to less educated immigrants. The hazard of exiting unemployment also increases with years since immigration, a standard result in the assimilation literature. This is not the case for immigrants receiving financial assistance from the government who expe-rience longer length of unemployment. This result is standard in the literature since benefits may reduce the income gain associated with a transition from unemployment to employment (Bover et al., 2002; Røed and Zhang, 2003).
22The estimated shape parameter ln(⇢), in Weibull regressions is significantly positive which means that the probability for immigrants to find a job increases with time in unemployment.
Table 3: Natives’ attitudes and immigrant’s unemployment duration. Semi-parametric and parametric estimates.
(1) (2) (3) (4) (5) (6)
Cox Weibull Cox Weibull Weibull Weibull Hazard Hazard Hazard Hazard Hazard Hazard
Std.D. Std.D. Std.D. Std.D. Std.D. Std.D. Trust 0.193** (0.087) 0.180** (0.088) Trust(region) 0.231*** (0.085) 0.220** (0.086) 1.056** (0.452) 0.400** (0.163) Age (ref<25): 25-34 years old -0.032 (0.034) -0.026 (0.034) -0.033 (0.034) -0.027 (0.035) -0.030 (0.035) -0.028 (0.035) 35-44 years old -0.120*** (0.040) -0.124*** (0.041) -0.121*** (0.040) -0.125*** (0.041) -0.127*** (0.041) -0.129*** (0.041) 45 and + years old -0.280*** (0.045) -0.287*** (0.047) -0.282*** (0.045) -0.289*** (0.047) -0.291*** (0.047) -0.294*** (0.047) Female (ref is male) -0.051 (0.036) -0.055 (0.036) -0.050 (0.036) -0.054 (0.036) -0.056 (0.036) -0.059 (0.037) Nb. Children (ref is no child):
One child 0.055* (0.030) 0.055* (0.030) 0.056* (0.030) 0.056* (0.030) 0.055* (0.030) 0.055* (0.030) Two children 0.083*** (0.032) 0.063* (0.034) 0.086*** (0.032) 0.066* (0.034) 0.066* (0.034) 0.067** (0.034) Three children 0.095** (0.039) 0.063 (0.041) 0.096** (0.039) 0.065 (0.040) 0.064 (0.040) 0.066 (0.041) Four children and + 0.049 (0.054) 0.022 (0.057) 0.051 (0.054) 0.025 (0.057) 0.024 (0.057) 0.027 (0.057) Female * One child -0.142*** (0.047) -0.147*** (0.048) -0.144*** (0.047) -0.149*** (0.048) -0.147*** (0.048) -0.145*** (0.048) Female * Two children -0.106** (0.048) -0.093* (0.049) -0.109** (0.048) -0.096* (0.050) -0.096* (0.050) -0.091* (0.050) Female * Three children -0.293*** (0.084) -0.286*** (0.086) -0.294*** (0.084) -0.287*** (0.086) -0.285*** (0.086) -0.284*** (0.086) Female * Four children and + -0.414*** (0.138) -0.413*** (0.144) -0.417*** (0.138) -0.415*** (0.143) -0.416*** (0.143) -0.410*** (0.144) Education (ref is low ISCED):
Middle ISCED 0.094*** (0.027) 0.099*** (0.027) 0.096*** (0.027) 0.101*** (0.027) 0.101*** (0.027) 0.192** (0.085) High ISCED 0.157*** (0.032) 0.172*** (0.032) 0.158*** (0.032) 0.174*** (0.032) 0.174*** (0.032) 0.325*** (0.097) Married (ref is single) -0.052** (0.025) -0.061** (0.026) -0.052** (0.025) -0.061** (0.026) -0.061** (0.026) -0.064** (0.026) Years since migration (ref<5):
5-9 years 0.199*** (0.066) 0.227*** (0.066) 0.200*** (0.066) 0.228*** (0.066) 0.581*** (0.191) 0.227*** (0.066) 10-24 years 0.200*** (0.070) 0.176** (0.072) 0.202*** (0.070) 0.177** (0.072) 0.487** (0.202) 0.177** (0.072) 15-19 years 0.144** (0.072) 0.091 (0.073) 0.146** (0.072) 0.092 (0.073) 0.436** (0.204) 0.092 (0.073) 20-24 years 0.096 (0.074) 0.026 (0.077) 0.097 (0.074) 0.026 (0.077) 0.285 (0.208) 0.025 (0.076) 25-29 years 0.059 (0.077) -0.031 (0.079) 0.059 (0.077) -0.032 (0.079) 0.241 (0.213) -0.031 (0.079) 30 and + 0.045 (0.080) -0.073 (0.082) 0.043 (0.080) -0.075 (0.082) 0.262 (0.217) -0.071 (0.082) Assistance -1.343*** (0.063) -1.320*** (0.063) -1.343*** (0.063) -1.320*** (0.063) -1.319*** (0.063) -1.320*** (0.063) Interactions: 5-9 years * Trust(region) -0.970** (0.440) 10-14 years * Trust(region) -0.847* (0.467) 15-19 years * Trust(region) -0.939** (0.471) 20-24 years * Trust(region) -0.720 (0.476) 25-29 years * Trust(region) -0.762 (0.484) 30 and + * Trust(region) -0.904* (0.481)
Middle ISCED * Trust(region) -0.222 (0.192)
High ISCED* Trust(region) -0.367* (0.209)
Constant -2.513*** (0.131) -2.534*** (0.131) -2.835*** (0.220) -2.608*** (0.141) Observations 108991 108991 108991 108991 108991 108991
Individuals 1580 1580 1580 1580 1580 1580
Failures 71309 71309 71309 71309 71309 71309
Seasonal fixed-effects Yes Yes Yes Yes Yes Yes
Year fixed-effects Yes Yes Yes Yes Yes Yes
Regional fixed-effects Yes Yes Yes Yes Yes Yes
ln(⇢) 0.305*** 0.305*** 0.306*** 0.306***
*** p<0.01, ** p<0.05, * p<0.1. Standard errors in parentheses adjusted for clustering at the individual level. Source: Author’s elaboration on SOEP panel data over 1984-2012, Eurobarometer and European Election Survey data. ln(⇢) is the estimated shape parameter. Trust is the mean of the share of Germans who expressed that they trust citizens from a given country, calculated by country of origin. Age is a categorical variable with four groups: younger than 25 (0), between 25 and 34 (1), between 35 and 44 (2) and above 44 years old (3). Female is a dummy variable equal to one if the respondent is a woman and zero otherwise. Nb. children is a categorical variables with five groups: no child (0), One child (1), two children (2), three children (3) and four children (4) present in the household. Education is a categorical variable with three groups: low ISCED (0), middle ISCED (1) and high ISCED (2). Married is a dummy variable equal to one if the respondent is married and zero otherwise. Years since migration to Germany is a categorical variable with seven groups: less than 5 years (0), between 5 and 9 years (1), between 10 and 14 years (2), between 15 and 19 years (3), between 20 and 24 years (4), between 25 and 29 years (5) and 30 years or more (6). Assistance is a dummy variable equal to one if the respondent received social assistance and zero otherwise.
5.2 Trust at the regional level
From columns (3) to (5) in Table 3, we estimate the effect of Trust at the regional level. This has the advantage of increasing the variability and then to improve the precision of the estimated parameters. Indeed, additional variability is obtained from the differences observed between the 15 origin countries across 11 regions.24 Columns (3) and (4) of Table 3 show a positive and significant effect of T rust(region) on the probability to leave unemployment. The effect is statistically significant at the 1 and 5% level respectively.25 It is also worth noticing that in column (5), years since migration reduce the effect of natives’ attitudes on immigrants’ hazard ratios since the interaction term between the two variables is statistically significant. In the same way, column (6) suggests that the marginal effect of Germans’ attitudes is not conditional on the different levels of education at the five percent level of significance.
As discussed in Section 4.2, we are concerned that the estimated coefficient of our variable T rust(region)may reflect country-specific factors such as different incentives to migrate that determine the selection of migrants in the population of the country of origin or the fact that different immigrants have faced different quality levels of education in their origin countries. Table 4, column (1), includes therefore origin fixed-effects interacted with year fixed-effects which absorb the effect of all the time-varying origin-specific characteristics which affect im-migrant’s unemployment duration, and which do not change between German regions. We observe that, while the coefficient remains significant at the one percent level, its magnitude dramatically increases. This is in line with the theoretical intuition that because discrimi-nation reduces the expected gains from migration, migrants from more discriminated origins self-select into the lower parts of the origin country reservation wage distribution. Not ac-counting for the origin-specific factors reduces therefore significantly the estimated impact of native’s attitudes on immigrant’s unemployment duration. In terms of magnitude, if Ger-mans had the same positive attitudes towards Turkish citizens as they have towards Austrian citizens, Turkish migrants would see their average unemployment duration reduced by three months on average.26 Thus, the effect of natives’ attitudes is not just statistical but also an 24We actually use 112 out of 165 possible origin-region pairs because migrants from some origins are not
observed in all regions.
25Results with T rust and T rust(region) are robust to estimates excluding Turkish immigrants, the largest group of immigrants in Germany. Results are available upon request.
26Interpretations in terms of duration are obtained using Weibull estimates in the accelerated failure-time (AFT) metric. AFT model no longer models hazards (as parametric proportional hazards Weibull models) but the logarithm of the duration. Still, the results are perfectly equivalent in the two metrics since AF T =
P H
economically significant effect.
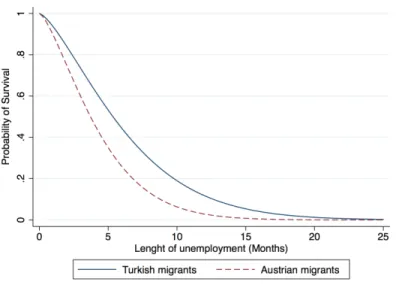
Figure 2: Predicted survival functions of unemployment
Source: Author’s elaboration on SOEP panel data over 1984-2012, Eurobarometer and European Election Survey data. The survival function (defined as in Eq. 2) reports the probability of remaining unemployed beyond the month m. At any month, the survival function gives the percent of the population remaining unemployed. These predictions are obtained using the estimated coefficients reported in the column (2) of the Table 4 with the Weibull parametric estimator and using the average value of the control variables.
In order to control for labor market conditions at destination, we introduce in column (2) regional fixed-effects interacted with year fixed-effects which account for all the time-varying region unobserved characteristics that affect immigrant’s unemployment duration and which do not vary between origin countries. We prevent therefore our estimations to be biased by yearly heterogeneous dynamics in regional labor markets. Indeed, regions with more favorable labor markets can attract particular groups of immigrants. Still, the coefficient of T rust(region) is highly positive and significant suggesting that negative natives’ attitudes towards immigrants hinder their chances of finding a job more quickly. Figure 2 depicts the predicted survival functions of the immigrant groups with one of the highest and lowest levels of trust namely, Turkish and Austrian immigrants for this last estimate. As expected, the survival function of Austrian immigrants dominates the survival function of Turkish immigrants regardless of the unemployment duration. After seven months of unemployment duration, our model predicts that more than 80 percent of Austrian unemployed would have found a job against less than 65 percent for Turkish immigrants.
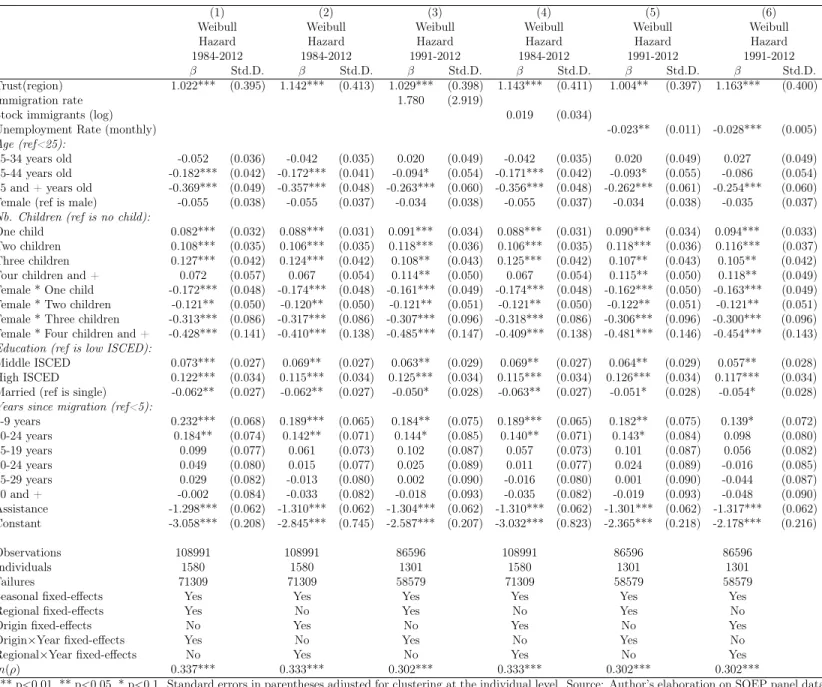
Table 4: Natives’ attitudes and immigrant’s unemployment duration. Additional fixed-effects and control variables
(1) (2) (3) (4) (5) (6)
Weibull Weibull Weibull Weibull Weibull Weibull Hazard Hazard Hazard Hazard Hazard Hazard 1984-2012 1984-2012 1991-2012 1984-2012 1991-2012 1991-2012
Std.D. Std.D. Std.D. Std.D. Std.D. Std.D. Trust(region) 1.022*** (0.395) 1.142*** (0.413) 1.029*** (0.398) 1.143*** (0.411) 1.004** (0.397) 1.163*** (0.400) Immigration rate 1.780 (2.919)
Stock immigrants (log) 0.019 (0.034)
Unemployment Rate (monthly) -0.023** (0.011) -0.028*** (0.005) Age (ref<25):
25-34 years old -0.052 (0.036) -0.042 (0.035) 0.020 (0.049) -0.042 (0.035) 0.020 (0.049) 0.027 (0.049) 35-44 years old -0.182*** (0.042) -0.172*** (0.041) -0.094* (0.054) -0.171*** (0.042) -0.093* (0.055) -0.086 (0.054) 45 and + years old -0.369*** (0.049) -0.357*** (0.048) -0.263*** (0.060) -0.356*** (0.048) -0.262*** (0.061) -0.254*** (0.060) Female (ref is male) -0.055 (0.038) -0.055 (0.037) -0.034 (0.038) -0.055 (0.037) -0.034 (0.038) -0.035 (0.037) Nb. Children (ref is no child):
One child 0.082*** (0.032) 0.088*** (0.031) 0.091*** (0.034) 0.088*** (0.031) 0.090*** (0.034) 0.094*** (0.033) Two children 0.108*** (0.035) 0.106*** (0.035) 0.118*** (0.036) 0.106*** (0.035) 0.118*** (0.036) 0.116*** (0.037) Three children 0.127*** (0.042) 0.124*** (0.042) 0.108** (0.043) 0.125*** (0.042) 0.107** (0.043) 0.105** (0.042) Four children and + 0.072 (0.057) 0.067 (0.054) 0.114** (0.050) 0.067 (0.054) 0.115** (0.050) 0.118** (0.049) Female * One child -0.172*** (0.048) -0.174*** (0.048) -0.161*** (0.049) -0.174*** (0.048) -0.162*** (0.050) -0.163*** (0.049) Female * Two children -0.121** (0.050) -0.120** (0.050) -0.121** (0.051) -0.121** (0.050) -0.122** (0.051) -0.121** (0.051) Female * Three children -0.313*** (0.086) -0.317*** (0.086) -0.307*** (0.096) -0.318*** (0.086) -0.306*** (0.096) -0.300*** (0.096) Female * Four children and + -0.428*** (0.141) -0.410*** (0.138) -0.485*** (0.147) -0.409*** (0.138) -0.481*** (0.146) -0.454*** (0.143) Education (ref is low ISCED):
Middle ISCED 0.073*** (0.027) 0.069** (0.027) 0.063** (0.029) 0.069** (0.027) 0.064** (0.029) 0.057** (0.028) High ISCED 0.122*** (0.034) 0.115*** (0.034) 0.125*** (0.034) 0.115*** (0.034) 0.126*** (0.034) 0.117*** (0.034) Married (ref is single) -0.062** (0.027) -0.062** (0.027) -0.050* (0.028) -0.063** (0.027) -0.051* (0.028) -0.054* (0.028) Years since migration (ref<5):
5-9 years 0.232*** (0.068) 0.189*** (0.065) 0.184** (0.075) 0.189*** (0.065) 0.182** (0.075) 0.139* (0.072) 10-24 years 0.184** (0.074) 0.142** (0.071) 0.144* (0.085) 0.140** (0.071) 0.143* (0.084) 0.098 (0.080) 15-19 years 0.099 (0.077) 0.061 (0.073) 0.102 (0.087) 0.057 (0.073) 0.101 (0.087) 0.056 (0.082) 20-24 years 0.049 (0.080) 0.015 (0.077) 0.025 (0.089) 0.011 (0.077) 0.024 (0.089) -0.016 (0.085) 25-29 years 0.029 (0.082) -0.013 (0.080) 0.002 (0.090) -0.016 (0.080) 0.001 (0.090) -0.044 (0.087) 30 and + -0.002 (0.084) -0.033 (0.082) -0.018 (0.093) -0.035 (0.082) -0.019 (0.093) -0.048 (0.090) Assistance -1.298*** (0.062) -1.310*** (0.062) -1.304*** (0.062) -1.310*** (0.062) -1.301*** (0.062) -1.317*** (0.062) Constant -3.058*** (0.208) -2.845*** (0.745) -2.587*** (0.207) -3.032*** (0.823) -2.365*** (0.218) -2.178*** (0.216) Observations 108991 108991 86596 108991 86596 86596 Individuals 1580 1580 1301 1580 1301 1301 Failures 71309 71309 58579 71309 58579 58579
Seasonal fixed-effects Yes Yes Yes Yes Yes Yes
Regional fixed-effects Yes No Yes No Yes No
Origin fixed-effects No Yes No Yes No Yes
Origin⇥Year fixed-effects Yes No Yes No Yes No Regional⇥Year fixed-effects No Yes No Yes No Yes ln(⇢) 0.337*** 0.333*** 0.302*** 0.333*** 0.302*** 0.302***
*** p<0.01, ** p<0.05, * p<0.1. Standard errors in parentheses adjusted for clustering at the individual level. Source: Author’s elaboration on SOEP panel data over 1984-2012, Eurobarometer, European Election Survey data, The German Federal Statistical Office and The German Federal Employment Agency. ln(⇢) is the estimated shape parameter. Trust is the mean of the share of Germans who expressed that they trust citizens from a given country, calculated by country of origin. Age is a categorical variable with four groups: younger than 25 (0), between 25 and 34 (1), between 35 and 44 (2) and above 44 years old (3). Female is a dummy variable equal to one if the respondent is a woman and zero otherwise. Nb. children is a categorical variables with five groups: no child (0), One child (1), two children (2), three children (3) and four children (4) present in the household. Education is a categorical variable with three groups: low ISCED (0), middle ISCED (1) and high ISCED (2). Married is a dummy variable equal to one if the respondent is married and zero otherwise. Years since migration to Germany is a categorical variable with seven groups: less than 5 years (0), between 5 and 9 years (1), between 10 and 14 years (2), between 15 and 19 years (3), between 20 and 24 years (4), between 25 and 29 years (5) and 30 years or more (6). Assistance is a dummy variable equal to one if the respondent received social assistance and zero otherwise.
5.3 Threats to identification
We are concerned that omitted variables could influence simultaneously natives’ attitudes towards immigrants and the opportunities for the foreign-born to find a job. First, columns (3) and (4) in Table 4 include therefore annual immigration rates for each migrants’ origin countries at the regional level.27 Indeed, immigration rates can be correlated with natives’ attitudes towards a particular origin and also promote (through networks) or deter (through competition) the access to employment for immigrants originating this country. Our analysis is constrained by the availability of German native population data only after 1991 used to compute immigration rates by origin and region. Thus, we first introduce immigration rates in column (3) with origin fixed-effects interacted with year fixed-effects and restrict our analysis to the 1991-2012 period. The coefficient of T rust(region) remains positive and highly significant. In a second step, in column (4), we introduce the logarithm of the annual stock of immigrants of each origin in each region. This last estimate covers our entire period of analysis. Indeed, regional fixed-effect interacted with time fixed-effects absorb the variation in the size of the natives population over time at the regional level. Still, the effect of natives’ attitudes on immigrant’s unemployment duration is robust to the introduction of this control variable. Second, from columns (5) to (6), we include monthly unemployment rates at the regional level in order to have a better control of regional market dynamics that can affect both the access of immigrants to local labor market and the native’s attitudes. Here again we restrict our analysis to the period 1991-2012. Accounting either for origin fixed-effects interacted with year fixed-effects or for regional fixed-effect interacted with time fixed-effect, the effect of T rust(region) on the hazard ratio remains positive and significant at the one percent level. As expected, the coefficient in front of the unemployment rate is negative and significant. It confirms that lower hiring opportunities decrease the likelihood for all individuals to exit unemployment.
Another important source of concern is the fact that variables capturing natives’ attitudes might also capture linguistic distance. This entails that our results could reflect the fact that migrants for whom it is more costly to learn German also struggle more to find a job. To tackle this potential issue, we introduce categorical variables capturing self-reported fluency in speaking and writing German language. The results, reported in columns (1) and (2) of appendix Table A8, show that controlling for command of German at the individual level 27It is important to note that the definition of immigration rates differs here from what has been used in our analysis so far. Indeed, immigration rates are computed using information on the nationality and not with the origin country of foreign-born. Still, we assume that trends in immigration rates based on nationality reflect the arrival rates of immigrants of different origin country in each region.
does not modify our main results. One could also be concerned that our results are driven by the fact that migrants from different origins specialize in specific sectors and occupations with varying labor market dynamics. We investigate this possibility by controlling for sector and occupation fixed effects. Results are reported in the appendix Table A8 and suggest that our main results are not due to immigrants clustering in specific occupations and sectors.28
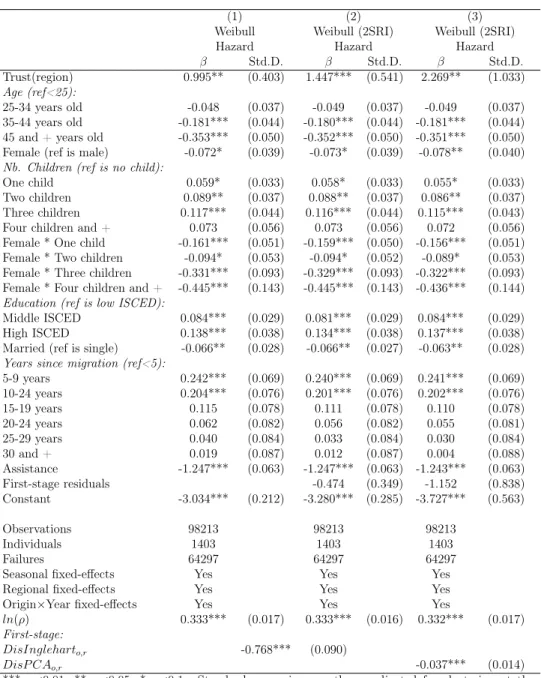
Measuring natives’ attitudes at the regional level may exacerbate the concern that the ability of a given diaspora to perform in local labor markets could shape native’s attitudes at the regional level.29 This concern is greatly mitigated by the fact that the questions in Eurobarometer surveys ask about trust towards citizen of a given country, not towards migrants in Germany. Nonetheless, it is important to tackle this threat to identification more formally. In order to address the possibility of reverse causality, we rely on an instrumental variable approach, namely the two-stage residual inclusion method (2SRI hereafter), which is widely used to address endogeneity issues in non linear models.30 Following Terza et al. (2008), our first-stage equation regresses T rust(region) on its instruments and the control variables at the origin-region level. In a second-stage we include the first-stage residual as an explanatory variable in our equation of interest. We use a proxy for the cultural distance between each German region r and each origin country o as an instrument for T rust(region). As a matter of fact, Guiso et al. (2009) underline that cultural distance is a strong determinant of T rust since individuals tend to have more confidence in people that share their beliefs and values. The exclusion restriction of our IV strategy implies therefore that, conditional on the other covariates included in the regression, cultural distance has no impact on individual’s probability to exit unemployment other than through the discrimination channel.
In order to obtain bilateral cultural distances we rely on the World Value Surveys (WVS) which explore values and human beliefs through individual questionnaires conducted in al-most 100 countries over the world. Individuals are asked to express their views on several practices. It is crucial to select practices in the questionnaire which do not violate the ex-clusion restriction of our identification strategy. Therefore we select individual views on homosexuality, abortion, divorce or suicide as instruments. Here, our identification strategy 28The changes in coefficient are only due to the fact that the sample size is reduced because of missing values
in the additional regressors.
29Notice that cross-country estimates are less affected by this issue since it is very unlikely that individual’s abilities to perform in local labor markets influence attitudes towards citizen of a particular country at the national level.
30The 2SRI estimator corrects for the inconsistency of the estimated parameters obtained with the two-stage least square method (2SLS) applied to non-linear models. While the 2SLS and the 2SRI share the same first stage equation, the latter does not replace the endogenous variable by its predicted value but instead, includes the first-stage residuals as additional regressors (Terza et al., 2008).
relies on the assumption that tolerance towards homosexuality, abortion, divorce or suicide are very unlikely to influence the individual hazard rate of finding a job other than through cultural distance with natives. For each of these four dimensions we define Sir and Sio as the share of individuals either living in the German region r or in the origin country o declar-ing that the ith dimension is justifiable.31 The variability of our instrument comes from the fact that, not only different origin countries have different beliefs and values, but also indi-viduals living in different German regions exhibit differences in terms of attitudes towards homosexuality, divorce, suicide or abortion for instance. Indeed, German regions are very heterogeneous with respect to cultural values which translates into heterogeneity in terms of norms such as family values (Bertram and Nauck, 1995; Silbereisen and von Eye, 1999; Bertram, 2013; Bertram et al., 2013, for references). We exploit these intra-regions discrep-ancies within Germany in order to obtain a bilateral measure of cultural distance between German regions and immigrants’ origin countries. Our first measure of cultural distance is such as:
DisAro = sX
i
(Sir Sio)2 (7)
where i 2 {Homosexuality; Abortion; Divorce; Sucide} is the vector of views on practices. Our second measure of cultural distance is based on four different indicators which measure the probability that two randomly-drawn individuals, one in a given origin country and one in a given region in Germany, have a different opinion on the ith practices:
DisBiro= 1 ⇣
[Sir⇤ Sio] + [1 Sir]⇤ [1 Sio] ⌘
(8) Using a principal component analysis, we extract the component DisP CAor that explains most of the variance of the data (56%) and use it as an instrument for T rust(region). We report the results of these estimates in the Table 5. We replicate our main result in column (1) excluding Austrian, Greek and Portuguese immigrants from the analysis. It allows us to compare our estimated coefficients across a similar sample, since cultural distance data are not available for these three countries. The coefficient of T rust(region) is still significant and not statistically different from the one reported in Table 4, column(3). In columns (2) we introduce the residuals of the first-stage estimates regressing T rust(region) on DisAr,o.
We see at the bottom of Table 5 that the instrument is significant with the expected sign. An increase in the cultural distance between a given German region and a given origin country decreases the share of German that express positive views toward immigrants originating from 31Data for Austria, Greece and Portugal are not available in the WVS for this particular question.