HAL Id: hal-01958848
https://hal.archives-ouvertes.fr/hal-01958848
Submitted on 12 Jul 2019
HAL is a multi-disciplinary open access
archive for the deposit and dissemination of
sci-entific research documents, whether they are
pub-lished or not. The documents may come from
teaching and research institutions in France or
abroad, or from public or private research centers.
L’archive ouverte pluridisciplinaire HAL, est
destinée au dépôt et à la diffusion de documents
scientifiques de niveau recherche, publiés ou non,
émanant des établissements d’enseignement et de
recherche français ou étrangers, des laboratoires
publics ou privés.
Distributed under a Creative Commons Attribution| 4.0 International License
should be interpreted with care
Lena Maier-Hein, Matthias Eisenmann, Annika Reinke, Sinan Onogur, Marko
Stankovic, Patrick Scholz, Tal Arbel, Hrvoje Bogunovic, Andrew P. Bradley,
Aaron Carass, et al.
To cite this version:
Lena Maier-Hein, Matthias Eisenmann, Annika Reinke, Sinan Onogur, Marko Stankovic, et al.. Why
rankings of biomedical image analysis competitions should be interpreted with care. Nature
Communi-cations, Nature Publishing Group, 2018, 9 (1), pp.5217. �10.1038/s41467-018-07619-7�. �hal-01958848�
ARTICLE
Why rankings of biomedical image analysis
competitions should be interpreted with care
Lena Maier-Hein
et al.
#International challenges have become the standard for validation of biomedical image
ana-lysis methods. Given their scientific impact, it is surprising that a critical anaana-lysis of common
practices related to the organization of challenges has not yet been performed. In this paper,
we present a comprehensive analysis of biomedical image analysis challenges conducted up
to now. We demonstrate the importance of challenges and show that the lack of quality
control has critical consequences. First, reproducibility and interpretation of the results is
often hampered as only a fraction of relevant information is typically provided. Second, the
rank of an algorithm is generally not robust to a number of variables such as the test data
used for validation, the ranking scheme applied and the observers that make the reference
annotations. To overcome these problems, we recommend best practice guidelines and
de
fine open research questions to be addressed in the future.
DOI: 10.1038/s41467-018-07619-7
OPEN
Correspondence and requests for materials should be addressed to L.M-H. (email:l.maier-hein@dkfz.de).#A full list of authors and their af
fliations appears at the end of the paper.
123456789
B
iomedical image analysis has become a major research
field
in biomedical research, with thousands of papers published
on various image analysis topics including segmentation,
registration, visualization, quantification, object tracking, and
detection
1,2. For a long time, validation and evaluation of new
methods were based on the authors’ personal data sets, rendering
fair and direct comparison of the solutions impossible
3. The
first
known efforts to address this problem date back to the late 90 s
4,
when Jay West, J Michael Fitzpatrick and colleagues performed
an international comparative evaluation on intermodality brain
image registration techniques. To ensure a fair comparison of the
algorithms, the participants of the study had no knowledge of the
gold standard results until after their results had been submitted.
A few years later, the ImageCLEF
5,6evaluation campaign
intro-duced a challenge on medical image retrieval
7, based on
experi-ences in the text retrieval domain where systematic evaluation
had been performed since the 1960s
8. About one decade ago, a
broader interest in biomedical challenge organization arose with
the
first grand challenge that was organized in the scope of the
international conference on Medical Image Computing and
Computer Assisted Intervention (MICCAI) 2007
9. Over time,
research practice began to change, and the number of challenges
organized annually has been increasing steadily (Fig.
1
a), with
currently about 28 biomedical image analysis challenges with a
mean of 4 tasks conducted annually. Today, biomedical
image analysis challenges are often published in prestigious
journals (e.g
9–44.) and receive a huge amount of attention with
hundreds of citations and thousands of views. Awarding the
winner with a significant amount of prize money (up to €1
million on platforms like Kaggle
45) is also becoming increasingly
common.
This development was a great step forward, yet the increasing
scientific impact
46,47of challenges now puts huge responsibility
on the shoulders of the challenge hosts that take care of the
organization and design of such competitions. The performance
of an algorithm on challenge data is essential, not only for the
acceptance of a paper and its impact on the community, but also
for the individuals’ scientific careers, and the potential that
algorithms can be translated into clinical practice. Given that this
is so important, it is surprising that no commonly respected
quality control processes for biomedical challenge design exist to
date. Similar problems exist in other research communities, such
as computer vision and machine learning.
In this paper, we present the
first comprehensive evaluation of
biomedical image analysis challenges based on 150 challenges
conducted up until the end of 2016. It demonstrates the crucial
nature of challenges for the
field of biomedical image analysis, but
also reveals major problems to be addressed: Reproduction,
adequate interpretation, and cross-comparison of results are not
possible in the majority of challenges, as only a fraction of the
relevant information is reported and challenge design (e.g. a
choice of metrics and methods for rank computation) is highly
heterogeneous. Furthermore, the rank of an algorithm in a
challenge is sensitive to a number of design choices, including the
test data sets used for validation, the observer(s) who annotated
the data and the metrics chosen for performance assessment, as
well as the methods used for aggregating values.
Results
150 biomedical image analysis challenges. Up until the end of
2016, 150 biomedical image analysis challenges that met our
inclusion criteria (see Methods and Supplementary Table 1) were
conducted with a total of 549 different image analysis tasks (see
Fig.
1
). 57% of these challenges (75% of all tasks) published their
results in journals or conference proceedings. The information
used in this paper from the remaining challenges was acquired
from websites. Most tasks were related to segmentation (70%)
and classification (10%) and were organized within the context of
the MICCAI conference (50%), and the IEEE International
Symposium on Biomedical Imaging (ISBI) (following at 34%).
The majority of the tasks dealt with 3D (including 3D
+ t) data
(84%), and the most commonly applied imaging techniques were
magnetic resonance imaging (MRI) (62%), computed
tomo-graphy (CT) (40%) and microscopy (12%). The percentage of
tasks that used in vivo, in silico, ex vivo, in vitro, post mortem,
and phantom data was 85, 4, 3, 2, 2, and 1%, respectively (9%: N/
A; 3%: combination of multiple types). The in vivo data was
acquired from patients in clinical routine (60%), from patients
under controlled conditions (9%), from animals (8%), from
healthy human subjects (5%), or from humans under unknown
(i.e. not reported) conditions (32%). While training data is
typi-cally provided by the challenge organizers (85% of all tasks), the
number of training cases varies significantly across the tasks
(median: 15; interquartile range (IQR): (7, 30); min: 1, max:
32,468). As with the training cases, the number of test cases varies
across the tasks (median: 20; IQR: (12, 33); min: 1, max: 30,804).
The median ratio of training cases to test cases was 0.75. The test
data used differs considerably from the training data, not only in
quantity but also in quality. For 73% of all tasks with human or
hybrid reference generation, multiple observers have annotated
the reference data. In these cases, an image was annotated by a
median of 3 (IQR: (3, 4), max: 9) observers.
Half of the relevant information is not reported. We identified
the relevant parameters that characterize a biomedical challenge
following an ontological approach (see Methods). This yielded a
total of 53 parameters corresponding to the categories challenge
organization, participation conditions, mission of the challenge,
study conditions, challenge data sets, assessment method, and
challenge outcome (see Table
1
). A biomedical challenge task
reported a median of 62% (IQR: (51, 72%); min: 21%, max: 92%) of
these parameters. 6% of the parameters were reported for all tasks
and 43% of all parameters were reported for <50% of all tasks. The
list of parameters which are generally not reported includes some
that are crucial for interpretation of results. For example, 8% of all
tasks providing an aggregated ranking across multiple metrics did
not report the rank aggregation method they used (i.e. the method
according to which the winner has been determined). Eighty
five
percent of the tasks did not give instructions on whether training
data provided by challenge organizers may have been
supple-mented by other publicly available or private data, although the
training data used is key to the success of any machine learning
algorithm (see e.g
48.). In 66% of all tasks, there was no description
on how the reference (i.e. gold standard) annotation was
per-formed although the quality of annotation in the
field of
biome-dical image analysis varies dependent on the user
49. Forty
five
percent of tasks with multiple annotators did not describe how
the annotations were aggregated. Also, the level of expertize of the
observers that annotated the reference data was often (19%) not
described. When analyzing the parameter coverage for different
years, algorithm categories, publication venues, and platforms (see
Supplementary Note 1), one main observation was that those
challenges that were only represented on websites showed a
sub-stantial difference in quality of reporting when compared to those
published in a journal or in conference proceedings. The
supple-mentary material further shows how the reporting of individual
parameters evolves over time.
Large variability in challenge design. In total, 97 different
metrics have been used for performance assessment (three on
60% 40% 71% 16% 53% 22% 2008 2012 2016 2% 2% 5% 7% 5% 7% 9% 2%
Development of biomedical challenges Field of application
Number of competitions 0 20 40 60 80 100 120 140 160 2004 2005 2006 2007 2008 2009 2010 2011 2012 2013 2014 2015 2016 Tasks Challenges 2004 2008 2012 2016 100 (%) 50 (%) 0 (%) Assistance Not reported Training Screening Research Intervention planning Intervention follow-up Education Diagnosis Cross-phase 0% 10% 20% 30% 40% 50% 60% 70% N/A MRI CT Microscopy X-ray Endoscopic imaging US Retrieval Other Imaging techniques 341 222 99 68 30 26 21 20 19 Segmentation 70% 10% 7% Classification Detection Tracking (3%) Retrieval (3%) Reconstruction (2%) Prediction (2%) Other (3%) Algorithm categories 1 2 5 10 2 5 100 2 510002 5 10k 2 5 Count Test Training
Training and test data Metric distribution
Specificity Dice similarity coefficient Hausdorff distance
Adjusted rand index
Recall Average symmetric surface distance Precision Accuracy Euclidean distance Volume Jaccard index Area under curve F1 score Hausdorff distance 95 Kappa Number Average surface distance
Interclass correlation 0 100 200 300 400 500 Count MICCAI ImageCLEF ISBI ICPR DREAM Kaggle AAPM SMLMS Year Challenge platforms
a
b
c
d
e
f
g
Fig. 1 Overview of biomedical image analysis challenges. a Number of competitions (challenges and tasks) organized per year, bfields of application,
c algorithm categories assessed in the challenges, d imaging techniques applied, e number of training and test cases used, f most commonly applied
metrics for performance assessment used in at least 5 tasks, andg platforms (e.g. conferences) used to organize the challenges for the years 2008, 2012,
average per task). Metric design is very heterogeneous,
particu-larly across comparable challenges, and justification for a
parti-cular metric is typically (77%) not provided. Roughly half of all
metrics (51%) were only applied on a single task. Even in the
main
field of medical image segmentation, 34% of the 38 different
metrics used were only applied once. The fact that different
names may sometimes refer to the same metric was compensated
for in these computations. Thirty nine percent of all tasks
pro-vided a
final ranking of the participants and thus determined a
challenge winner. Fifty seven percent of all tasks that provide a
ranking do so on the basis of a single metric. In this case, either
metric-based (aggregate, then rank; 76%) or case-based (rank per
case, then aggregate; 1%) is typically performed (see Methods and
Supplementary Discussion). Overall, 10 different methods for
determining the
final rank (last step in computation) of an
algorithm based on multiple metrics were applied.
Minor changes in metrics may make the last the
first. Besides
the Dice Similarity Coefficient (DSC)
50, which was used in 92% of
all 383 segmentation tasks (2015: 100%), the Hausdorff Distance
(HD)
51,52is the most commonly applied metric in segmentation
tasks (47%). It was used either in its original formulation (42%) or
as the 95% variant (HD95) (5%) (38%/8% in the 2015
segmen-tation challenges). We determined a single-metric ranking based
on both versions for all 2015 segmentation challenges and found
radical differences in the rankings as shown in Fig.
2
a). In one
case, the worst-performing algorithm according to the HD (10th
place) was ranked
first in a ranking based on the HD95.
Different aggregation methods produce different winners. One
central result of most challenges is the
final ranking they produce.
Winners are considered state of the art and novel contributions
are then benchmarked according to them. The significant design
choices related to the ranking scheme based on one or multiple
metric(s) are as follows: whether to perform metric-based
(aggregate, then rank) or case-based (rank, then aggregate) and
whether to take the mean or the median. Statistical analysis with
Kendall’s tau (rank correlation coefficient
53) using all
segmenta-tion challenges conducted in 2015 revealed that the test case
aggregation method has a substantial effect on the
final ranking,
as shown in Fig.
2
b, c). In some cases, almost all teams change
their ranking position when the aggregation method is changed.
According to bootstrapping experiments (Figs.
3
and
4
),
single-metric rankings are statistically highly significantly more robust
when (1) the mean rather than the median is used for aggregation
and (2) the ranking is performed after the aggregation.
Different annotators produce different winners. In most
seg-mentation tasks (62%), it remains unclear how many observers
annotated the reference data. Statistical analysis of the 2015
seg-mentation challenges, however, revealed that different observers
may produce substantially different rankings, as illustrated in
Fig.
2
d. In experiments performed with all 2015 segmentation
challenges that had used multiple observers for annotation (three
tasks with two observers, one with
five observers), different
observers produced different rankings in 15, 46, and 62% of the
13 pairwise comparisons between observers, when using a
single-metric ranking with mean aggregation based on the DSC, HD,
and HD95, respectively. In these cases, the ranges of Kendall’s tau
were [0.78, 1], [−0.02, 1], and [0.07, 1], respectively.
Removing one test case can change the winner. Ideally, a
challenge ranking should reflect the algorithms’ performances for
a task and thus be independent of the specific data sets used for
Table 1 List of parameters that characterize a challenge
Parameter name Coverage [%] Parameter name Coverage [%]
Challenge namea 100 Operator(s) 7
Challenge websitea 99 Distribution of training and test casesa 18
Organizing institutions and contact persona 97 Category of training data generation methoda 89
Life cycle typea 100 Number of training casesa 89
Challenge venue or platform 99 Characteristics of training casesa 79
Challenge schedulea 81 Annotation policy for training casesa 34
Ethical approvala 32 Annotator(s) of training casesa 81
Data usage agreement 60 Annotation aggregation method(s) for training casesa 30
Interaction level policya 62 Category of test data generation methoda 87
Organizer participation policya 6 Number of test casesa 77
Training data policya 16 Characteristics of test casesa 77
Pre-evaluation method 5 Annotation policy for test casesa 34
Evaluation software 26 Annotator(s) of test casesa 78
Submission formata 91 Annotation aggregation method(s) for test casesa 34
Submission instructions 91 Data pre-processing method(s) 24
Field(s) of applicationa 97 Potential sources of reference errors 28
Task category(ies)a 100 Metric(s)a 96
Target cohort* 65 Justification of metricsa 23
Algorithm target(s)a 99 Rank computation methoda 36
Data origina 98 Interaction level handlinga 44
Assessment aim(s)a 38 Missing data handlinga 18
Study cohorta 88 Uncertainty handlinga 7
Context informationa 35 Statistical test(s)a 6
Center(s)a 44 Information on participants 88
Imaging modality(ies)a 99 Results 87
Acquisition device(s) 25 Report document 74
Acquisition protocol(s) 72
List of parameters that were identified as relevant when reporting a challenge along with the percentage of challenge tasks for which information on the parameter has been reported. Parameter definitions can be found in Supplementary Table 2.
validation. However, a re-evaluation of all segmentation
chal-lenges conducted in 2015 revealed that rankings are highly
sen-sitive to the test data applied (Fig.
4
). According to bootstrapping
experiments with the most commonly applied segmentation
metrics, the
first rank is stable (the winner stays the winner) for
21, 11, and 9% of the tasks when generating a ranking based on
the DSC, the HD or the 95% variant of the HD, respectively. For
the
most
frequently
used
metric
(DSC;
100%
of
all
0.0 0.2 0.4 0.6 0.8 25 50 75 100 A6 A4 A1 A5 A10 A7 A9 A2 A8 A3 A7 A2 A1 A6 A5 A4 A9 A10 A3 A8 RANK1 RANK2 RANK3 RANK4 RANK5 RANK6 RANK7 RANK8 RANK9 RANK10
d
Observer 1 Observer 2 Observer 1 Observer 2 A6 A4 A2 A5 A7 A10 A3 A8 A9 A1 A4 A6 A2 A10 A7 A5 A8 A3 A9 A1 RANK1 RANK2 RANK3 RANK4 RANK5 RANK6 RANK7 RANK8 RANK9 RANK10a
Ranking with HD Ranking with HD95 A1 A2 A3 A4 A5 A6 A7 A8 A9 A10 A3 A2 A1 A6 A4 A9 A5 A7 A8 A10c
Rank then aggregate Aggregate then rank A1 / A6 A3 A2 A5 A4 A11 / A12 A1 A2 A3 A4 A5 A6 A7 A8 A9 A10 A11 / A12 A13 A14 A15 A16 A17 A7 A8 A9 A10 A15 A14 A13 A16 A17b
Aggregation with mean Aggregation with median A1 A2 A3 A4 A5 A5 A6 A7 A8 A9 A11 A12 A13 A10 A2 A3 A4 A1 A8 A7 A6 A9 A11 A12 A13 A10 0.0 0.2 0.4 0.6 Kendall’s tau 0.8 1.0 0.0 0.2 0.4 0.6 Kendall’s tau 0.8 1.0 0.0 0.2 0.4 0.6 Kendall‘s tau 0.8 1.0 A1 DSC A2 A3 A4 A5 A6 A7 A8 A9 A10 Observer 1 Observer 2 A1 HD A2 A3 A4 A5 A6 A7 A8 A9 A10Fig. 2 Robustness of rankings with respect to several challenge design choices. One data point corresponds to one segmentation task organized in 2015
(n = 56). The center line in the boxplots shows the median, the lower, and upper border of the box represent the first and third quartile. The whiskers
extend to the lowest value still within 1.5 interquartile range (IQR) of thefirst quartile, and the highest value still within 1.5 IQR of the third quartile.
a Ranking (metric-based) with the standard Hausdorff Distance (HD) vs. its 95% variant (HD95). b Mean vs. median in metric-based ranking based on the
HD.c Case-based (rank per case, then aggregate with mean) vs. metric-based (aggregate with mean, then rank) ranking in single-metric ranking based on
the HD.d Metric values per algorithm and rankings for reference annotations performed by two different observers. In the box plots (a–c), descriptive
statistics for Kendall’s tau, which quantifies differences between rankings (1: identical ranking; −1: inverse ranking), is shown. Key examples (red circles)
illustrate that slight changes in challenge design may lead to the worst algorithm (Ai: Algorithm i) becoming the winner (a) or to almost all teams changing
2015 segmentation challenges), a median of 15% and up to 100%
of the other teams were ranked
first in at least 1% of the bootstrap
partitions. Even when leaving out only a single test case (and thus
computing the ranking with one test case less), other teams than
the winning team were ranked
first in up to 16% of the cases. In
one task, leaving a single test case out led to 67% of the teams
other than the winning team ranking
first.
Lack of missing data handling allows for rank manipulation.
82% of all tasks provide no information about how missing data is
handled. While missing data handling is straightforward in
case-based aggregation (the algorithms for which no results were
submitted receive the last rank for that test case) it is more
challenging in metric-based aggregation, especially when no
worst possible value can be defined for a metric. For this reason,
Aggregate withmedian then rank 0 20 40 60 % Bootstraps 80 100 Aggregate with mean then rank 0 20 40 60 % Bootstraps 80 100 Rank then aggregate with mean 0 20 40 60 % Bootstraps 80 100 Median vs. mean Aggregate then rank vs. rank then aggregate
Fig. 3 The ranking scheme is a deciding factor for the ranking robustness. The center line in the boxplots shows the median, the lower, and upper border of
the box represent thefirst and third quartile. The whiskers extend to the lowest value still within 1.5 interquartile range (IQR) of the first quartile, and the
highest value still within 1.5 IQR of the third quartile. According to bootstrapping experiments with 2015 segmentation challenge data, single-metric based
rankings (those shown here are for the DSC) are significantly more robust when the mean rather than the median is used for aggregation (left) and when
the ranking is performed after aggregation rather than before (right). One data point represents the robustness of one task, quantified by the percentage of
simulations in bootstrapping experiments in which the winner remains the winner
0 20 40 60 80 100 % Bootstraps 0 20 40 60 % Bootstraps 80 100 0 20 40 60 % Participants 80 100 DSC 0 20 40 60 80 100
% not winning participants
0 20 40 60 80 100 % Bootstraps HD % participants 0 20 40 60 % Bootstraps 80 100 0 20 40 60 % Participants 80 100 0 20 40 60 80 100
% not winning participants
0 20 40 60 80 100 % Bootstraps HD95 % participants 0 20 40 60 % Bootstraps 80 100 0 20 40 60 % Participants 80 100
Fig. 4 Robustness of rankings with respect to the data used. Robustness of rankings with respect to the data used when a single-metric ranking scheme
based on whether the Dice Similarity Coefficient (DSC) (left), the Hausdorff Distance (HD) (middle) or the 95% variant of the HD (right) is applied. One
data point corresponds to one segmentation task organized in 2015 (n = 56). The center line in the boxplots shows the median, the lower, and upper
border of the box represent thefirst and third quartile. The whiskers extend to the lowest value still within 1.5 interquartile range (IQR) of the first quartile,
and the highest value still within 1.5 IQR of the third quartile. Metric-based aggregation with mean was performed in all experiments. Top: percentage of simulations in bootstrapping experiments in which the winner (according to the respective metric) remains the winner. Bottom: percentage of other
several challenge designs simply ignore missing values when
aggregating values. A re-evaluation of all 2015 segmentation
challenges revealed that 25% of all 419 non-winning algorithms
would have been ranked
first if they had systematically just
submitted the most plausible results (ranking scheme: aggregate
DSC with mean, then rank). In 9% of the 56 tasks, every single
participating team could have been ranked
first if they had not
submitted the poorest cases.
Researchers request quality control. Our experimental analysis
of challenges was complemented by a questionnaire (see
Meth-ods). It was submitted by a total of 295 participants from 23
countries. 92% of participants agreed that biomedical challenge
design should be improved in general, 87% of all participants
would appreciate best practice guidelines, and 71% agreed that
challenges should undergo more quality control. A variety of
issues were identified for the categories data, annotation,
eva-luation, and documentation (cf. Figure
5
). Many concerns
involved the representativeness of the data, the quality of the
(annotated) reference data, the choice of metrics and ranking
schemes, and the lack of completeness and transparency in
reporting challenge results. Details are provided in
Supplemen-tary Note 2 and SupplemenSupplemen-tary Methods.
Complete reporting as a
first step towards better practices.
Based on the
findings of this study and the answers to the
questionnaire, we have identified several best practice
recom-mendations (see Supplementary Table 3) corresponding to the
main problems in biomedical challenge design. The establishment
of common standards and clear guidelines is currently hampered
by open research questions that still need addressing. However,
one primary practice that can be universally recommended is
comprehensive reporting of the challenge design and results. Our
practical and concrete recommendation is therefore to publish the
complete challenge design before the challenge by instantiating
the list of parameters proposed in this paper (Table
1
,
Supple-mentary Table 2). Three example instantiations are provided in
Supplementary Table 2. The MICCAI 2018 satellite event team
used the parameter list in the challenge proposal submission
system to test its applicability. The submission system required a
potential MICCAI 2018 challenge organizer to instantiate at least
90% of a reduced set of 40 parameters (cf. Table
1
) that were
regarded as essential for judging the quality of a challenge design
proposal. The median percentage of parameters instantiated was
100% (min: 98%) (16 submitted challenges).
Discussion
This paper shows that challenges play an increasingly important
role in the
field of biomedical image analysis, covering a huge
range of problems, algorithm classes, and imaging modalities
(Fig.
1
). However, common practice related to challenge reporting
is poor and does not allow for adequate interpretation and
reproducibility of results (Table
1
). Furthermore, challenge design
is very heterogeneous and lacks common standards, although
these are requested by the community (Table
1
, Fig.
5
). Finally,
challenge rankings are sensitive to a range of challenge design
parameters, such as the metric variant applied, the type of test
case aggregation performed, and the observer annotating the data.
The choice of metric and aggregation scheme has a significant
influence on the ranking’s stability (Figs.
2
–
4
). Based on these
findings and an international survey, we compiled a list of best
practice recommendations and open research challenges (see
Supplementary Table 3). The most universal recommendation is
the instantiation of a list of 53 challenge parameters before
challenge execution to ensure fairness and transparency along
with interpretability and reproducibility of results (Table
1
).
One of the key implications of our
findings is the discrepancy
between the potential impact of challenges (e.g.
finding solutions
for the primary open problems in the
field, identifying the best
methods for classes of problems, establishing high-quality
benchmarking data sets) and their current practical value. Our
study shows that the specific (according to our questionnaire
sometimes arbitrarily taken) challenge design choices (e.g. mean
vs. median for metric value aggregation, number and expert level
of data annotator(s), missing data handling etc.) have a crucial
effect on the ranking. Hence, the challenge design
– and not
(only) the value of the methods competing in a challenge
– may
determine the attention that a particular algorithm will receive
from the research community and from companies interested in
translating biomedical research results.
As a consequence, one may wonder which conclusions may
actually be drawn from a challenge. It seems only consequent to
ask whether we should generally announce a winner at all. This
question appears particularly interesting when considering that
the competitive character of today’s challenges may result in
scientists investing valuable resources into
fine-tuning their
algorithms towards a specific challenge design instead of
meth-odologically solving the underlying problem. For example, several
challenges ignore missing values and it may be worth investing
time into tuning a method such that results on difficult cases are
simply not submitted and the overall mean/median performance
is improved. A similar concern was recently raised in the related
field of machine learning. Sculley et al
54. postulate that emphasis
on competitions to be won encourages parameter tuning on large
machines at the expense of doing controlled studies to learn about
an algorithm’s strengths and weaknesses. Collaborative challenges
without winners, which have been successfully applied in
mathematics, for example
55,56, could potentially solve this issue to
some extent but require a modular challenge design, which may
not be straightforward to implement. Furthermore, the
compe-tition itself along with the opportunity to promote one’s own
methods are often key incentives for researchers to participate in
a challenge, especially when they originate from a different
(methodological) community, such as computer vision. The
concept of combining competitive elements with collaborative
elements, as pursued in the DREAM challenges
57, should be
further investigated in this context.
Even if a specific challenge design resulted in a robust ranking
(e.g. due to a huge number of test cases, appropriate metrics/
ranking schemes and high-quality reference annotations),
draw-ing broad conclusions from the challenge would not necessarily
be straightforward
10. A typically important question, for example,
is whether a statistically significant difference in a metric value is
clinically/biologically relevant. This may differ crucially from
application to application. A related but increasingly relevant
problem is the fact that it is often hard to understand which
specific design choice of an algorithm actually makes this
algo-rithm better than the competing algoalgo-rithms. It is now
well-known, for example, that the method for data augmentation (i.e.
the way training cases are used to generate even more training
data, e.g. by applying geometrical operations, such as mirroring
and rotation, to both the input data and the reference
annota-tions) often has a much bigger influence on the performance of a
deep learning algorithm than the network architecture itself.
Along these lines, Lipton and Steinhardt
58point out that the way
in which machine learning results are reported can sometimes be
misleading, for example, by failing to identify the sources of
empirical gains and through speculation disguised as explanation.
The authors thus argue for a structured description not only of
the challenge itself but also of the competing algorithms. Ideally,
competing methods would be released open source (admittedly a
potential problem for participants from industry), and a
struc-tured description of the method would be generated
auto-matically from the source code. Due to the lack of common
software frameworks and terminology, however, this is far from
straightforward to implement at this stage.
An overarching question related to this paper is whether not
only the control of the challenge design but also the selection of
challenges should be encouraged. Today, the topics that are being
pursued in the scope of challenges are not necessarily related to
the actual grand challenges that the communities face. Instead,
they are a result of who is willing and allowed to release their data
and dedicate resources to organizing a competition. Given the
fact that the pure existence of benchmarking data sets for a
particular problem clearly leads to more people investing
resources into the topic, mechanisms should be put in place to
additionally channel the resources of the scientific community to
the most important unsolved problems.
Overall, the demand for improvement along with the
com-plexity of the problem raises the question of responsibility. The
authors encourage the different stakeholders involved in
chal-lenge design, organization, and reporting to help overcome
sys-temic hurdles.
Societies in the
field of biomedical image processing should
make strategic investments to increase challenge quality. One
practical recommendation would be to establish the concept of
challenge certification. Analogously to the way clinical studies can
be classified into categories reflecting the evidence level (e.g. case
report vs. retrospective analysis vs. randomized double-blinded
prospective study), challenges should be classified and certified
according to criteria related to comprehensiveness of reporting,
challenge design in the context of common practice as well as the
data quantity and quality. Ideally, the certification would include
a control process for the reference annotations. The authors
believe that such a certification process should be handled by the
societies related to the target domain rather than by platforms
hosting challenges (such as Kaggle), which may lack the necessary
medical/biological expertize to implement such a mechanism.
Similarly, the authors see it as the role of the societies to release
best practice recommendations for challenge organization in the
different
fields that require dedicated treatment.
In turn, platforms hosting challenges should perform a much
more rigorous quality control. To improve challenge quality, for
example, it should be made possible to give open feedback on the
data and design of challenges (e.g. ability to report erroneous
annotations). Furthermore, a more rigorous review of challenge
proposals should be put in place by conferences. In a
first attempt
to establish a structured challenge review process, the organizers
of this year’s MICCAI used the parameter list presented in this
paper as a basis for structured challenge proposal submission.
While the instantiation of the list can be regarded as
cumber-some, the authors believe that such a manner of quality control is
essential to ensure reproducibility and interpretability of results.
This initiative, however, can only be regarded as a
first step, also
Data Represent-ativeness 33% Data acquisition 17% 4% 6% 6% 8% 8% 8% 8% Heterogeneity Lack of documentation Data quality Overfitting / cheating / tuning Dynamics (2%) Other Accessibility of the data Infrastructure issues Other Annotation Quality of reference data 33% Method for reference generation 16% Trans-parency 15% Resources 14% Lack of standards 10% 6% 6%
Unknown ground truth
Evaluation Other 14% Lack of infra-structure / tools Trans-parency 11% Lack of standards 19% Choice of metric 20% Method for determining ranking Lack of quality control Too much focus on ranking Lack of uncertainty handling Lifetime and dynamics (3%) Little focus on clinical need (3%) 7% 7% 7% 5% 4% Documen-tation Com-pleteness and transparency 47% Publica-tion of results 13% Lifetime and dynamics Open source Lack of standards for reporting Accessibility of information No acknow-ledgement of all participants (3%) Other 10% 9% 7% 5% 6%
Fig. 5 Main results of the international questionnaire on biomedical challenges. Issues raised by the participants were related to the challenge data, the data annotation, the evaluation (including choice of metrics and ranking schemes) and the documentation of challenge results
because control mechanisms to ensure that the proposed
chal-lenge designs will be implemented as suggested are
resource-intensive and still lacking. Furthermore, the parameter list still
lacks (external) instantiation from some domains, especially in
the
field of biological image analysis.
Funding organizations should dedicate resources for
addres-sing the open research questions summarized in Supplementary
Table 3. They should further identify open problems in the
field
of biomedical image analysis that should be tackled in the scope
of either collaborative or competitive challenges and provide
funding for the design, organization, and certification of these
challenges. This is in contrast to common practice where funding
is typically provided for solving specific problems.
Journal editors and reviewers should provide extrinsic
moti-vation to raise challenge quality by establishing a rigorous review
process. Several high-impact journals have already taken
impor-tant measures to ensure reproducibility of results in general.
These should be complemented by concepts for quality control
regarding comprehensiveness of reporting, generation of
refer-ence annotations and choice of metrics and ranking schemes.
Furthermore, journal editors are encouraged to work with the
respective societies to establish best practice recommendations for
all the different subfields of a domain, e.g. by initiating special
issues dedicated to best practices in validation and challenge
design.
Organizers of challenges are highly encouraged to follow the
recommendations summarized in this paper and to contribute to
the establishment of further guidelines dedicated to specific
subfields of biomedical image analysis. They should put a
parti-cular focus on the generation of high-quality reference data and
the development and deployment of an infrastructure that
pre-vents cheating and overfitting to the challenge data.
Finally, scientists are encouraged to dedicate their resources to
the open research questions identified (Supplementary Table 3)
and to contribute their data and resources to the establishment of
high-quality benchmarking data sets.
While this paper concentrates on the
field of biomedical image
analysis challenges, its impact can be expected to go beyond this
field. Importantly, many findings of this paper apply not only to
challenges but to the topic of validation in general. It may be
expected that more effort is typically invested when designing and
executing challenges (which, by nature, have a high level of
vis-ibility and go hand in hand with publication of the data)
com-pared to the effort invested in performing in-house studies
dedicated to validation of an individual algorithm. Therefore,
concerns involving the meaningfulness of research results in
general may be raised. This may also hold true for other research
fields, both inside and outside the life sciences, as supported by
related literature
59–63.
Clearly, it will not be possible to solve all the issues mentioned
in a single large step. The challenge framework proposed could be
a good environment in which to start improving common
prac-tice of benchmarking. Implementing a (possibly domain-specific)
checklist of parameters to be instantiated in order to describe the
data used in a challenge can safely be recommended across
sci-entific disciplines. In the long run, this could encourage further
improvements
in
the
documentation
of
the
algorithms
themselves.
In conclusion, challenges are an essential component in the
field of biomedical image analysis, but major research challenges
and systemic hurdles need to be overcome to fully exploit their
potential to move the
field forward.
Methods
Definitions. We use the following terms throughout the paper:
Challenge: open competition on a dedicated scientific problem in the field of biomedical image analysis. A challenge is typically organized by a consortium that issues a dedicated call for participation. A challenge may deal with multiple different tasks for which separate assessment results are provided. For example, a challenge may target the problem of segmentation of human organs in computed tomography (CT) images. It may include several tasks corresponding to the different organs of interest.
Task: subproblem to be solved in the scope of a challenge for which a dedicated ranking/leaderboard is provided (if any). The assessment method (e.g. metric(s) applied) may vary across different tasks of a challenge.
Case: data set for which the algorithm(s) of interest produce one result in either the training phase (if any) or the test phase. It must include one or multiple images of a biomedical imaging modality (e.g. a CT and a magnetic resonance imaging (MRI) image of the same structure) and typically comprises a gold standard annotation (usually required for test cases).
Metric: a measure (not necessarily metric in the strict mathematical sense) used to compute the performance of a given algorithm for a given case, typically based on the known correct answer. Often metrics are normalized to yield values in the interval from 0 (worst performance) to 1 (best performance).
Metric-based vs. case-based aggregation: to rank an algorithm participating in a challenge based on the performance on a set of test cases according to one or
multiple metrics, it is necessary to aggregate values to derive afinal rank. In
single-metric rankings, we distinguish the following two categories, which cover most ranking schemes applied. Metric-based aggregation begins with aggregating metric values over all test cases (e.g. with the mean or median). Next, a rank for each algorithm is computed. In contrast, case-based aggregation begins with computing
a rank for each test case for each algorithm. Thefinal rank is determined by
aggregating test case ranks (see Supplementary Discussion for more details).
Inclusion criteria. Inclusion criteria for“Experiment: Comprehensive reporting”:
Our aim was to capture all biomedical image analysis challenges that have been conducted up to 2016. We did not include 2017 challenges as our focus is on information provided in scientific papers, which may have a delay of more than a year to be published after challenge execution. To acquire the data, we analyzed the websites hosting/representing biomedical image analysis challenges, namely grand-challenge.org, dreamchallenges.org, and kaggle.com as well as websites of main
conferences in thefield of biomedical image analysis, namely Medical Image
Computing and Computer Assisted Intervention (MICCAI), International Sym-posium on Biomedical Imaging (ISBI), International Society for Optics and Pho-tonics (SPIE) Medical Imaging, Cross Language Evaluation Forum (CLEF), International Conference on Pattern Recognition (ICPR), The American Asso-ciation of Physicists in Medicine (AAPM), the Single Molecule Localization Microscopy Symposium (SMLMS) and the BioImage Informatics Conference (BII). This yielded a list of 150 challenges with 549 tasks.
Inclusion criteria for“Experiment: Sensitivity of challenge ranking”: all
organizers of 2015 segmentation challenges (n= 14) were asked to provide the
challenge results (per algorithm and test case) and (re-)compute a defined set of
common performance measures, including the Dice Similarity Coefficient (DSC)
and the Hausdorff Distance (HD) in the original version51and the the 95% variant
(HD95)52. While the DSC was used in the original design of all 2015 challenges, the
HD/HD95 was not always applied. In all, 13 challenges were able to provide the measures as requested. These challenges are composed of 124 tasks in total. The
specific inclusion criteria on challenge and task level are provided in Tables2and3.
Challenge parameter list. One key purpose of this paper was to develop a list of parameters that can be instantiated for describing the design and results of a challenge in a comprehensive manner, thus facilitating interpretability and reproducibility of results. To this end, the following procedure was followed:
Initialization: the parameters for describing reference-based validation studies
presented in ref.64served as an initial set.
Adding challenge-specific parameters: during analysis of challenge websites and papers, the initial list was complemented such that the information available on a challenge could be comprehensively formalized.
Refinement based on challenge capturing: a tool was designed to formalize existing challenges with the current parameter list. During this process, the list was further refined.
Refinement with international questionnaire: Finally, a questionnaire was
designed and sent to all co-authors tofinalize the list. All participants were asked to
comment on the name, the description, the importance and possible instantiations of each parameter. Adding further parameters was also allowed.
Finalization with ontological modeling: based on thefinal list, an ontology for
describing biomedical image analysis challenges was developed. The latter was used for structured submission of MICCAI 2018 biomedical challenges.
Statistical methods. To quantify the robustness of a ranking, the following sta-tistical methods were used:
Kendall’s tau analysis: to quantify the agreement of two rankings (e.g. for two
different aggregation methods or two different metric variants), Kendall’s tau (also
named Kendall’s rank correlation or simply tau)53was determined as
entities ranked and may take values between 1 (perfect agreement, i.e. same
ranking) and−1 (reverse ranking).
Bootstrapping: for analysis of the variability of a ranking scheme (e.g. as a function of the metric applied), the following bootstrap approach was chosen: for a given task, the original ranking based on all test cases and a given ranking scheme as well as the winning algorithm according to this ranking scheme was determined. In all analyses, 1000 bootstrap samples were drawn from the data sets and the ranking scheme was applied to each bootstrap sample. It should be noted that on average, 63.2% of distinct data sets are retained in a bootstrap sample. For summary of the ranking scheme variability, the frequency of rank 1 in the bootstrap samples for the original winner (the winner remains the winner) as well as the proportion of algorithms that achieved rank 1 in the bootstraps but were not winning in the original ranking was determined. Competitions with multiple winners according to the original ranking were not included in the analysis (this occurred in just one task). For comparison of the stability of different ranking schemes, the same bootstrap samples were evaluated with different ranking schemes and a paired comparison between the proportion of the winner remaining the winner was performed by Wilcoxon signed rank test. Results were considered
significant for p < 0.05.
Leave-one-out: for a given task, the original ranking based on all test cases and a given ranking scheme and the winning algorithm according to this ranking scheme was determined. The number of data sets was reduced by one and the ranking scheme was applied to this subset of data sets. The same summary measures as for the bootstrapping approach were determined.
Note that we did not rely on results of statistical testing approaches to quantify the stability of a given ranking scheme. The reasons for this decision were the following:
(a) The number of data sets varies widely between different tasks and due to
correlation of power and sample size, results of statistical tests between different tasks are not comparable by design.
(b) If one were to use statistical testing, the appropriate approach would be to
use a mixed model with a random factor for the data set and test the global hypothesis that all algorithms produce the same result, followed by post-hoc all pairwise comparisons. Pairwise comparisons would have to be adjusted for multiplicity and adjustment depends on the number of algorithms in the task. Again, results of statistical testing between different tasks are not comparable by design.
(c) We have evaluated the concordance of the bootstrap analysis for variability
of ranking with a statistical testing approach and found examples where
there was a highly significant difference between the winner and the
second, but bootstrap analysis showed that ranking was very variable, and vice versa.
Boxplots with and without dots were produced to visualize results. In all boxplots, the boldfaced black line represents the median while the box represents
thefirst and third quartile. The upper whisker extends to the largest observation
≤median + 1.5 IQR, and likewise the lower whisker to the smallest observation
≥median −1.5 IQR. In horizontal boxplots, the mean is shown in addition as boldfaced gray line.
All statistical analyses were performed with R version 3.4.3 (The R Foundation
for Statistical Computing 2017). Thefigures were produced with Excel, R, Plotly
(Python), and Adobe Illustrator 2017.
Experiment: comprehensive reporting. The key research questions correspond-ing to the comprehensive challenge analysis were:
RQ1: What is the role of challenges for thefield of biomedical image analysis (e.g.
How many challenges conducted to date? In whichfields? For which algorithm
categories? Based on which modalities?)
RQ2: What is common practice related to challenge design (e.g. choice of metric(s) and ranking methods, number of training/test images, annotation practice etc.)? Are there common standards?
RQ3: Does common practice related to challenge reporting allow for reproducibility and adequate interpretation of results?
To answer these questions, a tool for instantiating the challenge parameter list
(Supplementary Table 2) introduced in the Methods section“Challenge parameter
list” was used by some of the authors (engineers and a medical student) to formalize all challenges that met our inclusion criteria as follows: (1) Initially, each challenge was independently formalized by two different observers. (2) The formalization results were automatically compared. In ambiguous cases, when the observers could not agree on the instantiation of a parameter - a third observer was consulted, and a decision was made. When refinements to the parameter list were made, the process was repeated for missing values. Based on the formalized challenge data set, a descriptive statistical analysis was performed to characterize common practice related to challenge design and reporting.
Experiment: sensitivity of challenge ranking. The primary research questions corresponding to the experiments on challenge rankings were:
RQ4: How robust are challenge rankings? What is the effect of
(a) the specific test cases used?
(b) the specific metric variant(s) applied?
(c) the rank aggregation method chosen (e.g. aggregation of metric values with
the mean vs median)?
(d) the observer who generated the reference annotation?
RQ5: Does the robustness of challenge rankings vary with different (commonly applied) metrics and ranking schemes?
RQ6: Can common practice on missing data handling be exploited to manipulate rankings?
As published data on challenges typically do not include metric results for individual data sets, we addressed these open research questions by approaching all organizers of segmentation challenges conducted in 2015 and asking them to provide detailed performance data on their tasks (124 in total). Note in this context that segmentation is by far the most important algorithm category (70% of all biomedical image analysis challenges) as detailed in the Results section. Our comprehensive challenge analysis further revealed single-metric ranking with mean and metric-based aggregation as the most frequently used ranking scheme. This is hence considered the default ranking scheme in this paper.
Our analysis further identified the DSC (92%) and the HD (47%) as the most commonly used segmentation metrics. The latter can either be applied in the original version (42%) or the 95% variant (HD95) (5%).
To be able to investigate the sensitivity of rankings with respect to several challenge design choices, the 2015 segmentation challenge organizers were asked to provide the assessment data (results for DSC, HD, and HD95) on a per data set basis for their challenge. The research questions RQ4-6 were then addressed with the following experiments:
RQ4: for all 56 segmentation tasks that met our inclusion criteria, we generated single-metric rankings with the default ranking scheme based on the DSC and the HD. We then used Kendall’s tau to investigate the effect of changing (1) the metric
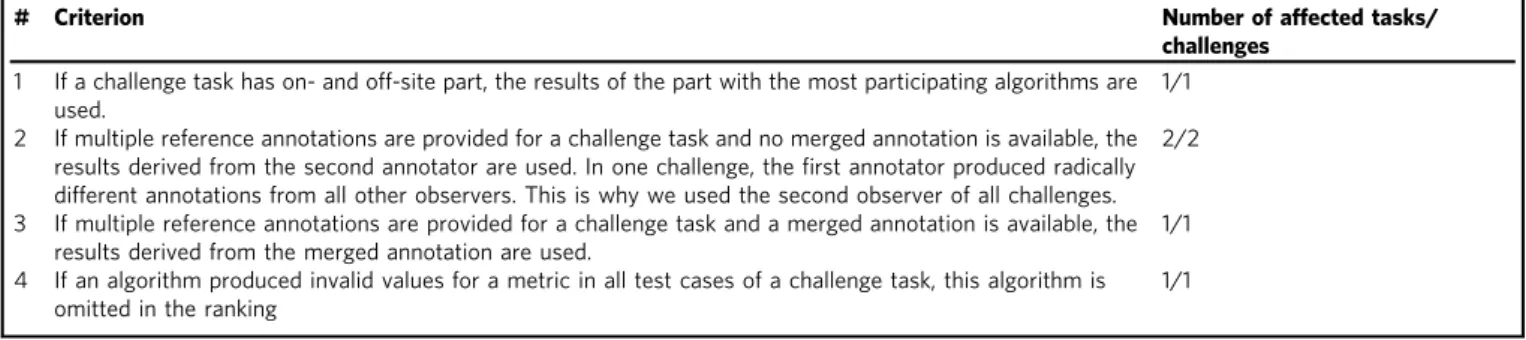
Table 2 Inclusion criteria on challenge level
# Criterion Number of affected tasks/
challenges
1 If a challenge task has on- and off-site part, the results of the part with the most participating algorithms are
used.
1/1
2 If multiple reference annotations are provided for a challenge task and no merged annotation is available, the
results derived from the second annotator are used. In one challenge, thefirst annotator produced radically
different annotations from all other observers. This is why we used the second observer of all challenges. 2/2
3 If multiple reference annotations are provided for a challenge task and a merged annotation is available, the
results derived from the merged annotation are used.
1/1
4 If an algorithm produced invalid values for a metric in all test cases of a challenge task, this algorithm is
omitted in the ranking
1/1
Table 3 Inclusion criteria on task level
# Criterion Number of
excluded tasks
1 Number of algorithms ≥3 42
2 Number of test cases > 1 (for bootstrapping
and cross-validation approaches)
25
3 No explicit argumentation against the usage
of Hausdorff Distance as metric
variant (HD vs HD95), (2) the aggregation operator (mean vs median), (3) the aggregation category (metric-based vs case-based), and (4) the observer (in case multiple annotations were available). Note in this context that we focused on single-metric rankings in order to perform a statistical analysis that enables a valid comparison across challenges.
RQ5: To quantify the robustness of rankings as a function of the metric, we generated single-metric rankings with the default ranking scheme based on the DSC, the HD, and the HD95. We then applied bootstrapping and leave-one-out analysis to quantify ranking robustness as detailed in Statistical Methods. Analogously, we compared the robustness of rankings for different aggregation methods (metric-based vs case-based) and aggregation operators (mean vs median).
RQ6: 82% of all biomedical image analysis tasks (see Results) do not report any information on missing values when determining a challenge ranking. In metric-based ranking (although not reported), it is common to simply ignore missing values. To investigate whether this common practice may be exploited by challenge participants to manipulate rankings, we performed the following analysis: For each algorithm and each task of each 2015 segmentation challenge that met our inclusion criteria, we determined the default ranking and artificially removed those
test set results whose DSC was below a threshold of t= 0.5. Note that it can be
assumed that these cases could have been relatively easily identified by visual inspection without comparing them to the reference annotations. We then compared the new ranking position of the algorithm with the position in the original (default) ranking.
International survey. As a basis for deriving best practice recommendations related to challenge design and organization, we designed a questionnaire (see Supplementary Methods) to gather known potential issues. It was distributed to colleagues of all co-authors, the challenges chairs of the past three MICCAI con-ferences as well as to the following mailing lists: ImageWorld, the mailing lists of the MICCAI society, the international society for computer aided surgery (ISCAS), the UK Euro-BioImaging project and the conferences Medical Image Under-standing and Analysis (MIUA) and Bildverarbeitung für die Medizin (BVM). The link to the questionnaire was further published on grand-challenge.org.
Data availability
Four data sets were generated and analyzed during the current study: DS1: cap-tured biomedical challenges from publicly available sources (2004–2016). DS2: 2015 segmentation challenges results provided by challenge organizers. DS3:
Individual responses to survey“Towards next-generation biomedical challenges”.
DS4: Individual responses to survey regarding refinement of parameter list. DS1 is
available from Zenodo66. DS2 is not publicly available as it contains information
that could compromise challenge participants’ privacy or consent. DS3 and DS4 are
available from the corresponding author L.M.-H. upon reasonable request. A
reporting summary for this article is available as a Supplementary Informationfile.
Received: 9 July 2018 Accepted: 7 November 2018
Published online: 06 December 2018
References
1. Ayache, N. & Duncan, J. 20th anniversary of the medical image analysis
journal (MedIA). Med. Image Anal. 33, 1–3 (2016).
2. Chen, W. Li, W. Dong, X. Pei, J. A review of biological image analysis. Curr.
Bioinform. 13, 337–343 (2018).
3. Price, K. Anything you can do, I can do better (no you can’t). Comput. Gr.
Image Process 36, 387–391 (1986).
4. West, J. et al. Comparison and evaluation of retrospective intermodality brain
image registration techniques. J. Comput. Assist. Tomogr. 21, 554–568 (1997).
5. Müller, H., Rosset, A., Vallée, J.-P., Terrier, F. & Geissbuhler, A. A reference
data set for the evaluation of medical image retrieval systems. Comput. Med.
Imaging Graph. 28, 295–305 (2004).
6. ImageCLEF/LifeCLEF– Multimedia Retrieval in CLEF. 2004.http://www.
imageclef.org/. Accessed 20 Feb 2018
7. Kalpathy-Cramer, J. et al. Evaluating performance of biomedical image
retrieval systems– an overview of the medical image retrieval task at
ImageCLEF 2004-2013. Comput. Med. Imaging Graph. 39, 55–61 (2015).
8. Cleverdon, C. W. The aslib cranfield research project on the comparative
efficiency of indexing systems. Aslib Proc. 12, 421–431 (1960). MCB UP Ltd.
9. Heimann, T. et al. Comparison and evaluation of methods for liver
segmentation from CT datasets. IEEE Trans. Med. Imaging 28, 1251–1265
(2009).
10. Chenouard, N. et al. Objective comparison of particle tracking methods. Nat.
Methods 11, 281–289 (2014).
11. Sage, Daniel et al. Quantitative evaluation of software packages for single-molecule localization microscopy. Nat. Methods 12, 717–724 (2015). 12. Menze, B. H. et al. The multimodal brain tumor image segmentation
benchmark (BRATS). IEEE Trans. Med. Imaging 34, 1993–2024 (2015).
13. Ulman, V. et al. An objective comparison of cell-tracking algorithms. Nat. Methods 14, 1141 (2017).
14. Maier-Hein, K. H. et al. The challenge of mapping the human connectome based on diffusion tractography. Nat. Commun. 8, 1349 (2017).
15. Setio, A. A. A. et al. Validation, comparison, and combination of algorithms for automatic detection of pulmonary nodules in computed tomography
images: the LUNA16 challenge. Med. Image Anal. 42, 1–13 (2017).
16. Zheng, G. et al. Evaluation and comparison of 3D intervertebral disc localization and segmentation methods for 3D T2 MR data: a grand challenge. Med. Image Anal. 35, 327–344 (2017).
17. Wang, C. W. et al. A benchmark for comparison of dental radiography analysis algorithms. Med. Image Anal. 31, 63–76 (2016).
18. Bernal, J. et al. Comparative validation of polyp detection methods in video colonoscopy: results from the MICCAI 2015 Endoscopic Vision Challenge. IEEE Trans. Med. Imaging 36, 1231–1249 (2017).
19. Sirinukunwattana, K. et al. Gland segmentation in colon histology images: The
glas challenge contest. Med. Image Anal. 35, 489–502 (2017).
20. Maier, O. et al. ISLES 2015-A public evaluation benchmark for ischemic stroke lesion segmentation from multispectral MRI. Med. Image Anal. 35,
250–269 (2017).
21. Carass, A. et al. Longitudinal multiple sclerosis lesion segmentation: resource and challenge. NeuroImage 148, 77–102 (2017).
22. Wang, C. W. et al. Evaluation and comparison of anatomical landmark detection methods for cephalometric x-ray images: a grand challenge. IEEE Trans. Med. Imaging 34, 1890–1900 (2015).
23. Bernard, O. et al. Standardized evaluation system for left ventricular segmentation algorithms in 3D echocardiography. IEEE Trans. Med. Imaging 35, 967–977 (2016).
24. Bron, E. E. et al. Standardized evaluation of algorithms for computer-aided diagnosis of dementia based on structural MRI: the CADDementia challenge.
NeuroImage 111, 562–579 (2015).
25. Jimenez-del-Toro, O. et al. Cloud-based evaluation of anatomical structure segmentation and landmark detection algorithms: VISCERAL anatomy
benchmarks. IEEE Trans. Med. Imaging 35, 2459–2475 (2016).
26. Hogeweg, L. et al. Clavicle segmentation in chest radiographs. Med. Image Anal. 16, 1490–1502 (2012).
27. Tobon-Gomez, C. et al. Benchmark for algorithms segmenting the left atrium from 3D CT and MRI datasets. IEEE Trans. Med. Imaging 34, 1460–1473 (2015).
28. Rueda, S. et al. Evaluation and comparison of current fetal ultrasound image segmentation methods for biometric measurements: a grand challenge. IEEE Trans. Med. Imaging 33, 797–813 (2014).
29. Karim, R. et al. Evaluation of state-of-the-art segmentation algorithms for left ventricle infarct from late Gadolinium enhancement MR images. Med. Image
Anal. 30, 95–107 (2016).
30. Kirişli, H. A. et al. Standardized evaluation framework for evaluating coronary
artery stenosis detection, stenosis quantification and lumen segmentation
algorithms in computed tomography angiography. Med. Image Anal. 17, 859–876 (2013).
31. Küffner, R. et al. Crowdsourced analysis of clinical trial data to predict amyotrophic lateral sclerosis progression. Nat. Biotechnol. 33, 51 (2015). 32. Daducci, A. et al. Quantitative comparison of reconstruction methods for
intra-voxelfiber recovery from diffusion MRI. IEEE Trans. Med. Imaging 33,
384–399 (2014).
33. Išgum, I. et al. Evaluation of automatic neonatal brain segmentation
algorithms: the NeoBrainS12 challenge. Med. Image Anal. 20, 135–151 (2015).
34. Foggia, P., Percannella, G., Soda, P. & Vento, M. Benchmarking HEp-2 cells
classification methods. IEEE Trans. Med. Imaging 32, 1878–1889 (2013).
35. Litjens, G. et al. Evaluation of prostate segmentation algorithms for MRI: the
PROMISE12 challenge. Med. Image Anal. 18, 359–373 (2014).
36. Petitjean, C. et al. Right ventricle segmentation from cardiac MRI: a collation study. Med. Image Anal. 19, 187–202 (2015).
37. Rudyanto, R. D. et al. Comparing algorithms for automated vessel segmentation in computed tomography scans of the lung: the VESSEL12 study. Med. Image Anal. 18, 1217–1232 (2014).
38. Tobon-Gomez, C. et al. Benchmarking framework for myocardial tracking and deformation algorithms: an open access database. Med. Image Anal. 17, 632–648 (2013).
39. Murphy, K. et al. Evaluation of registration methods on thoracic CT: the
EMPIRE10 challenge. IEEE Trans. Med. Imaging 30, 1901–1920 (2011).
40. Van Ginneken, B. et al. Comparing and combining algorithms for computer-aided detection of pulmonary nodules in computed tomography scans: the
ANODE09 study. Med. Image Anal. 14, 707–722 (2010).
41. Lo, P. et al. Extraction of airways from CT (EXACT'09). IEEE Trans. Med. Imaging 31, 2093–2107 (2012).
42. Niemeijer, M. et al. Retinopathy online challenge: automatic detection of microaneurysms in digital color fundus photographs. IEEE Trans. Med. Imaging 29, 185–195 (2010).