HAL Id: halshs-01161601
https://halshs.archives-ouvertes.fr/halshs-01161601
Preprint submitted on 8 Jun 2015HAL is a multi-disciplinary open access archive for the deposit and dissemination of sci-entific research documents, whether they are pub-lished or not. The documents may come from teaching and research institutions in France or abroad, or from public or private research centers.
L’archive ouverte pluridisciplinaire HAL, est destinée au dépôt et à la diffusion de documents scientifiques de niveau recherche, publiés ou non, émanant des établissements d’enseignement et de recherche français ou étrangers, des laboratoires publics ou privés.
Countries: Evidence from cross-country and Panel Data
Urbain Thierry Yogo
To cite this version:
Urbain Thierry Yogo. Terrorism and Fiscal Policy Volatility in Developing Countries: Evidence from cross-country and Panel Data. 2015. �halshs-01161601�
C E N T R E D'E T U D E S E T D E R E C H E R C H E S S U R L E D E V E L O P P E M E N T I N T E R N A T I O N A L
Terrorism and Fiscal Policy Volatility in Developing Countries: Evidence
from cross-country and Panel Data
Thierry Urbain YOGO
Etudes et Documents n° 14
Juin 2015CERDI
65 BD. F. MITTERRAND
63000 CLERMONT FERRAND – FRANCE TEL.+33473177400
FAX +33473177428
www.cerdi.org
To cite this document:
Yogo T. U. (2015) “Terrorism and Fiscal Policy Volatility in Developing Countries: Evidence from cross-country and Panel Data”, Etudes et Documents, n° 14, CERDI.
http://cerdi.org/production/show/id/1693/type_production_id/1
SERIE ETUDES ET DOCUMENTS
2
The authors
Thierry Urbain Yogo
Post-doctoral research fellow and Associate researcher
Clermont Université, Université d'Auvergne, CNRS, UMR 6587, CERDI, F-63009 Clermont Fd CEREG, University of Yaoundé II/Cameroon
Email: yogout@gmail.com; urbain_thierry.yogo@udamail.fr
Corresponding author: Thierry Urbain Yogo
Etudes et Documents are available online at: http://www.cerdi.org/ed
Director of Publication: Vianney Dequiedt Editor: Catherine Araujo Bonjean
Publisher: Chantal Brige-Ukpong ISSN: 2114 - 7957
Disclaimer:
Etudes et Documents is a working papers series. Working Papers are not refereed, they
constitute research in progress. Responsibility for the contents and opinions expressed in the working papers rests solely with the authors. Comments and suggestions are welcome and should be addressed to the authors.
This work was supported by the LABEX IDGM+ (ANR-10-LABX-14-01) within the program “Investissements d’Avenir” operated by the French National Research Agency (ANR)
3
Abstract
This paper investigates the effect of terrorism on fiscal policy volatility in developing countries. Using both cross-country and panel data analysis for 66 countries from 1970 to 2012, we find that an increase in the number of terrorist incidents raise the volatility of the discretionary component of fiscal policy. In addition, the analysis shows that fiscal volatility is positively influenced by the volatility of output growth, the consumer price inflation volatility, the degree of fractionalization of both the government and the opposition. The results also show that the volatility is higher is countries of small size and lower in more democratic countries. Our results are robust to reverse causality, endogeneity bias and the presence of various controls. This paper complements and extends the previous literature by providing the evidence that terrorism substantially increases the uncertainty surrounding the conduct of fiscal policy in developing countries.
Key words: Fiscal policy, Terrorism, fiscal policy volatility JEL codes: E60, H30, D74, O11
Acknowledgment
The author thanks J.L. Combes, Rasmany Ouedraogo, Eric Kere, Douzounet Mallaye and Christian Ebeke for their useful comments and suggestions.
4
1. Introduction
In 2013, a total of 9,707 terrorist attacks occurred worldwide, resulting in more than 17,800 deaths and more than 32,500 injuries (START1, 2013). In addition terrorist attacks lead to a wide range of economic and social consequences, including the destruction of human and physical capital. The consequences of terrorism are particularly severe in developing countries which are more vulnerable to external shocks and domestic shocks. While there is a long tradition in the economic profession to assess the economic consequences of conflicts, terrorism has received little attention. However, the 2001 terrorist attacks triggered a new wave of studies aiming to assess the economic cost of terrorism. In this line the early paper of Gupta et al (2004) highlights the fiscal consequences of terrorism in low and middle income countries. Their findings show that terrorism is associated with lower tax revenues, higher government spending on defense and changes in the composition of government spending. Recently, Drakos and Konstantinou (2014) have shown that a shock in terrorism risk significantly increases the subsequent trajectory of public order and safety spending in European countries. However these studies fail to address the effect of terrorist incidents on the uncertainty surrounding the conduct of fiscal policy.
In this study, we explore the potential effects of terrorism on the volatility of the discretionary component of fiscal policy in developing countries. In fact terrorism attacks raise the uncertainty on both local and foreign investments, deteriorate business climate and drive out tourists and potential revenues. Since tax revenues are likely to be affected by the level of both domestic and foreign investment, terrorism may result in greater fiscal instability. Likewise, in response to terrorist attacks, governments increase public spending on homeland security. This comes at the expense of fiscal stability because terrorism negatively affects the tax base and lowers the efficiency of tax administration. In addition terrorist incidents can undermine consumer and investor confidence. This may reduce incentives to spend or invest. The uncertainty associated to consumption and investment behavior will result in higher fiscal volatility because public spending is positively correlated with growth expectation.
The contribution of this paper is threefold. (i) We provide empirical evidence of the relationship between terrorism and fiscal policy volatility on a panel of developing countries. (ii) This article contrasts cross-country and panel data evidence while controlling for a wide range of macroeconomic and institutional factors. (iii) We propose an identification strategy to deal with the issue of endogeneity and measurement error in addressing the effect of terrorism on fiscal policy. We build upon the existing literature on the determinants of conflicts in order to provide a source of exogenous variation for terrorist incidents (see Miguel et al, 2004; Hsiang, Burke and Miguel, 2014). We argue that terrorism is more likely to occur in countries characterized by scarcity of economic resources due to long lasting economic shocks and higher initial level of conflict. Specifically, we build our instrument of terrorist incidents by multiplying the initial level of terrorism in a specific country by the variation in rainfall. Furthermore, we check the robustness of our finding by using three different methods. In the first robustness check we use the generated instrument approach coined by Lewbel (2012). The method is applied to supplement external instrument and improves the efficiency of the IV estimator. In this framework, the identification is achieved using heteroskedastic covariance restriction. For the second robustness check, we resort to the system-GMM estimator which allows for the use of lagged differences and lagged level of the explanatory variables as instruments (Blundell and Bond, 1998). Finally, we take advantage
5
of difference in difference estimator to check for the robustness of our findings. Other robustness tests include the use of the number of victims as an alternative interest variable and the disaggregation of spending between consumption and investment.
This paper is policy relevant for several reasons. The study sheds a new light on the understanding of the key drivers of fiscal uncertainty. In fact, modelling fiscal volatility is important to understand the sources of aggregate fluctuation (Fernando-Villaverde et al, 2013). In addition, fiscal volatility is reported to have a negative effect on economic activity (Woo, 2011). Therefore, understanding the sources of fiscal volatility may help design appropriate policies to reduce the vulnerability of countries to shocks.
Using a sample of 66 developing countries over the period 1970 to 2012, the paper shows that terrorism increases fiscal policy volatility in developing countries. Specifically, a one percent increase in the number of terrorist incidents induces a rise in fiscal volatility ranging between 0.21% (cross country analysis) and 0.37% (panel data analysis).
The structure of the article is as follows: Section 2 gives a brief overview of the literature. Section 3 sets out the methodology used to identify the effect of terrorism on fiscal volatility. Section 4 discusses the results and Section 5 offers conclusions.
2. Literature review
Several studies have assessed the impact of conflict and terrorism on economic activities. Addison et al (2002) find that armed conflicts and violence adversely affect financial development by undermining the confidence in domestic currency due to the fear of inflation and money depreciation. In the same line, armed conflict and violence directs financial resources away from productive assets and affect the regulation of the financial system. Using a sample of 79 countries, they find that conflicts and violence reduce financial development. This can obviously lead to lower growth since financial development is proven to be positively correlated with the former.
Addressing the effect of terrorism on the state of world economy, Abadie and Gardeazabal (2008) show both theoretically and empirically that terrorism increases uncertainty and reduces the expected return to investment. Therefore, higher intensity of terrorist attacks is associated with lower net foreign direct investment position. Estimates based on a sample of 90 countries suggest that a one standard deviation increase in the terrorist risk induces a fall in the net foreign investment position of about 5% of GDP.
Another channel through which terrorism may affect economic activities is via its impact on regional and domestic tourism. Drakos and Kutan (2003), in a study covering Greece, Israel, Turkey and Italy find that the intensity of terrorist incidents has significant domestic and cross country effects on tourism.
Terrorism also affects international trade by raising the transaction costs and the cost of doing business. As shown by Nitsch and Schumacher (2004), doubling the number of terrorist incidents may lead to a decrease of bilateral trade by 6%.
Terrorist threats may also have negative effects on fiscal stance as suggested by Gupta et al (2004), Bloomberg et al (2004). Accordingly, terrorism increase government spending at the expense of investment and macroeconomic stability. These papers contrast with the traditional literature which focuses on the macroeconomic and institutional determinants of the fiscal volatility.
6
The literature highlights a variety of factors as potential causes of volatility. This includes excessive government spending, high inflation, overvalued exchange rates, political and institutional factors. Acemoglu et al (2003) shows that countries with large public sector experience higher volatility. In fact as suggested by Gavin and Perotti (1997), the fiscal policy response to the business cycle occurs through the supply of credit which translates into higher public spending during booms and spending cuts in recession. External shocks can generate domestic inflation and act as an important source of fiscal risk. In this line, Bertin-Levecq (2002) argues that shocks in the terms of trade can negatively affect fiscal revenues, especially in countries suffering from underdeveloped tax system. In addition, the volatility of growth can be detrimental for fiscal revenues as it makes the latter less predictable. Such an effect can also occurs when the country lacks deep financial system and is unable to smooth shocks by issuing debt on domestic or international financial markets (Gavin and Perotti, 1997; Bertin-Levecq, 2002).
Woo (2005, 2011) emphasizes the role of political variables as the potential drivers of fiscal policy instability. Using a large sample of countries over the period 1960-2000, Woo (2011) finds that political instability is positively and significantly associated with fiscal policy volatility. In fact political instability can result in swings among different fiscal policies, especially if the polarization of social preferences is high (Woo, 2011). Likewise, the paper shows that there is a positive relationship between politically motivated assassinations and fiscal volatility. Woo (2011) argues that political unrest shorten the horizons of politicians and increase the likelihood of short term policies which come at the expense of macroeconomic stability.
According to Acemoglu et al (2003), economic instability is expected to be greater in institutionally weak societies. They argued that in institutionally weak societies, there are weak constraints on rulers. Therefore, rulers use their political power to redistribute assets and income to themselves in the process creating economic turbulence. In addition, when institutions are weak, political and economic instability is higher because various groups permanently fight to come to power. In the same time, politicians are forced to conduct unsustainable policies in order to satisfy various groups and remain in power.
While several papers have studied the effect of political variables on fiscal policy volatility, few papers have addressed the effect of terrorism as a shock and potential source of both political and economic instability. The early paper of Gupta et al (2004) shows that terrorism negatively and significantly impacts economic activities through changes in the level and composition of public spending. These changes come from the increase in defense and security spending in response to terrorist attacks.
In order to combat terrorism, governments increase public spending on homeland security, military operation and counter terrorism activities. This can rise fiscal imbalance and threaten fiscal consolidation. A direct consequence could be fiscal policy instability since the capacity of the government to absorb external shock by increasing expenditure or issuing debt is weakened. Likewise, Gupta et al (2004) argue that terrorism affects the fiscal account by eroding the tax base, lowering the efficiency of tax administration and changing the composition of public spending. In addition, the increase of military expenditure in response to terrorist attacks may divert the investments from the accumulation of productive capacities and crowd-out spending on social sectors including education and health. However, the empirical investigation carried out by Gupta et al (2004) shows that terrorism indeed increases defense spending, but this is at the expense of macroeconomic stability rather than at the cost
7
of lower spending in education and health. Therefore increased terrorist incidents can translate into fiscal volatility through macroeconomic instability.
This contrasts with the findings of Bloomberg et al (2004) which suggest that terrorist risk leads to an increase of consumption spending and fall in investment. Since tax revenues are likely to be affected by the level of both domestic and foreign investment, terrorism may result in greater fiscal instability. In the same line, using a panel of European countries over the period 1994-2006, Drakos and Konstantiniou (2014) find that terrorist attacks significantly increase the subsequent trajectory of public spending on public order and safety. However, the magnitude of the effect is small and lasts only one year.
3. Empirical analysis
This section revolves around three main parts. First, we describe how terrorism and fiscal policy volatility are measured. Second, the econometric model is described. Finally, we discuss the identification strategy used in order to uncover the causal effect of terrorism on fiscal volatility.
3.1. Data on Terrorism and fiscal policy volatility
3.1.1. Terrorism incident dataset
Terrorism data used in this paper are drawn from the Global Terrorism Database-GTD hereafter- which is maintained by the National Consortium for the Study of Terrorism and Responses to Terrorism (START) based at the University of Maryland.2 The START uses various sources for data collection including media articles, unclassified documents, electronic news archives, existing data sets, books and legal documents. The GTD records incidents of terrorism from 1970 to 2012 for over 160 countries. The terrorism is defined as
the threatened or actual use of illegal force and violence by a non-state actor to attain a political, economic, religious or social goal through fear, coercion or intimidation.
In order to be considered as a terrorist incident, the following conditions should be satisfied: (1) the incident must be intentional: the result of a conscious calculation on the part of a perpetrator. (2) the incident must entail some violence or threat of violence, including violence against property or/and against people. (3) The perpetrator of the incident should be sub-national actors. Therefore, GTD does not include acts of state terrorism. In addition, the action undertaken should be outside the context of legitimate warfare activities. It is worth mentioning that GTD records both national and transnational terrorism incidents. 3 The GDT reports, among other, information about the day, month and year of the terrorist incident, the duration of the incident, the incident location, the type of attack, the type of weapon used, the target and perpetrators (if known), total number of fatalities.
In this paper, we are only interested in the frequency of terrorist attacks. Therefore, we computed the number of terrorist incidents by country and by year. Since our main focus is on developing countries, we use a final sample of 66 developing countries covering the period
2
Data are available free of charge at http://www.start.umd.edu/gtd/ 3
Note that this is a plus compared to ITERATE (International Terrorism: Attributes of Terrorism Events) which record only transnational terrorism. ITERATE is an alternative source for terrorist attacks. The list of countries is provided in appendix.
8
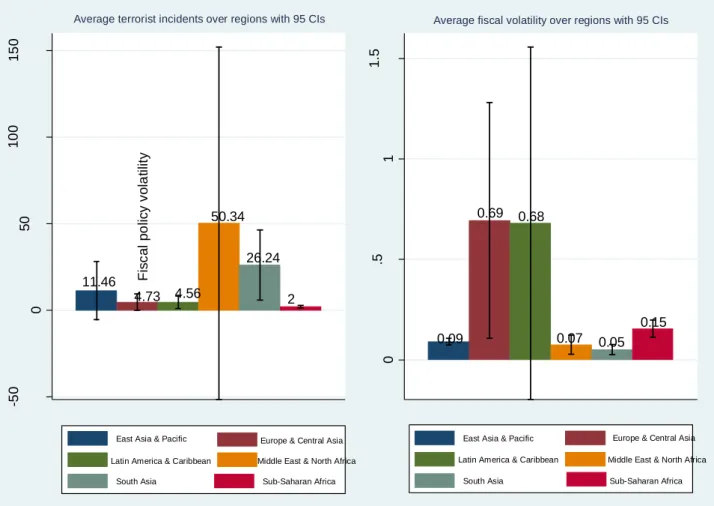
1970-2012. A brief look at the data suggests that the average number of attacks per country over the entire period stands at 6. The minimum number of terrorist incidents is 1 while the maximum recorded is 50 (see Table 1). A disaggregation of these statistics by region shows that the most affected region is the Middle East and North Africa with 50 terrorist incidents on average over the period of study. The less impacted region is Sub-Saharan Africa where 2 incidents were reported on average (see Figure 1).
Figure 1: Terrorism and fiscal policy volatility across regions
Source: Author’s calculations
3.1.2. Measuring fiscal policy volatility
In order to build the measure of fiscal policy volatility, we focus on government spending. As suggested by Woo (2011), government spending is a policy variable that is influenced by policy decisions and widely used in the implementation of government policy. Another justification often put forward is that unlike government spending, tax revenue and budget deficit are outcome of government policies4. Moreover cross-country data on government spending are more available and less subject to measurement error than tax revenues data. There are two ways to measure the volatility of fiscal policy (Woo, 2011; Cevik and Teksoz, 2014). The naïve approach consist on using the standard deviation of the annual growth rate of fiscal spending/tax revenue/primary budget balance, over the period of study. Then, it is
4
As robustness check, we alternatively use government consumption and government spending on investment. We also take into account countries which do not report any incident of terrorism by using log(1+terrorism)
11.46 4.73 50.34 4.56 26.24 2 -5 0 0 50 1 0 0 1 5 0 N u m b e r o f te rr o ri s t in c id e n ts
East Asia & Pacific Europe & Central Asia Latin America & Caribbean Middle East & North Africa
South Asia Sub-Saharan Africa
Average terrorist incidents over regions with 95 CIs
0.09 0.69 0.68 0.07 0.05 0.15 0 .5 1 1 .5 F is c a l p o lic y v o la ti lit y
East Asia & Pacific Europe & Central Asia Latin America & Caribbean Middle East & North Africa
South Asia Sub-Saharan Africa
9
worth noting that this method does not isolate the exogenous component of policy changes. However as shown by Woo (2011) and Agnello and Souza (2014), it is important to distinguish fiscal volatility from adaptability to sudden changes of economic conditions because the latter is more likely to stabilize the economy while the former may discourage growth. In this paper, we are interested in the discretionary component of fiscal policy that doesn’t represent reaction to changes in economic conditions or reflect exogenous changes in political preferences. Therefore, following Fatas and Mihov (2003), Woo (2011) and Agnello and Souza (2014), we estimate the subsequent model for each of the countries over the entire time span:
(1)
where is the real general government expenditure, is the one lag of GDP growth, is a vector of control variables including inflation and inflation squared; is the time trend. The measure of the discretionary fiscal policy volatility is the logarithm of the standard deviation of the residuals recovered from equation (1). Descriptive statistics presented in Table 1 show that the fiscal policy volatility ranges between a minimum of 0.02 and a maximum of 8.79 with an average value of 0.30 over the sample period. Likewise, consumption expenditures are less volatile than investment expenditures. A more detailed picture suggests that the more volatile region is East Europe and Central Asia while the less volatile is South Asia.
3.2. Econometric Model
This section discusses the empirical strategy which is adopted in order to identify the effect of terrorism on the fiscal policy volatility. The economic relationship we are interested in is the following:
(2)
In equation (2), is a set of control variable and is an unobserved error term. In line with the existing literature (see Woo, 2011; Agnello and Souza, 2014; Cevik and Teksoz, 2014), we use two set of control variables: macroeconomic controls and institutional controls.
10
Table 1: Descriptive statistics (cross country)
Variable Obs Mean Std. Dev. Min Max
Fiscal Volatility 65 0.3069808 1.111271 0.0241606 8.797791
Volatility of consumption expenditure 65 0.4425122 1.858663 0.024232 14.79205 Volatility of investment expenditure 65 0.4773917 1.996533 0.0252467 15.97412
Number of terrorist attacks 65 6.421705 11.52089 1 50.66667
Number of victims 65 0.1782433 0.3951999 0 2.330331
Log(GDP growth instability) 65 3.694725 2.365018 0.8934791 18.11915 Log(inflation instability) 65 1.637238 0.9616074 -.2520737 5.333652
Trade openness 65 65.65811 31.48994 16.80632 160.1294
Financial openness 65 0.3386756 0.2170911 0.0626581 1
Log(population) 65 9.231863 1.40668 6.532918 13.6172
Democracy 65 1.824248 4.298072 -7.324324 10
Major government crisis 65 0.1831016 0.2304842 0 0.9583333
Checks and balances 65 2.869416 1.051101 1 7.514286
Size of the cabinet 65 21.60354 4.8552 12.08108 31.2973
Opposition fractionalization 65 0.4541938 0.2144558 0 0.8714285
Government fractionalization 65 0.1701471 0.1687731 0 0.7326807
Income inequality 65 44.20599 7.952554 25.6129 65.27795
The first group of controls includes growth volatility, logarithm of inflation volatility, trade openness, financial openness, logarithm of population and income inequality. The growth volatility is measured as the five years rolling standard deviation of the GDP growth. It is included to control for potential effects of macroeconomic shocks on fiscal policy. In fact, the government could be forced to adjust the budget in response to sudden change in growth prospects. We therefore expect a positive effect of growth volatility on the volatility of fiscal policy. Likewise the consumer price inflation volatility is the five years rolling standard deviation of the inflation and is included to control for the destabilizing effect of external shocks such as terms of trade shocks or a depreciation of the real exchange rate5. Because the high volatility of inflation increases the uncertainty in the conduct of fiscal policy, we expect a positive relationship between these two variables. Trade openness is measured as the sum of import and export in percentage of GDP. Following Rodrik (1998) and Woo (2011), we expect a positive relationship because greater openness exposes the country to more external shocks and greater exposure to external shocks induces important fluctuations in public spending. In the same line, financial openness measures the degree of capital account’s openness and the extent to which the restrictions on international financial transactions are low. The total population enters regression to control for country size effects. As shown by Afonso et al (2010), larger country size helps to insure against idiosyncratic shocks, but spreads the cost of financing government expenditure over more taxpayers. We therefore expect a negative effect of population on fiscal policy volatility. Finally, income inequality is included in regression to take into account the potential effect of polarization on fiscal policy. As shown by Woo (2011), a high degree of polarization may lead to more volatility. Data related to growth, inflation, trade openness and population are drawn from the World
5 Note that the results qualitatively remain unchanged when we control for the volatility of oil rent which might be a potential source of fiscal volatility in resource rich countries. The main drawback is that the inclusion of this variable may reduce the explanatory power of inflation which intended to capture price shocks of various sources.
11
Development Indicator of the World Bank. Data on financial openness are from Ito and Chinn (2013). The income inequality is measured by the Gini coefficient of gross income obtained from the Standardized World Income Inequality Database (SWIID).
Concerning the institutional controls, we use a measure of democracy, major government crises, check and balances, size of the cabinet, opposition fractionalization and Government fractionalization. As a measure of democracy, we use the variable Polity2 from the Polity IV project. This variable ranges between -10 (strongly autocratic) and +10 (strongly democratic) and measures the extent to which a country is democratic. Democracy supposes more control on the executive and prevents the ruler to use excessive public spending in order to remain in power. The level of democracy should therefore be negatively correlated with fiscal policy volatility. Data on major government crises captures any rapidly developing situation (excluding revolts) that threatens to bring the downfall of the current regime. Likewise the size of the cabinet refers to the number of “cabinet rank” at the end of the year. These data are provided by the Cross National Time-Series Data Archives (CNTS). Government crisis is more likely to generate political instability. We then expect a positive relationship with fiscal policy volatility. In the same time increased size of the cabinet leads to excessive expenditure and more volatility. The check and balances captures the extent to which the action of the executive can be controlled. This measure is provided by the Database of Political Institutions (DPI) of the World Bank. The effect of check and balances on fiscal policy volatility is controversial. According to Fatas and Mihov (2003) political constraints have a negative and significant impact on the volatility. However, using a full set of controls, Agnello et al (2014) find a positive but not significant effect. The fractionalization measures the probability that two deputies picked at random from the legislature/opposition will be of different parties. We expect a positive relationship with fiscal volatility because more fractionalization induces greater infighting between various political groups (Acemoglu et al, 2003).
In equation (2), we are interested in identifying the coefficient , the effect of terrorism on fiscal policy volatility. We test the hypothesis that terrorism positively affects fiscal volatility in developing countries. In fact, an intensification of terrorist attacks induces a rise in public spending allocated to domestic security. This also drives the spending away from investment and reduces the tax base. Likewise terrorist incidents lead to higher uncertainty which affect the business climate and push the entrepreneurs to invest in activities from which they can easily and quickly withdraw their capital (Acemoglu et al, 2003). The descriptive statistics related to the control variables are presented in Table 1.
3.3. Identification strategy
The simplest strategy to estimate the effect of terrorism on fiscal volatility is to use ordinary least square regression. However, this approach may raise three distinctive issues. Although terrorist incidents are less predictable, they are deeply rooted in economic and social deprivation. Therefore, terrorism can be considered as endogenous. Thus, by using ordinary least squared, we may be capturing reverse causality or the effect of some omitted characteristics that are correlated with terrorism. In addition terrorist incidents may be measured with error. In this context, OLS estimates will be biased and the effect of terrorism on fiscal volatility will not be interpreted as causal.
In this research, our strategy is to instrument terrorism building on the existing literature on the determinants of conflicts. We argue that terrorism is more likely to occur in countries characterized by scarcity of economic resources due to long lasting economic shocks and higher initial level of conflict. Specifically, we build our instrument of terrorist incidents by
12
multiplying the initial level of terrorism in a specific country by the variation in rainfall. The formula used is the following:
(3)
In this equation, is the exogenous determinant of terrorism, is the initial level of terrorism, the number of terrorist incidents at the beginning of the sample period, measures rainfall shock and is calculated as the five years rolling standard deviation of rainfall.
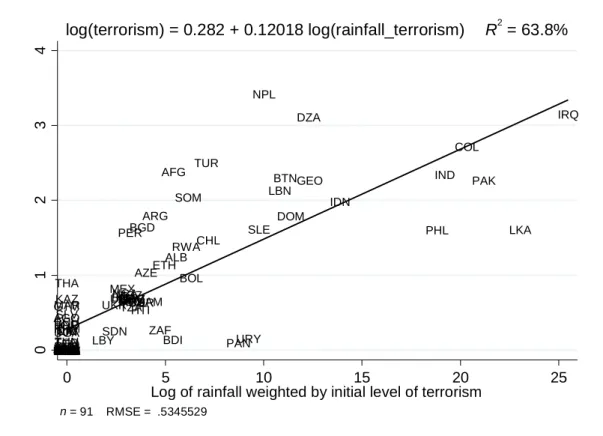
There is an increasing body of the literature highlighting the effect of economic condition on the likelihood of conflict. In a well know paper, Miguel and al (2004) shows that negative growth shocks increase the likelihood of conflict and that this effect remains unchanged whether we consider a more democratic, richer or more ethnically diverse country. They also show that variation in rainfall can be considered as a source of exogenous variation of income growth. Recently Hsiang, Burke and Miguel (2014), drawing from various disciplines including economics, political science, geography and archeology, find a strong causal evidence of climate events on human conflicts. This effect holds for all major regions in the world and across time. We build upon these evidences to argue that variation in rainfall is a potential exogenous source of variation in the incidents of terrorism. However, this effect is more likely to be amplified by the initial level of terrorism. In fact, higher initial level of terrorism may reveal the inability of society to solve issues such as conflict of ideas, land conflict or address political complaints peacefully (OECD, 2013). In addition, prolonged unresolved conflicts provide a fertile ground to the spread of terrorism (Fink and Barakat, 2013; Kis-Katos et al, 2011). Using a sample of 159 countries over the period 1970-2007, Kis-Katos et al ( 2011) clearly show that terrorism increases with experiences of domestic conflict. Likewise, Drakos and Konstantinou (2013) provides evidence that terrorism risk is positively influenced by past terrorism risk. Moreover they find that public spending is ineffective in reducing observed level of terrorism. This reasoning suggests that rainfall shock weighted by the initial level of conflict is an instrument for the current incidence of terrorism. The use of initial values of variables as instrument also follows the suggestion of De la Croix and Doepke (2003), Bloomberg et al (2004). The reasoning underlying this instrumentation approach is that economic shocks as measured by the variation in rainfall increase the likelihood of terrorist attacks in the context where the culture of violence is deeply rooted6. Specifically, extreme variability in rainfall may exacerbate conflict over economic resources. In the context where the culture of violence is widespread, these conflicts are not solved through peaceful means and translate into terrorism. Figure 2 displays the first stage relationship between our instrument and the number of terrorist incidents on the whole sample period.
The figure shows a strong positive relationship between our instrument and the number of terrorist incidents. This suggests that rainfall is clearly a useful source of variation for identifying the causal effect of terrorism on fiscal volatility.
13
Figure 2: Average number of terrorist incidents versus the rainfall weighted by initial
terrorism
A major concern in this type of exercise relates to the validity of exclusion restriction. A potential violation of the exclusion restriction may arise if rainfall instrument affects fiscal volatility through channels other than terrorism. We do not think that this is the case. In fact, the exogeneity of the instrument is intuitively plausible because there is no reason to believe that fiscal volatility drives the variability in rainfall. In addition, the current state of fiscal volatility is less likely to affect the initial level of terrorism. In this sense, our instrumental approach helps to rule out the issue of reverse causality. Nevertheless, the variability in rainfall can affect fiscal policy volatility through its effect on other determinants of conflict including GDP growth and inequality. To substantiate the validity of our identification strategy, we control for the volatility of growth and for inequality in the econometric model. We also show that the results are robust to the introduction of regional dummies that permit to take into account spillover effects and common regional effect. Besides, to address the issue of measurement bias which is also a potential source of endogeneity, we use 40-years average data in cross-country analysis and five-year non overlapping mean in the panel data analysis We follow in this line Woo (2011) and Agnello and Souza (2014). In addition to the use of an instrument, we control for a full set of macroeconomic and institutional variables in order to avoid the omitted variable bias. In addition, we use the Fuller’s modified Limited Information Maximum Likelihood (LIML) which is more robust to weak instrument (Stock and Yogo, 2004; Davidson and Mackinnon, 2006a).
AFG ALB DZA AGO ARG ARM AZE BGD BLRBLZ BTN BOL BWA BRA BGR BDI KHM CAF TCD CHL COL CRI CIV DOM ECUSLV ETH FJI GAB GEO GHA GRD GTM GIN GUY HTI HND IND IDN IRQ JAM JOR KAZ KEN LBN LSO LBR LBY LTU MDG MYS MDVMLI MRT MEX MDA MNG MAR MOZ NAM NPL NIC NER NGA PAK PAN PRY PER PHL ROM RWA SEN SLE SOM ZAF LKA SDN SUR SWZ TJK TZA THA TGO TUN TUR UGA UKR URY UZB ZMB ZWE 0 1 2 3 4 N u mb e r o f te rr o ri st i n c id e n ts 0 5 10 15 20 25
Log of rainfall weighted by initial level of terrorism n = 91 RMSE = .5345529
14
Empirical findings
This section presents the results from the empirical investigation of the effect of terrorism on fiscal policy volatility. Section 4.1 takes a first look at the data to understand the behavior of fiscal volatility before and after a major episode of terrorism on the one hand. On the other hand, we compare the volatility between countries with higher terrorist incidents and countries with lower terrorist incidents. Section 4.2 discusses the results of the cross-country analysis while the results of the panel data are described in section 4.3. In section 4.4, we check the robustness of the results.
4.1. Terrorism and fiscal volatility: naïve evidence
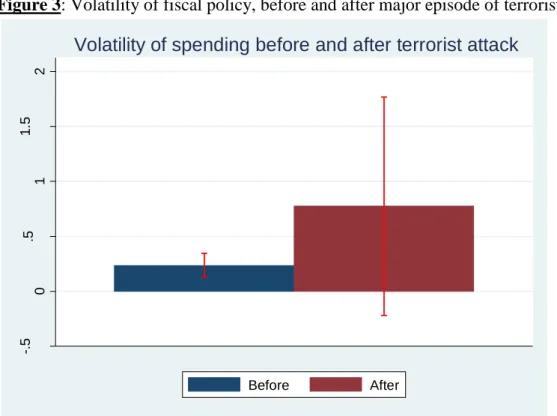
The first step of our investigation consists of comparing the magnitude of the volatility before and after a major episode of terrorist attack. We define a major episode of terrorist attack as the maximum number of terrorist incidents faced by a country over the sample period. We drop from the sample7 countries whose highest number of terrorist incidents occurs at the beginning of the sample period. The reasoning underlying this test is that fiscal policy responds to the change in the frequency of terrorist attacks. Therefore, we expect that on average the volatility of fiscal policy will be greater after a major terrorist incident.
Figure 3 present the level of volatility before and after a peak year of terrorist attacks.
Figure 3: Volatility of fiscal policy, before and after major episode of terrorist incident
Source: Author’s calculations
7 Only in this specific test.
-. 5 0 .5 1 1 .5 2 F isc a l vo la ti lit y Before After
15
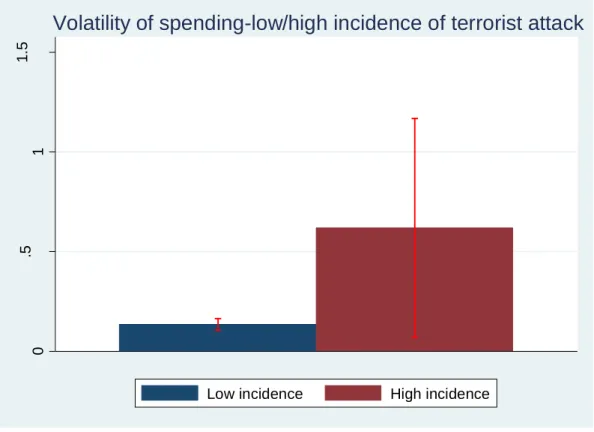
Figure 4: Volatility of fiscal policy, most affected versus less affected
Source: Author’s calculations
The figure shows that after a peak year of terrorist attacks, the volatility of fiscal policy is more than twice as the corresponding level observed prior the attack. In the same manner, split the sample around the median of the distribution and compare the volatility above and below the median. On average countries above the median experiences 14 terrorist incidents. This is almost fourteen times the number of terrorist attacks faces by countries that are below the median. Figure 4 presents the result.
Figure 4 shows that on average, the volatility of public spending is higher for countries above the median of the distribution.
Overall this first look at the data suggests that fiscal policy volatility is positively correlated with terrorism in developing countries.
4.2. Cross-country analysis
We start by quantifying the relationship between fiscal volatility and terrorism in a cross-country setting which will serve as a benchmark. Since, we are primarily interested in the long run effect of terrorism on fiscal volatility, the cross country regression will be appropriate as a starting point. In order to carry out this analysis, data are averaged over the sample period. Table 2 reports the OLS estimates as well as instrumental variable estimates. Columns (1) to (3) present the results based on the OLS estimator. We check various specifications to ensure the robustness of the results. All the specifications are controlled for regional effects and the standard errors of the coefficients are corrected using the standard Huber-White procedure. In addition, in order to ensure that the results are not driven by outliers, we implement the high breakdown MM-estimator of Yohai (1987). The estimates reported in columns (2) to (3)
0 .5 1 1 .5 F isc a l vo la ti lit y
Low incidence High incidence
16
show that the coefficients associated with terrorism are all positive and significant at the 10% level. The results also provide a support to the importance of macroeconomic factors in explaining fiscal volatility. Specifically, GDP growth instability, Inflation instability and trade openness enter regression in both positive and significant coefficients. Among the institutional variables, only the variable which measures the major government crisis has the expected positive sign. The instrumental variable estimates are presented in column (4) to (6). In all the three specifications, the effect of terrorism is positive and significant at the 5% level. Specifically a one percent increase in the number of terrorist incidents leads to a rise of volatility ranging between 0.19% and 0.21%. Taking the highest estimate, a one standard deviation increase in terrorist attacks induces a rise of 0.18 standard deviation in fiscal volatility. As it can be seen, the magnitude of the IV estimate is slightly higher than the one observed in the OLS. This reflects the fact that taking the average of data reduces the attenuation bias induced by the measurement error. Considering the validity of our instrumentation strategy, the first stage regression suggests that our instrument is not weak. The coefficient of the instrument is significant at 1% level and the Fisher test of the weak identification is higher than the critical values of the size of bias as computed by Stock and Yogo (2005).
As previously discussed, it is possible that our instrument doesn’t perfectly satisfy the exclusion restriction. Even in this case, our instrumentation strategy remains valid. In fact as shown by Anderson and Rubin (1949), Moreira and Poi (2003), Berkowitz, Caner and Fang (2012), we can still draw a valid inference when the exclusion restriction is not fully satisfied. In this vein, we first provide the Anderson and Rubin (1949) confidence interval which is robust to weak instrument. This permits to draw a valid inference independently of the strength of instrument and define a set of values of parameter for which the null hypothesis of “no effect” of the endogenous variable can be rejected. The Anderson and Rubin (AR) confidence intervals are presented at the bottom of Table 2 and show that the coefficients of terrorism lie within the AR interval. However as pointed out by Berkowitz, Caner and Fang (2012), the AR test rely on a strong assumption that the instrument is perfectly exogenous and therefore may have bad small sample property. Therefore to substantiate our identification strategy, we also report the fractionally resampled AR test. The fractionally resampled AR test proposed by Berkowitz, Caner and Fang (2012), permit to draw a valid inference while allowing the instrument to be weakly correlated with the residuals of the structural equation. The results show that the hypothesis of a significant positive effect of terrorism on fiscal policy cannot be rejected at the 10% level.
Turning to the other controls included in the regression, both growth and inflation exhibit the expected positive sign. This confirms the findings of the recent paper of Cevik and Teksoz (2014). However, the results do not support the hypothesis of a significant effect of institutional variables.
17
Table 2: Terrorism and fiscal policy volatility, cross-country evidence
(1) (2) (3) (4) (5) (6)
OLS 2SLS
Dependent Variable: Log(fiscal instability) Log(fiscal instability)
Log(number of terrorist attacks) 0.112 0.132* 0.129* 0.192** 0.213** 0.218** (0.0683) (0.0745) (0.0706) (0.094) (0.093) (0.093)
Log(GDP growth instability) 0.0583** 0.0556** 0.0530** 0.041* 0.038 0.040* (0.0264) (0.0254) (0.0247) (0.025) (0.024) (0.024) Log(inflation instability) 0.291*** 0.308*** 0.302*** 0.308*** 0.327*** 0.330*** (0.0592) (0.0529) (0.0566) (0.055) (0.053) (0.054) Trade openness 0.00462* 0.00518* 0.00540* 0.002 0.003 0.002 (0.00269) (0.00295) (0.00297) (0.002) (0.002) (0.003) Financial openness -0.239 -0.255 -0.296 0.217 0.210 0.221 (0.327) (0.318) (0.317) (0.416) (0.405) (0.411) Log(population) -0.0722 -0.0876 -0.0859 -0.132** -0.144*** -0.146*** (0.0582) (0.0588) (0.0593) (0.053) (0.053) (0.055) Democracy -0.0245 -0.0234 -0.0209 -0.029* -0.026 -0.028 (0.0223) (0.0220) (0.0210) (0.017) (0.017) (0.018) Major government crisis 0.545** 0.521** 0.555*** 0.394** 0.362* 0.339
(0.232) (0.202) (0.209) (0.192) (0.185) (0.212) Checks and balances 0.0680 0.0445 0.0408 0.104** 0.073 0.079
(0.0666) (0.0671) (0.0585) (0.052) (0.058) (0.061) Size of the cabinet 0.00711 0.00744 0.00840 0.013 0.015 0.014
(0.0114) (0.0105) (0.0105) (0.010) (0.010) (0.011) Opposition fractionalization 0.236 0.232 0.285 0.273 (0.423) (0.357) (0.281) (0.283) Government fractionalization 0.194 0.221 0.109 0.120 (0.322) (0.374) (0.294) (0.320) Income inequality -0.00662 0.004 (0.0100) (0.010) Intercept -3.221*** -3.218*** -2.977*** -2.881*** -2.918*** -3.028*** (0.665) (0.658) (0.712) (0.559) (0.552) (0.610) Continent fixed effect Yes Yes Yes Yes Yes Yes
First stage
Log(rainfall weighted by initial terrorism) 0.079*** 0.077*** 0.078*** (0.017) (0.017) (0.017)
Observations 66 66 65 66 66 65 R squared 0.454 0.455 0.456 0.55 0.55 0.55 F-stat for weak identification 21.354 20.947 22.213 AR-Confidence interval [-.01, .48] [ .01, .51] [ .02, .50] Fractionally resampled AR-test-Pvalues 0.10 0.10 0.10
18
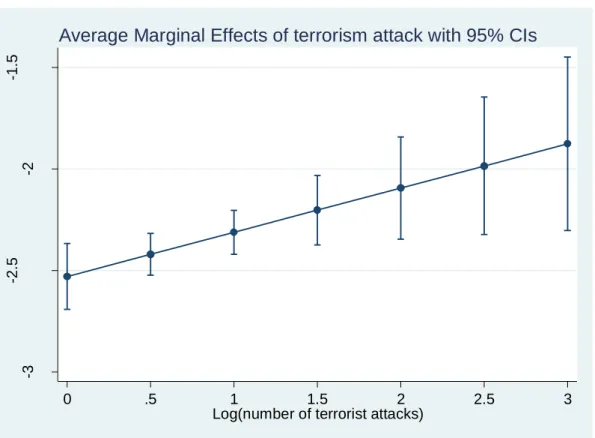
In order to refine the interpretation of the main findings, Figure 5 displays the marginal effect of terrorist attacks with 95% confidence interval. We allow the number of terrorist incidents to vary from 0 (no attack) to the maximum while the other variables in the model are set at the mean. The figure shows that everything held constant, going from no attack to the maximum increases the marginal effect of terrorism by 92%.
Figure 5: Marginal effect of terrorist attacks, cross-country analysis
Source: Author’s calculation
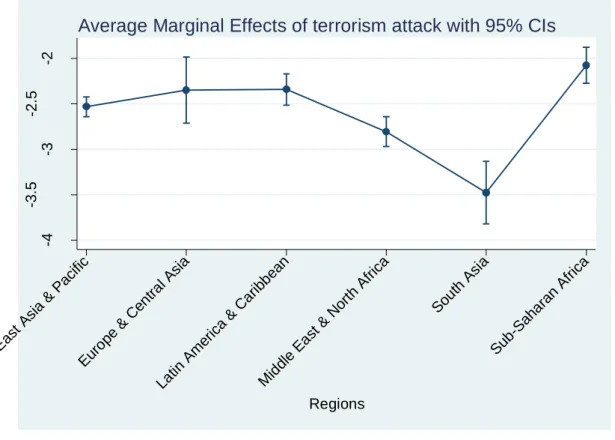
Likewise, we set the value of the number of terrorist incidents at the mean of the distribution and assess how the marginal effect changes across regions. Figure 6 shows that South Asia is the region whose volatility of fiscal policy responds less to the rise in terrorist incidents. Conversely, Sub-Saharan Africa is the region where the volatility of fiscal policy is very responsive to terrorism. The difference in the responsiveness is huge as it stands at 300%.
-3 -2 .5 -2 -1 .5 L in e a r Pr e d ict io n o f lo g (f isc a l vo la ti lit y) 0 .5 1 1.5 2 2.5 3
Log(number of terrorist attacks)
19
Figure 6: Marginal effect of terrorist attacks over regions, cross-country analysis
Source: Author’s calculation
4.3. Panel data analysis
Although the main purpose of this research is to carry-out a cross-country comparison of the response of fiscal policy to terrorist attacks, the cross-section regressions may capturing only the long run effect of terrorism. We therefore reexamine the evidence presented in Table 2 using panel regression.
Table 3 presents the OLS estimates of the effect of terrorism on fiscal policy volatility. Data are averaged over five non-overlapping years to reduce annual fluctuation and measurement error. This reduces the time dimension to seven non overlapping periods. In the first three columns, in addition to the traditional controls, we add region fixed effects and time effects. The results are similar to the ones obtained using cross-country regressions. The terrorism increases the volatility of fiscal policy by a magnitude ranging between 0.11% and 0.15%. The main macroeconomic controls are also significant with the expected sign. In contrast with the cross country analysis, the main institutional variables are significant at the 5% level. When fixed effects are introduced in the model, the effect of terrorism drops by more than half, implying that a one percent increase in terrorist attacks raises the volatility of 6%. While the use of panel data helps reduce the omitted variable bias, it can increase the measurement error bias, especially in the fixed effect setting (Bound et al., 2001; Griliches and Hausman, 1986).
-4 -3 .5 -3 -2 .5 -2 L in e a r Pr e d ict io n o f lo g (f isc a l vo la ti lit y) East As ia & Pacif ic Euro pe & Cen tral As ia Latin Am erica & C arib bean Mid dle East & N orth Africa Sout h As ia Sub-S ahara n Af rica Regions
20
Table 3: Terrorism and the volatility of fiscal policy, OLS-Fixed Effect
(1) (2) (3) (1) (2) (3)
OLS OLS
Dependent variable Log(fiscal instability) Log(fiscal instability)
Log(number of terrorist attacks) 0.113*** 0.150*** 0.136*** 0.0452 0.0709** 0.0661* (0.0439) (0.0432) (0.0438) (0.0355) (0.0335) (0.0346)
Log(GDP growth instability) 0.0361** 0.0307** 0.0480** 0.0398*** 0.0353*** 0.0516*** (0.0149) (0.0156) (0.0194) (0.0121) (0.0126) (0.0162) Log(inflation instability) 0.407*** 0.419*** 0.442*** 0.408*** 0.422*** 0.441*** (0.0817) (0.0754) (0.0850) (0.0770) (0.0719) (0.0774) Trade openness 0.00379** 0.00419** 0.00400** 0.00366*** 0.00377*** 0.00354*** (0.00182) (0.00166) (0.00187) (0.00138) (0.00125) (0.00130) Financial openness -0.137 -0.127 -0.0320 -0.127 -0.135 -0.0201 (0.202) (0.195) (0.217) (0.168) (0.163) (0.168) Log(population) -0.0582* -0.0936*** -0.0752** -0.0696* -0.100*** -0.0804** (0.0347) (0.0316) (0.0298) (0.0368) (0.0349) (0.0348) Democracy -0.0222** -0.0245*** -0.0224** -0.0278*** -0.0270*** -0.0274*** (0.00960) (0.00875) (0.0101) (0.00806) (0.00744) (0.00912) Major government crisis 0.0193 0.00332 -0.000409 -0.0807** -0.0804** -0.0893*
(0.0906) (0.0858) (0.100) (0.0378) (0.0383) (0.0481) Checks and balances 0.0662** 0.0302 0.0316* 0.0630*** 0.0388** 0.0421***
(0.0262) (0.0205) (0.0189) (0.0216) (0.0184) (0.0159) Size of the cabinet -0.00279 -0.00292 -0.00155 -0.00538 -0.00582 -0.000650
(0.00542) (0.00516) (0.00497) (0.00648) (0.00632) (0.00662) Opposition fractionalization 0.358** 0.309 0.322*** 0.287** (0.151) (0.197) (0.0947) (0.134) Government fractionalization 0.499** 0.424** 0.457*** 0.375** (0.196) (0.212) (0.147) (0.147) Income inequality 0.00173 0.00929 (0.0105) (0.00802) Intercept -2.984*** -2.862*** -3.229*** -2.750*** -2.642*** -3.446*** (0.538) (0.476) (0.777) (0.380) (0.338) (0.725) Continent fixed effect Yes Yes Yes Country fixed effect Yes Yes Yes Year fixed effects Yes Yes Yes Yes Yes Yes Observations 296 296 261 296 296 261 R-squared 0.526 0.554 0.559 0.505 0.532 0.541 Number of groups 66 66 65 66 66 65 Number of years 7 7 7 7 7 7
21
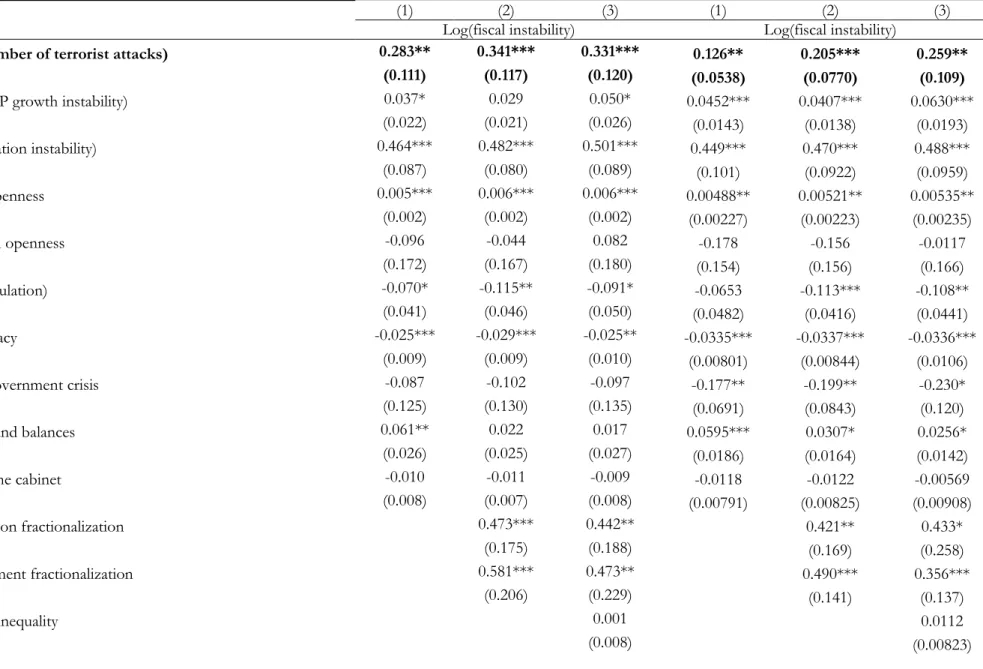
Table 4 reports the estimates of the instrumental variable regression. Columns (1) to (3) present the results with region and time effects. According to these estimates, a one percent increase in the number of terrorist attacks leads to 0.33% rise of fiscal volatility. In other words, doubling the number of terrorist attacks will increase the volatility of fiscal policy by 33%. In the next three columns we add country fixed effects in the model. As observed in the OLS case, the magnitude of the coefficients of terrorism drops by more than 50%. This may be an insight that specific country characteristics explain an important part of the observed variability of fiscal policy. Concerning the validity of our identification strategy, the first stage regression suggests that our instrument is not weak. Moreover the estimated coefficients lie within the AR confidence interval, suggesting that we can draw valid inference from the model. In addition, we report the fractionally resampled AR test of Berkowitz, Caner and Fang (2012). The test rejects the null hypothesis at the 10% level. In other word with 90% confidence we cannot reject the hypothesis that terrorism significantly affects fiscal volatility. This inference remains valid even if the exclusion restriction is not perfectly satisfied.
Table 4 also shows that the main macroeconomic controls enter in regression with the positive expected sign and most of them are significant at the 1% level. Specifically, the fiscal volatility is positively correlated with growth instability, inflation and trade openness while it is negatively affected by the size of the population. The observed negative effect of population confirms the findings of Agnello and Souza (2014) and suggests that smaller countries face more volatility due to their wider exposure to idiosyncratic shocks. Likewise, our results are in line with the ones of Cevik and Teksoz (2014) showing that the GDP growth volatility has a positive and significant effect on fiscal volatility. However, contrary to ours results, they did not find a significant effect of the volatility of consumer price inflation. Two main reasons may explain this difference in the results. First, their paper focuses on emerging and developed countries while our focus is on developing countries. Second they control for the volatility of natural resource rent which can sometimes translate into inflation. A regard with the institutional variables, an increase in the level of democracy reduce the volatility of fiscal policy by 3%. This result is consistent with the previous empirical literature (See Acemoglu et al, 2003; Agnello et Souza, 2014). In the same time, the higher the fractionalization within the government and within the opposition, the higher the volatility of fiscal policy. Our results don’t support the hypothesis of a positive effect of income inequality on fiscal policy volatility. This contrasts with the finding of Woo (2011).
22
Table 4: Terrorism and the volatility of fiscal policy, Instrumental variables estimates
(1) (2) (3) (1) (2) (3)
Log(fiscal instability) Log(fiscal instability)
Log(number of terrorist attacks) 0.283** 0.341*** 0.331*** 0.126** 0.205*** 0.259**
(0.111) (0.117) (0.120) (0.0538) (0.0770) (0.109)
Log(GDP growth instability) 0.037* 0.029 0.050* 0.0452*** 0.0407*** 0.0630***
(0.022) (0.021) (0.026) (0.0143) (0.0138) (0.0193) Log(inflation instability) 0.464*** 0.482*** 0.501*** 0.449*** 0.470*** 0.488*** (0.087) (0.080) (0.089) (0.101) (0.0922) (0.0959) Trade openness 0.005*** 0.006*** 0.006*** 0.00488** 0.00521** 0.00535** (0.002) (0.002) (0.002) (0.00227) (0.00223) (0.00235) Financial openness -0.096 -0.044 0.082 -0.178 -0.156 -0.0117 (0.172) (0.167) (0.180) (0.154) (0.156) (0.166) Log(population) -0.070* -0.115** -0.091* -0.0653 -0.113*** -0.108** (0.041) (0.046) (0.050) (0.0482) (0.0416) (0.0441) Democracy -0.025*** -0.029*** -0.025** -0.0335*** -0.0337*** -0.0336*** (0.009) (0.009) (0.010) (0.00801) (0.00844) (0.0106)
Major government crisis -0.087 -0.102 -0.097 -0.177** -0.199** -0.230*
(0.125) (0.130) (0.135) (0.0691) (0.0843) (0.120)
Checks and balances 0.061** 0.022 0.017 0.0595*** 0.0307* 0.0256*
(0.026) (0.025) (0.027) (0.0186) (0.0164) (0.0142)
Size of the cabinet -0.010 -0.011 -0.009 -0.0118 -0.0122 -0.00569
(0.008) (0.007) (0.008) (0.00791) (0.00825) (0.00908) Opposition fractionalization 0.473*** 0.442** 0.421** 0.433* (0.175) (0.188) (0.169) (0.258) Government fractionalization 0.581*** 0.473** 0.490*** 0.356*** (0.206) (0.229) (0.141) (0.137) Income inequality 0.001 0.0112 (0.008) (0.00823)
23
Intercept -2.950*** -2.839*** -3.362*** -3.001*** -2.785*** -3.501***
(0.490) (0.453) (0.581) (0.571) (0.485) (0.801)
Continent fixed effect Yes Yes Yes
Year fixed effects Yes Yes Yes Yes Yes Yes
Country fixed effects Yes Yes Yes
First stage
Log(rainfall weighted by initial terrorism), t-1 0.064*** 0.062*** 0.060*** 0.064*** 0.062*** 0.060***
(0.010) (0.010) (0.010) (0.003) (0.004) (0.006)
Observations 257 257 230 257 257 230
No of countries 66 66 65 66 66 65
R squared 0.53 0.55 0.57 0.53 0.55 0.56
F-stat for weak identification. 41.877 39.607 36.304 288.21 168.93 90.90
AR-Confidence interval [ 0.08, .57] [ 0.13, .65] [ 0.11, .65] [-0.17, .42] [-0.17, .38] [-0.17, .34]
Fractionally resampled AR-test-Pvalues 0.06 0.06 0.08 0.07 0.08 0.07
24
Two surprising results emerge from Table 4. First, the coefficient of the check and balances does not have the expected sign. The reported effect is positive and significant, especially in the fixed effect model. This contrasts with previous evidences suggesting that more control on the ruler is associated with lower fiscal policy volatility. A potential explanation of this result is that in the context where both the government and the opposition are made up of political parties coming from different background, the higher their power on the executive the higher the difficulty to reach an agreement on the conduct of the fiscal policy. This obviously leads to more fiscal policy volatility. Our findings also suggest that once the model is controlled for fixed effect, the number of major economic crises reduce fiscal volatility. A possible interpretation of this result is that when both the government and the opposition are divided on the way of conducting fiscal policy, major crises allow returning to a more orthodox fiscal policy.
In order to have a better understanding of the main findings of the panel data regression, figure 7 shows the marginal effect of terrorist attacks over the entire sample period.
Figure 7: Marginal effect of terrorist attacks, panel data analysis
Source: Author’s calculations
As in cross-country analysis, we allow the number of terrorist incidents to vary from the minimum value to the maximum while keeping the other controls at the mean. The figure shows that fiscal volatility indeed increases with the number of incident attacks. However, the magnitude is higher than what is observed in cross country regressions. Over the entire period, the increase amounts to 218% of the initial level of volatility. In the same time, the effect of terrorism seems to decrease over the time. The speed of the decrease is lower at the upper level of the distribution of terrorist attacks. For countries at the lower level of the distribution, the effect of terrorism drops by 6.51% while the corresponding fall is 4.63% at the upper level of the distribution, implying that the most affected countries take much time to recover. -3 -2 -1 0 L in e a r Pr e d ict io n o f th e L o g (f isc a l vo la ti lit y) 0 .5 1 1.5 2 2.5 3 3.5
Log(number of terrorist attacks)
year=2 year=3
year=4 year=5
year=6 year=7
year=8
25
We run a similar exercise while analyzing the variation of the responses across regions. Figure 8 presents the results. The figure shows that South Asia is the less responsive region while Sub-Saharan Africa is the most responsive one. This result is consistent with the findings of the cross-country analysis and confirms the findings of previous studies on the high vulnerability of Sub-Saharan Africa.
Figure 8: Marginal effect of terrorist attacks over regions, panel data analysis
Source: Author’s calculations
4.4. Robustness check
We propose three tests in order to check the robustness of our findings. First, we use the generated instrument approach proposed by Lewbel (2012) to improve the identification of the effect of terrorism on fiscal policy volatility. The method of Lewbel (2012) serves to identify structural parameters in models with endogenous regressors in the absence of external instrument. The method may also be applied to supplement external instrument to improve the efficiency of the IV estimator. This is particularly of interest because it allows performing the Hansen test of orthogonality restriction which cannot be performed in the case of exact identification. In the Lewbel’s framework, the identification is achieved using heteroskedastic covariance restriction. In a single equation, generated instruments are constructed from the first stage regression equation, by multiplying the residuals by each of the included exogenous
-5 -4 -3 -2 -1 0 L in e a r Pr e d ict io n o f th e L o g (f isc a l vo la ti lit y) 0 .5 1 1.5 2 2.5 3 3.5 (mean) lnbt
East Asia & Pacific Europe & Central Asia Latin America & Caribbean Middle East & North Africa
South Asia Sub-Saharan Africa
26
variables in mean-centered form. The results of this regression are presented in Table 5. In the first two columns of this table, we replicate the standard results of the IV estimates while controlling for the number of casualties per terrorist attack. The main reasoning underlying this specification is that a country may undergo a single terrorist attack, but a huge number of casualties. Therefore falling to control for this variable may lead to biased estimates. In fact one may expect that the government is more responsive when the number of casualties is higher. In this case, our finding may capture not the genuine effect of increased incidents of terrorism, but the emotional effect generated by casualties. This is not the case as the estimates reported in Table 5 remains qualitatively stable and very close to that of the baseline model. The two remaining columns of Table 5 provide the results obtained using the method of Lewbel (2012). The estimates are qualitatively unchanged although the magnitude of the effect is smaller than what is obtained from the baseline model. A lower estimate suggests an increase of 0.15% of fiscal volatility for a one percent increase in the number of terrorist incidents. In addition, the P-value of the Hansen J test is 0.27 and suggests that the resulting model is over identified.
27
Table 5: Terrorism and fiscal volatility, Robustness check1
(1) (2) (3) (4)
Dependent variable : Log(fiscal instability) Instrumental Variable Generated instrument approach
Log(number of terrorist attacks) 0.33157*** 0.213** 0.167* 0.151**
(0.12003) (0.102) (0.0967) (0.0769)
Log(GDP growth instability) 0.05005* 0.0620*** 0.0381 0.0500*
(0.02655) (0.0189) (0.0260) (0.0284) Log(inflation instability) 0.50149*** 0.476*** 0.323*** 0.489*** (0.08863) (0.0949) (0.0645) (0.0917) Trade openness 0.00620*** 0.00536** 0.00221 0.00505* (0.00210) (0.00228) (0.00229) (0.00260) Financial openness 0.08977 0.00896 0.253 0.0231 (0.18214) (0.169) (0.317) (0.187) Log(population) -0.09052* -0.100** -0.132** -0.0589 (0.04974) (0.0438) (0.0590) (0.0487) Democracy -0.02448** -0.0279*** -0.0302* -0.0244** (0.01025) (0.0101) (0.0177) (0.0113)
Major government crisis -0.09873 -0.193* 0.388 -0.0505
(0.13579) (0.103) (0.285) (0.139)
Checks and balances 0.01744 0.0223* 0.0909 0.0342
(0.02749) (0.0133) (0.0709) (0.0239)
Size of the cabinet -0.00861 -0.00265 0.0156 -0.00831
(0.00803) (0.00872) (0.0157) (0.00796) Opposition fractionalization 0.44513** 0.415* 0.261 0.358* (0.18810) (0.244) (0.273) (0.202) Government fractionalization 0.46840** 0.382*** 0.0674 0.420 (0.22997) (0.141) (0.349) (0.260) Income inequality 0.00065 0.00938 0.00578 0.00280 (0.00828) (0.00808) (0.00851) (0.00915)
28
(0.00016) (9.19e-05) (0.00156) (0.000142)
Intercept -3.37860*** -3.531*** -3.260*** -3.441***
(0.58455) (0.840) (0.713) (0.729)
Continent fixed effect Yes Yes Yes
Year fixed effects Yes Yes
Country fixed effects Yes
First stage
Log(rainfall weighted by initial terrorism), t-1 0.05988*** 0.060160***
(0.00996) (0.00531)
Observations 230 238 65 230
No of countries 65 65 65 65
R squared 0.57 0.61 0.570 0.598
F-stat for weak ident. 36.15577 128 7.613 22.19
Hansen test-Pvalue 0.406 0.276
Fractionally resampled AR-test-Pvalues 0.07 0.08
29
The second approach used to test the robustness of our findings is the general method of moment (GMM) in a dynamic panel data setting. This approach allows addressing the issue of the endogeneity of the main explanatory variable (terrorism) as well as the potential endogeneity of some covariates. We use the two-step system GMM with Windmeijer’s(2005) correction of standard errors. In this setting equations in level and equations in differences are combined in a system where lagged variables in difference are used as instruments of the current variable in level. In the same time, lagged variables in level are used to instrument current variables in difference. The Hansen J test is performed to check the validity of the instruments alongside with the first and second order autocorrelation test.
The results are reported in Table 6. Looking at the more complete specification, a one percent increase in the number of terrorist attacks leads to 0.37% increase in fiscal policy volatility. The magnitude of this effect is higher than the upper bound estimate in the baseline IV model. A potential explanation of this result is the fact in the dynamic GMM model we control for the potential endogeneity of some control variables. In fact, Acemoglu et al (2001) show that falling to account for the endogeneity of some controls may lead to downward bias in the coefficient of (coefficient of terrorism).
Third, we perform difference in difference treatment effect estimation. Specifically, we built our treatment variable by splitting the sample between most affected and less affected countries according to the mean of the distribution. Thus we generate a variable taking the value 1 for countries that record a number of terrorist incidents above the mean, and 0 otherwise. In order to construct the variable of policy change, for each country we record the year corresponding to the maximum number of terrorist attacks undergo over the sample period. Therefore, our policy variable takes the value 1 for the years following the major episode of terrorist attacks. The results of the difference in difference estimates are presented in Table 7 and confirm the positive effect of terrorism on fiscal policy volatility. A one percent increase in the number of terrorist attacks induces a rise of volatility of 0.24 to 0.31 percent.
30
Table 6: Terrorism and fiscal volatility, Robustness check-two-step GMM estimates
(1) (2) (3)
Log(Fiscal volatility)
Log(Fiscal volatility),t-1 0.05430 -0.05217 0.07100
(0.10293) (0.08356) (0.07113)
Log(number of terrorist attacks) 0.37933* 0.64000* 0.43767**
(0.22210) (0.35100) (0.17820)
Log(GDP growth instability) 0.07178 0.07053 0.07952*
(0.05071) (0.04573) (0.04733) Log(inflation instability) 0.45222*** 0.38047*** 0.41742*** (0.11427) (0.12330) (0.08034) Trade openness 0.00912* 0.01161*** 0.00610* (0.00532) (0.00408) (0.00357) Financial openness 0.25157 -0.02394 0.00344 (0.28141) (0.38730) (0.33167) Log(population) 0.01239 0.09156 -0.01958 (0.13200) (0.13116) (0.12362) Democracy -0.02702 -0.02018 -0.03732 (0.02113) (0.02095) (0.02361)
Major government crisis -0.22446 -0.37789* -0.24401
(0.15283) (0.21596) (0.17224)
Checks and balances -0.06835 -0.08992 -0.05512
(0.07358) (0.08603) (0.06101)
Size of the cabinet -0.01147 -0.02930 -0.02169
(0.01652) (0.01939) (0.01682) Opposition fractionalization 0.56261** 0.72137* (0.26288) (0.38708) Government fractionalization 0.59368* 0.51024 (0.30921) (0.46770) Income inequality 0.00271 (0.03418) Number of victims 0.00008 -0.00006 (0.00019) (0.00037) Intercept -4.28842* -4.51149*** -3.29265*** (2.32763) (1.21748) (1.23901) Number of observations 218 243 243 Number of countries 60 61 61 Number of instruments 43 37 41 AR test first 0.052 0.046 0.037 AR test second 0.643 0.885 0.664 Hansen test-Pvalue 0.864 0.797 0.697