HAL Id: halshs-00552220
https://halshs.archives-ouvertes.fr/halshs-00552220
Preprint submitted on 5 Jan 2011
HAL is a multi-disciplinary open access archive for the deposit and dissemination of sci-entific research documents, whether they are pub-lished or not. The documents may come from teaching and research institutions in France or abroad, or from public or private research centers.
L’archive ouverte pluridisciplinaire HAL, est destinée au dépôt et à la diffusion de documents scientifiques de niveau recherche, publiés ou non, émanant des établissements d’enseignement et de recherche français ou étrangers, des laboratoires publics ou privés.
output growth volatility in developing countries?
Jean-Louis Combes, Christian Hubert Ebeke
To cite this version:
Jean-Louis Combes, Christian Hubert Ebeke. Do remittances dampen the effect of natural disasters on output growth volatility in developing countries?. 2011. �halshs-00552220�
1
Document de travail de la série Etudes et Documents
E 2010.31
Do remittances dampen the effect of natural disasters on output growth
volatility in developing countries?
Jean-Louis COMBES(*) and Christian EBEKE (*)(1)
November 2010
(*) Clermont Université, Université d’Auvergne, Centre d’Etudes et de Recherches sur le Développement International, BP 10448, F-63000 FERRAND. CNRS, UMR 6587, CERDI, F-63009 CLERMONT-FERRAND.
Email: J-L.Combes@u-clermont1.fr
(1) Corresponding author: Christian EBEKE (Christian_Hubert.Ebeke@u-clermont1.fr) Tel: (33) 4 731 775 01 - Fax: (33) 4 731 774 28
2
Summary –.
This paper analyzes the impact of natural disasters on the output growth volatility. Using a large sample of developing countries and mobilizing a dynamic panel data framework, it uncovers a diminishing macroeconomic destabilizing consequence of natural disasters as remittance inflows rise. It appears that the effect of natural disasters disappears for a remittance ratio above 8% of GDP. However, remittances aggravate the destabilizing effects of natural disasters when they exceed 17% of GDP.Keywords: Natural disasters, output growth volatility, remittances JEL codes: Q54, E32, F24
3
1. INTRODUCTION
The question of the costs of natural disasters becomes crucial following the fear about the consequences of the global warming which could amplify the occurrence of extreme climatic events particularly in the tropical zones (IPCC Report, 2007). These climatic events combined with geophysical disasters are a major concern in developing countries due to their lower degree of resilience to shocks (Kahn, 2005; Noy, 2009; Cuaresma, 2010). For instance, Naude (2010) using the CRED statistics, shows that Sub-Saharan Africa and South Asia recorded between 1974 and 2003, the largest number of people affected by natural disasters. Natural disasters are shown to permanently and negatively affecting growth in developing countries through lower investments in education (Cuaresma, 2010) and by pushing households into poverty traps (Carter et al., 2007).
According to some recent evidences (Haiti) and existing papers, natural disasters tend to significantly increase remittances, whereas foreign aid seems less sensitive to disaster shocks (Yang, 2008b; Mohapatra et al., 2009; David, 2010). Whether the altruistic response of migrants in the aftermath of natural disasters is generally observed, little is known about the effectiveness of remittances in the macroeconomic stabilization in this context. It’s worth noting that the increase in remittances after a disaster doesn’t always imply a stabilizing impact. Indeed, remittances will be stabilizing if they react immediately to the shock. Moreover, the size of remittance inflows matters: excessive remittances could generate inflation and real exchange appreciation in a context of destroyed productive capacities. The dependence on remittances can also lead to the well-known problem of ‘Samaritan dilemma’1: they might reduce the private demand for insurance and thereby they increase the costs of natural disasters.
1
The literature on the ‘Samaritan dilemma’ in the context of natural disasters includes among others, Raschky and Weck-Hannemann (2007); Cavallo and Noy (2009) and Kunreuther and Pauly (2009)
4
This paper is the first study, to our knowledge, quantifying the stabilizing role played by remittances in developing countries facing natural disasters. While previous studies in the literature have highlighted the role of some factors shaping the macroeconomic effects of disasters2, it is surprising to see that remittances are omitted in the debate regarding the strategies available to cope with natural disaster shocks. Rather than focusing on the effects of natural disasters on economic growth, this paper examines their consequences on the volatility of economic growth. It therefore tests two hypotheses: (i) remittances on average dampen the destabilizing effect of natural disasters and (ii) beyond a given threshold the stabilizing role of remittances disappears.
Two mechanisms through which the stabilizing effect of remittances holds can be pointed-out: by providing a form of private insurance (ex post risk management strategy) and/or by promoting ex ante risk preparedness (ex ante risk management strategy). For the later case, several channels can be raised (Mohapatra et al., 2009). Remittances can favor the diversification of activities. They can affect the choice of the localization of the productive activities toward less prone disaster areas. They can also help finance the acquisition of new technologies more resistant to natural shocks (seeds, housing built of concrete …). Remittances could not only reduce the magnitude of natural disasters but also, for a given number of people affected, they lower the resulting output volatility.
However, these stabilizing effects could be mitigated by the inflation generated by large remittance inflows and by the moral hazard effect that large remittance inflows can exert on recipient households (‘Samaritan dilemma’).
These hypotheses are tested on a large sample of developing countries (113) observed over the period 1980-2007 and by using dynamic panel data estimators. The results highlight a
2
See Noy (2009) on the discussion of the role of education, financial development, fiscal and trade policies, financial openness, and foreign reserves; Raschky (2008) for the role of domestic political institutions and Ramcharan (2007) for a discussion on the role of the exchange rate regime.
5
positive and significant impact of natural disasters on output growth volatility. It appears that remittances dampen the marginal destabilizing effect of natural disasters. This effect is maximized for remittance ratios belonging to the interval 8% - 17 % of GDP. However, above this high threshold, remittance inflows reinforce the positive impact of disasters on macroeconomic instability.
The remainder of the paper is the following. Section 2 presents the econometric models, the data, the method and discusses the preliminary results. Section 3 checks the robustness of these results. Section 4 concludes.
2. ECONOMETRIC SPECIFICATIONS AND PRELIMINARY RESULTS
a) Models
The following models are specified to test the impact of natural disasters conditional on the level of remittance inflows.
The first equation describes the impact of natural disasters on output growth volatility.
τ τ τ τ − τ τ =ρσ + ′ β+θ + +η +ε σi, i, 1 Xi, 1Di, ui i, (1)
where σi,τ is the output per capita growth volatility, X the matrix of control variables and D the indicator of the magnitude of natural disasters occurred in each country. ui represents the
country fixed-effects and η the period dummies. i , τ τ are respectively the country and the
non-overlapping 5-year sub-periods over 1980-2007.3 The hypothesis tested is that θ1 >0.
3
The last sub-period is however defined over 3 years rather than 5 due to the lack of available data in the Penn World 6.3 dataset.
6
The second equation reports the stabilizing contribution of remittances on output. We follow the standard specifications by including remittances linearly (Bugamelli and Paternò, 2009; Chami et al., 2009): τ τ τ τ − τ τ =ρσ + ′ β+θ + +η +ε σi, i, 1 Xi, 2Ri, ui i, (2)
where R represents the remittance- to-GDP ratio. The hypothesis tested is that θ2 <0.
The third model reports again the stabilizing contribution of remittances but controlling for the disaster variable.
τ τ τ τ τ − τ τ =ρσ + ′ β+θ +θ + +η +ε σi, i, 1 Xi, 3Di, 4Ri, ui i, (3)
The expected signs are θ3 >0 and θ4 <0. If remittances reduced the magnitude of the
natural disasters, one would observe a decrease in absolute term, of the coefficient of remittances. More precisely, one would have: θ4 < θ2 . Indeed, θ2 catches the total
stabilizing effect of remittances (their direct and indirect impacts on output growth volatility). When the disaster variable is introduced besides remittances, the residual impact of remittances (θ4) now measures only the direct effect that doesn’t pass through the reduction
of the magnitude of disasters. We expect θ > 3 θ1. This happens because remittances can
generate countercyclical remittance inflows (Yang, 2008; Mohapatra et al., 2009; David, 2010). Controlling for remittances ensures that the impact of natural disasters does not include a stabilizing component due to a surge of countercyclical remittance inflows.
7 τ τ τ τ τ τ τ − τ τ=ρσ + ′ β+θ +θ +θ ∗ + +η +ε σi, i, 1 Xi, 5Di, 6Ri, 7Di, Ri, ui i, (4)
The main hypothesis tested is that the impact of natural disasters is less positive as the level of remittances increases. More precisely, we expect that θ5 >0 and θ7 <0. No specific claim regarding the sign of θ , the impact of remittances without natural disasters, is formulated. 6 Given that θ and 5 θ have opposite signs, a threshold level of remittances arises: 7
7 5 * , 7 5 , , 0 = θ θ − = ⇒ = θ + θ ∂ σ ∂ τ τ τ R R Di i i *
R measures the minimum remittance ratio required for a full absorption of the effect of natural disasters.
The matrix of standard control variables includes the following variables. The lagged output growth volatility is included to catch the inertia in the dependent variable (Yang, 2008a). Trade openness would have a positive effect on output growth volatility given that trade openness can enhance sectorial specialization what increases the degree of exposure to external shocks (Di Giovanni and Levchenko, 2009). Terms of trade volatility is also a potential candidate for enhancing macroeconomic instability. The government size may positively contribute to macroeconomic instability in developing countries (Bekaert et al. 2006). Finally, as shown by Fatas and Mihov (2003), the discretionary fiscal policy is assumed to fuel output growth volatility. The term discretionary fiscal policy refers to changes in fiscal policy that do not represent reaction to economic conditions.
b) Data and sample
Following existing studies (Chami et al., 2008; Bugamelli and Paternò, 2009, Chami et al., 2009), the dependent variable is computed as the standard deviation of the GDP per capita growth rate over each sub-period. GDP per capita growth rate is drawn from the Penn World Tables 6.3. The remaining variables are computed as 5-year averages over each sub-period.
8
Natural disaster data are drawn from Center for Research on the Epidemiology of Disasters (CRED), Emergency Events Database (EM-DAT).4 CRED defines a disaster as a natural situation or event which overwhelms local capacity, implying a request for external assistance (Noy, 2009; EM-DAT Glossary of terms).5 We consider all disaster events taken together within a country in a year rather than each of them examined separately. Indeed, it’s difficult to assume that the stabilizing role of remittances differs among types of disasters: what matters for the migrant is the magnitude of the disaster and not its type. The total number of people affected over the sub-period over the population at each of the beginning sub-period is used as a magnitude indicator.6 Two main arguments justify the choice for this variable (Loayza et al., 2009). Firstly, the measurement error associated with the proportion of people affected seems lower than that associated with a variable reporting the damage costs in US dollars. Secondly, the endogeneity concerns are more plausible with the damage costs which are closely related to macroeconomic instability and growth.7
The remittance variable records current transfers to nonresidents by migrants who are employed in, and considered a resident of, the countries that host them. The variable is normalized by country initial GDP.8 Data are drawn from the IMF Balance of Payments Yearbook (various editions).
4
The Center for Research on the Epidemiology of Disasters (CRED) has collected and made publically available data on the occurrence and effects of natural disasters from 1900 to the present with a worldwide coverage. The database is compiled from various sources, including UN agencies, non-governmental organizations, insurance companies, research institutions and press agencies. The EM-DAT data is publicly available on CRED's web site at: www.cred.be.
5
These disasters can be grouped into several categories, of which meteorological disasters (floods, wave surges, storms, droughts, landslides and avalanches), climatological disasters (disasters caused due to long run or seasonal climatic variability such as drought, extreme temperatures and wild fire) and geophysical disasters (earthquakes, tsunamis and volcanic eruptions).
6
The sum of people affected and killed is also used as an indicator of the natural disaster magnitude and results remain the same. Tables are available upon request.
7
Output growth volatility can decrease the factors accumulation and therefore the mean growth rate (Ramey and Ramey, 1995). Hence, the damage costs which are proportional to the level of accumulation would be lower in countries with high macroeconomic volatility.
8
Dividing remittances by the level of GDP at each of the beginning of 5-year sub-period allows neutralizing the effects of natural disasters on the denominator.
9
Trade openness and government size are the ratios of exports and imports and government consumption to GDP, respectively (Penn World Table 6.3). The volatility of the terms of trade is the standard deviation of the terms of trade growth rate (World Economic Outlook, IMF). Discretionary fiscal policyis measured as the standard deviation of the residual component of the log difference of government consumption from an econometric model of the former over the log difference of GDP, a time trend and inflation in a quadratic form (Fatas and Mihov, 2003). 9
The sample comprises at most 113 developing countries and is unbalanced (for a maximum of observations stood at 403). The list of countries and descriptive statistics of all the variables used are presented in appendix.
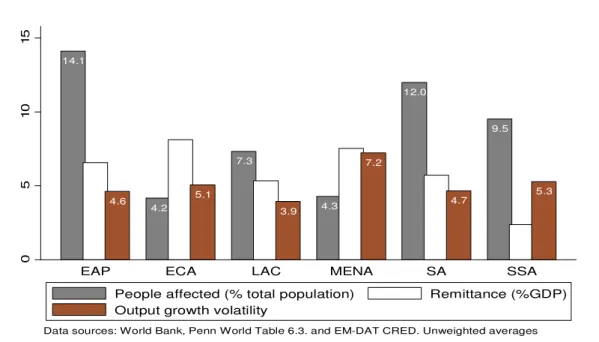
Figure 1 shows the distribution of unweighted regional averages of natural disasters (percentage of people affected), remittance ratio and the output growth volatility. It appears that the three regions mostly affected by natural disasters are East Asia and Pacific (EAP), South Asia (SA) and Sub-Saharan Africa (SSA). In terms of remittance inflows, the top three recipients are Europe and Central Asia (ECA), the Middle East and North Africa region (MENA), and EAP. Finally in terms of output growth volatility, MENA, SSA, and ECA regions exhibit the highest levels of volatility over the entire period 1980-2007.
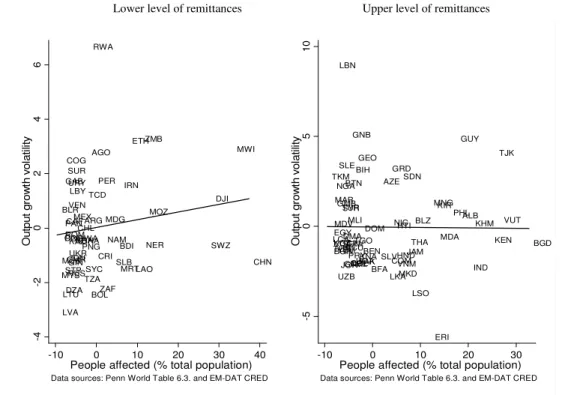
Figure 2 presents preliminary elements suggesting the existence of a non-linear impact of natural disasters on output growth volatility conditional on the level of remittances. The sample is divided into two sub-samples around the median value of remittances (2% over the
9
We instrument for current output growth with two lags of GDP growth and lagged inflation. We include inflation to ensure that our results are not driven by high inflation episodes in which the co-movement between real government spending and output might be due to monetary instability rather than fiscal policy. Inflation squared is included to control for a possible nonlinear relationship between inflation and spending. The model is estimated for each country separately.
10
Figure 1. Distribution of natural disasters, remittances and output growth volatility over regions (1980-2007). 14.1 6.6 4.6 4.2 8.1 5.1 7.3 5.3 3.9 4.3 7.57.2 12.0 5.7 4.7 9.5 2.4 5.3 0 5 1 0 1 5
EAP ECA LAC MENA SA SSA
Data sources: World Bank, Penn World Table 6.3. and EM-DAT CRED. Unweighted averages
People affected (% total population) Remittance (%GDP)
Output growth volatility
Note: EAP: East Asia and Pacific, ECA: Europe and Central Asia, LAC: Latin America and Caribbean, MENA: Middle East and North Africa, SA: South Asia and SSA: Sub-Saharan Africa.
period). Two scatter plots are computed with the magnitude of natural disasters on the x-axis and the output growth volatility on the y-axis.10 Only the left hand panel (low level of remittances) shows a positive relationship between output growth volatility and natural disasters.
This result justifies the econometric estimations aimed at testing the existence of a non-linear impact of disasters.
10
Output growth volatility and natural disasters are residuals derived from pooled regressions using five-year averages of these variables regressed on the same set of control variables (government consumption, trade openness, terms of trade shocks, discretionary fiscal policy). This gives adjusted measures of output growth volatility and natural disasters that are purged from any collinearity with standard output growth volatility determinants.
11
Figure 2: Output growth volatility and natural disasters
AGO ARG BDI BLR BOL BRABWA CAF CHL CHN CIV CMR COG CRI DJI DZA ETH GAB GHA GINIDN IRN KAZ LAO LBY LTU LVA MDG MEX MOZ MRT MUS MWI MYS NAM NER PAN PER PNG POLROM RUS RWA SLB STP SUR SWZ SYC TCD TZA UKR URY VEN ZAF ZMB -4 -2 0 2 4 6 O u tp u t g ro w th v o la ti lit y -10 0 10 20 30 40
People affected (% total population)
Data sources: Penn World Table 6.3. and EM-DAT CRED
ALB AZE BEN BFA BGD BGR BIH BLZ BTN COL COM CPV DMADOM ECU EGY ERI GEO GMB GNB GRD GTM GUY HND HTI IND JAM JOR KEN KGZ KHM KIR KNA LBN LCA LKA LSO MAR MDA MDV MKD MLI MNG NGA NIC NPLPAK PHL PRY SDN SEN SLE SLV SYR TGO THA TJK TKM TUN TUR UGA UZB VCT VNM VUT YEM -5 0 5 1 0 O u tp u t g ro w th v o la ti lit y -10 0 10 20 30
People affected (% total population)
Data sources: Penn World Table 6.3. and EM-DAT CRED
c) Estimation method
If remittances increase when the recipient economy experiences a strong output growth volatility, estimation of the remittance impact by the Ordinary Least Squares estimator (OLS) is biased. Moreover, the OLS estimator is inconsistent since the lagged dependent variable is introduced besides country fixed-effects. The System-GMM estimator must be implemented. The equations in levels and the equations in first differences are combined in a system and estimated with an extended System-GMM estimator which allows for the use of lagged differences and lagged levels of the explanatory variables as instruments (Blundell and Bond, 1998).11 The GMM estimations control for the endogeneity of the remittances and other explanatory variables.12
11
The paper uses the System-GMM estimator developed by Blundell and Bond (1998) for dynamic panel data with the Windmeijer (2005) correction for finite sample bias.
12
In all specifications, period dummies, terms of trade volatility, discretionary fiscal policy, trade openness and natural disasters are taken as strictly exogenous. Government size and the lagged dependent variable are predetermined while remittances and remittances crossed with natural disasters are taken as endogenous.
12
Two specification tests check the validity of the instruments. The first is the standard Sargan/Hansen test of over-identifying restrictions. The second test examines the hypothesis that there is no second-order serial correlation in the first-differenced residuals. The diagnostic tests do not invalidate the quality of the instrumentation with the System-GMM framework.13
d) Preliminary results
Table 1 reports the results of the estimations of equations 1-4. The first column highlights a positive and significant impact of natural disasters on the output growth volatility. The dynamic specification is not rejected given the significant effect of the lagged output growth volatility. It also appears that terms of trade volatility, government consumption and the discretionary fiscal policy determine as expected, positively and significantly output growth volatility. Column 2 reveals a stabilizing effect of remittances on output. In column 3, both remittances and natural disasters are introduced. As expected, it appears that the destabilizing effect of natural disasters increases slightly while the stabilizing effect of remittances is slightly lower.14
13
To deal with the well-known problem of instrument proliferation raised by the system-GMM estimator (Roodman, 2009), the matrix of instruments is collapsed and the number of lags is limited at 3.
14
13
Table 1: Remittances, people affected and output growth volatility.
Period 1980-2007
Unit of observation: Non-overlapping 5-year averages
[1.1] [1.2] [1.3] [1.4]
People affected (%) 0.013* 0.015* 0.065**
1.79 1.91 2.21
People affected * Remittances -0.011**
1.97
Remittances (%GDP) -0.167** -0.144* 0.206
2.05 1.73 1.26
Output growth volatility (t-1) 0.155** 0.156** 0.155** 0.084
2.24 2.09 2.01 1.23
Trade openness 0.006 0.020 0.011** 0.001
0.86 1.01 2.52 0.06
Terms of trade volatility 0.062*** 0.069*** 0.067*** 0.065***
3.94 5.32 5.87 4.03
Government consumption (%GDP) 0.203** 0.054** 0.061*** 0.312***
2.38 1.99 2.63 2.64
Discretionary fiscal policy 0.091** 0.084*** 0.083** 0.086***
2.04 2.59 2.39 2.65 Intercept -2.836* -0.090 0.191 -5.150** 1.66 0.07 0.26 2.14 No observations 402 403 402 402 No countries 113 113 113 113 Ho: θ1=θ2=0, p-value 0.084 θ1+θ2=0 0.054
Remittance threshold for full stabilization 6 %
Countries concerned 30
Percentage of countries 26 %
First order serial correlation p-value 0.001 0.001 0.001 0.005
Second order serial correlation p-value 0.063 0.185 0.192 0.211
Hansen OID test p-value 0.405 0.593 0.393 0.690
No instruments 20 17 17 25
Note: The estimation method is two-step System GMM with Windmeijer (2005) small sample robust correction. Time effects are included in all the regressions. t-statistics are below the coefficients. Volatility measures are the five-year standard deviation of the growth rate of the corresponding variables. Dependent variable: Standard-deviation of output per capita growth rate. *** p<0.01,** p<0.05,* p<0.1
14
In column 4, the interaction of natural disasters and remittances is included. As expected, its sign is negative and significant while the coefficient of natural disasters introduced additively remains positive and significant.15 However, the remittance coefficient is no longer significant when the model allows the interaction term. This can be explained by the fact the coefficient identifies the impact of remittances without natural disasters. In this situation the stabilizing impact appears less effective.
The table shows the remittance level required for a full absorption of disaster shocks. It stands at 6% of GDP on average. This concerns 26% of countries over the entire period.
3. Robustness checks
The robustness of the previous results is tested in three ways. Firstly, more control variables are added to the models. Secondly, alternative measures of disasters are used and thirdly, the threshold level of remittances that fully absorbs the impact of disasters is endogenously determined by a non-linear recursive System-GMM method.
a) Adding more control variables
Several control variables are added to the analysis to reduce the omitted variable bias. The initial level of population is introduced because small countries are those that receive more remittance over GDP and are those with a weak ability of risk sharing. Financial openness is also introduced to ensure that the stabilizing effect of remittances doesn’t reflect the adjustment through financial openness.16 Two indicators of financial openness are tested. The first one is de facto measure (the sum of assets and liabilities over GDP drawn from Lane and Milesi-Ferretti (2007)) and the second one is the index computed by Chinn and Ito (2008).The initial level of development is included because poor countries are often those characterized
15
Table 1 also shows the joint significant test probability associated with the natural disaster coefficients. The null hypothesis that they are not significant is rejected.
16
Indeed, remittance inflows might be determined by financial openness through the reduction of transaction costs.
15
by a high level of macroeconomic volatility, and by the same time are those which receive large inflows of remittances. Finally, foreign aid is added to ensure that the results are not driven by the positive correlation between foreign aid and remittances in poor countries. Table 2 resumes the results obtained. It appears that whatever the control variables introduced, the non-linear effect of natural disasters conditional on the level of remittance inflows always holds. Moreover, the threshold level of remittances required for a full absorption of the disaster shocks stays around 6% in all the specifications. The results also indicate that the control variables introduced do not add something new to the analysis in the extent to which they are generally not statistically significant. This validates the choice of the basic determinants of output growth volatility retained early.
b) Alternative measures of disasters
Two alternative measures of the percentage of people affected are tested. The first measure allows giving more weights to the last observations inside each of the 5-year sub-periods. Giving more weights to last observations ensures that the impact of the disaster is not altered or attenuated by macroeconomic adjustments that follow the disaster events in each of the sub-periods. The results obtained by this exercise would be therefore interpreted as the upper bound estimates of the impact of natural disasters on output growth volatility. The following formula is used to weight the observations of disasters:
16 Table 2: Natural disasters, remittances and output growth volatility: More controls
Period 1980-2007
Unit of observation: Non-overlapping 5-year averages
[2.1] [2.2] [2.3] [2.4] [2.5] [2.6] [2.7]
People affected (%) 0.063* 0.057* 0.063** 0.056** 0.072** 0.060** 0.072**
1.93 1.94 2.15 2.10 1.96 2.17 2.05
People affected * Remittances -0.011* -0.011* -0.011* -0.009* -0.012* -0.010* -0.012*
1.77 1.75 1.93 1.80 1.66 1.79 1.73
Remittances (%GDP) 0.187 0.153 0.209 0.194 0.187 0.145 0.199
0.99 0.85 1.33 1.19 1.01 1.05 1.05
Output growth volatility (t-1) 0.080 0.058 0.103 0.089 0.070 0.055 0.072
1.14 0.91 1.47 1.32 0.92 0.74 0.98
Trade openness 0.012 -0.000 0.001 0.001 -0.001 -0.002 -0.000
1.33 0.02 0.13 0.15 0.06 0.15 0.00
Terms of trade volatility 0.067*** 0.075*** 0.064*** 0.062*** 0.073*** 0.070*** 0.072***
4.36 6.16 4.07 3.75 4.02 4.11 3.82
Government consumption (%GDP) 0.318*** 0.240*** 0.343*** 0.328*** 0.273** 0.246 0.267**
2.59 2.76 2.76 2.88 2.30 1.57 2.29
Discretionary fiscal policy 0.089** 0.098*** 0.088*** 0.081** 0.107*** 0.091*** 0.105***
2.51 3.03 2.72 2.39 2.76 2.96 2.69
Initial level of population (log) 0.353
1.52
Financial development 0.022
1.59
Financial openness (LMF) -0.005 -0.002
1.49 0.46
Financial openness (C&I) -0.115 -0.139
0.48 0.55
Foreign aid (%GNI) -0.033 0.067 -0.033
0.47 0.67 0.52
Initial GDP per capita (log) 0.807 1.456* 0.807
1.23 1.76 1.23 Intercept -11.567* -4.308** -5.381** -5.242** -10.390* -15.479* -10.213 1.91 2.21 2.29 2.25 1.68 1.87 1.64 No observations 402 397 399 399 395 392 392 No countries 113 112 112 113 112 111 112 Ho: θ1=θ2=0, p-value 0.153 0.147 0.096 0.098 0.113 0.082 0.086 θ1+θ2=0 0.052 0.046 0.052 0.047 0.059 0.050 0.060
Remittance threshold for full stabilization 6% 5% 6% 6% 6% 6% 6%
Countries concerned 31 33 31 28 30 28 30
Percentage of countries 27% 29% 28% 25% 28% 25% 27%
17
Second order serial correlation p-value 0.210 0.203 0.217 0.223 0.212 0.174 0.222
Hansen OID test p-value 0.598 0.795 0.696 0.711 0.857 0.746 0.864
No instruments 27 29 27 27 27 31 28
Note: The estimation method is two-step system GMM with Windmeijer (2005) small sample robust correction. Time effects are included in all the regressions. t-statistics are below the coefficients. Volatility measures are the five-year standard deviation of the growth rate of the corresponding variables. Dependent variable: Standard-deviation of output per capita growth rate. *** p<0.01,** p<0.05,* p<0.1
18 1 , , 5 1 , 10 5 100 i t i t i pop np t wD × + × =
∑
= τwhere t is a time trend defined in each sub-period, np the number of people affected at each year and pop the population size.
The second measure that we use for natural disasters is the logarithmic transformation of the original values of disasters. Following Loayza et al., (2009) the logarithmic transformation of the disaster variable helps dealing with the positively skewed distribution of the disaster measure as well as the bias due to extreme values. The following log transformation is applied to the data: + =
∑
= 5 1 ,1 , , log 1 t i t i i pop np lDτTable 3 reports the results obtained. The first three columns present the results obtained with the weighted measure of disasters. The positive and significant impact of natural disasters on output growth volatility still remains and appears much higher than that obtained in Table 1. In column 3.3, the result that remittance inflows dampen the effects of natural disasters on output growth volatility is confirmed again through the negative sign taken by the coefficient of the interactive term.
19
Table 3: Alternative measures of disasters
Period 1980-2007
Unit of observations: Non-overlapping 5-year averages
[3.1] [3.2] [3.3] [3.4] [3.5] [3.6]
People affected (%), weighted 0.023* 0.030* 0.085**
1.68 1.88 2.35
People affected * Remittances -0.028*
1.89
log (1+People affected ratio) 1.728* 1.964* 7.198**
1.68 1.77 2.13
log (1+ People affected)* Remittances -1.169*
1.73
Remittances (%GDP) -0.138* 0.155 -0.145* 0.182
1.67 1.58 1.74 1.52
Output growth volatility (t-1) 0.154** 0.153** 0.197** 0.157** 0.155** 0.121*
2.48 1.98 2.29 2.29 2.01 1.81
Trade openness -0.013 0.011** -0.003 0.005 0.011** -0.002
0.66 2.55 0.27 0.80 2.56 0.22
Terms of trade volatility 0.061*** 0.065*** 0.045*** 0.061*** 0.067*** 0.057***
3.13 5.71 2.79 3.95 5.91 3.25
Government consumption (%GDP) 0.171** 0.059*** 0.276** 0.220*** 0.061*** 0.342**
2.08 2.62 2.14 2.60 2.62 2.42
Discretionary fiscal policy 0.096** 0.082** 0.078** 0.091** 0.083** 0.088***
2.25 2.38 2.28 2.01 2.39 2.88 Intercept -1.150 0.253 -4.211* -3.177* 0.175 -5.690** 0.46 0.35 1.65 1.88 0.24 2.13 No observations 402 402 402 402 402 402 No countries 113 113 113 113 113 113 Ho: θ1=θ2=0, p-value 0.055 0.089 θ1+θ2=0 0.057 6.029
Remittance threshold for full stabilization 3% 6%
Countries concerned 49 28
Percentage of countries 43% 25%
First order serial correlation p-value 0.001 0.001 0.002 0.001 0.001 0.004
Second order serial correlation p-value 0.064 0.198 0.226 0.064 0.191 0.218
Hansen OID test p-value 0.468 0.403 0.739 0.314 0.387 0.773
No instruments 25 17 23 19 17 24
Note: The estimation method is two-step system GMM with Windmeijer (2005) small sample robust correction. Time effects are included in all the regressions. t-statistics are below the coefficients. Volatility measures are the five-year standard deviation of the growth rate of the corresponding variables. Dependent variable: Standard-deviation of output per capita growth rate. *** p<0.01,** p<0.05,* p<0.1
20
The last three columns of Table 3 describe the results obtained with the log transformation of natural disasters. Again, the same story holds. Natural disasters are positively and significantly associated with macroeconomic volatility (columns 3.4 and 3.5). In column 3.6, the coefficient of the interactive term remains negative and statistically significant.
c) Endogenous determination of the remittance threshold
An alternative model to test the non linearity is implemented with rolling estimations for different values taken by the ratio of remittances. A dummy variable dR in interaction with the disaster variable is specified. dR is equal to 1 if the country has a value of remittance ratio greater than R* and 0 otherwise. This methodology for threshold determination in the case of endogenous regressors in a System-GMM framework has been previously implemented by Masten et al. (2008).17 The following equation is specified:
τ τ τ τ τ τ − τ τ =ρσ + ′ β+θ +θ +θ ∗ + +η +ε σi, i, 1 Xi, 8Di, 9Ri, 10Di, dR ui i, (5) with dR =1
[
Ri,τ ≥ R*]
The top 5% and bottom 5% of the observations of the remittance ratio are dropped to ensure a feasible identification of the threshold. Remittance thresholds by increments of 0.5 percent are explored. Each equation corresponding to a different threshold is estimated by the System-GMM method. The optimal threshold is the one which maximizes the over identification Hansen test p-value. Testing nonlinear effect refers simply to the test of the null hypothesis that the coefficient on the interactive variable θ is equal to zero. 10
17
Another approach might consist in an estimation using the Hansen methodology and assuming that the threshold variable is exogenous. However, in our case the remittance ratio is not considered as strictly exogenous.
21
The optimal cutoff which maximizes the Hansen test p-value is a level of remittance ratio equal to 8% GDP. Only 18% of the countries are concerned by this threshold (compared to 26% in the previous results).
The corresponding estimation is shown in Table 4 column [4.1]. All the diagnostic tests associated with the System-GMM estimator validate the specification. The Table reports a significant and negative impact of the interactive term and a positive and significant effect of the additive term of natural disasters. This uncovers the existence of two regimes. The first regime characterized by low amount of remittance (under 8%) and a high level of marginal impact of natural disasters. The second regime is characterized by lower marginal impact of natural disasters.18
If we take two countries in the first regime (remittances less than 8% of GDP), one without experiencing a disaster and the second with the median value of natural disasters (2% of people affected), the predicted output growth volatility gap between the two countries is 0.32% (2*0.16) which represents 11% of the median value of the output growth volatility of the sample (2.90%). In the second regime, the same increase of natural disasters doesn’t affect the output growth volatility given the zero marginal impact estimated. Therefore, remittances induce a stabilizing gain of 11% between the two regimes.
Another question that can be raised following these results concerns the permanent stabilizing impact of remittances above 8% of GDP.
18
Indeed, the sum of the two coefficients associated with the disaster variable remains positive (0.163 - 0.159 = 0.004) and statistically equals to 0 (the corresponding p-value of the restriction stands at 0.88).
22
Table 4: Threshold levels of remittances: Non-linear system-GMM analysis
Period 1980-2007
Unit of observation: Non-overlapping 5-year averages
[4.1] [4.2] People affected (%) 0.163** 0.187* 2.51 1.83 People affected * dR=1[R≥8%] -0.159** 2.40 People affected * dR=1[R≥8%<17%] -0.185* 1.71 People affected * dR=1[R≥17%] 0.322* 1.68 Remittances (%GDP) 0.146 -0.487 1.36 1.43
Output growth volatility (t-1) 0.197** 0.085
2.12 0.92
Trade openness -0.010 -0.000
0.76 0.01
Terms of trade volatility 0.053*** 0.047***
3.97 2.89
Government consumption (%GDP) 0.348* 0.170
1.81 0.85
Discretionary fiscal policy 0.103*** 0.110***
3.63 3.77 Intercept -6.995* -1.613 1.77 0.41 No observations 402 402 No countries 113 113 Ho: θ1=θ2=0, p-value 0.042 0.100
Countries concerned for R≥8% 20
Countries concerned for R≥17% 6
First order serial correlation p-value 0.026 0.020
Second order serial correlation p-value 0.145 0.119
Hansen OID test p-value 0.933 0.639
No instruments 24 23
Note: The estimation method is two-step system GMM with Windmeijer (2005) small sample robust correction. Time effects are included in all the regressions. t-statistics are below the coefficients. Volatility measures are the five-year standard deviation of the growth rate of the corresponding variables.
Dependent variable: Standard-deviation of output per capita growth rate. *** p<0.01,** p<0.05,*
23
Indeed, a recent strand of the literature highlights that remittance can fuel macroeconomic instability for high levels of the ratio (Chami et al., 2009; Combes and Ebeke, 2010). The well-known ‘transfer problem’ is straightened when natural disaster shocks strongly destroy the productive capacity and at the same time, large remittance inflows increase domestic demand and then inflation and real exchange rate.
Knowing the previous threshold of remittances at 8%, the same estimation method is implemented to identify a second structural break above 8%. The following equation is estimated: τ τ τ τ τ τ τ − τ τ =ρσ + ′ β+θ +θ +θ ∗ +θ ∗ + +η +ε σ, , 1 , 11 , 12 , 13 , 14 , R i i, U i R L i i i i i i X D R D d D d u (6) with dLR =1
[
8%≤Ri,τ<R*]
and dUR =1[
Ri,τ ≥R*]
Results are reported in column [4.2] in Table 4. θ11 identifies the marginal impact of natural
disasters for remittance ratio below 8%. The estimated value stands at 0.187. θ11 +θ13 measures the marginal impact of natural disasters when remittances are comprised between 8% and the new optimal threshold estimated at 17%. The value obtained of the impact is 0.187-0.185 = 0.02 and is not statistically different from zero. This result suggests that remittances are fully stabilizing for 14 countries inside this interval. But when the flows
exceed 17%, the marginal destabilizing impact of disasters is enhanced
(θ11 +θ14 =0.187+0.322=0.509). This concerns only 6 countries in the sample.
4. Concluding remarks
This paper shows the macroeconomic stabilizing effect of remittances in countries affected by natural disasters, in the majority of cases. However, large remittance inflows contribute to increase the output volatility induced by natural disasters, but for few numbers of countries (6 over 113).
24
The first policy implication is that emergency measures undertaken in the aftermath of natural disasters should restore the financial networks through which remittances transit when these networks have been disrupted. The second implication is that policymakers should be aware that very large remittance inflows could be a major macroeconomic problem which requires some adjustment policies even in the aftermath of natural disasters. For the medium term, policies aimed at promoting the investment of remittances into productive uses that are more resilient to shocks must be encouraged.
25
Bekaert, G., Harvey, C. and Lundblad, C. (2006) Growth volatility and financial liberalization, Journal of International Money and Finance, 25, 370-403.
Blundell, R. and Bond, S. (1998) Initial conditions and moment restrictions in dynamic panel data models, Journal of econometrics, 87, 115-143.
Bugamelli, M. and Paternò, F. (2009) Output growth volatility and remittances, Economica. Carter, M., Little, P., Mogues, T. and Negatu, W. (2007) Poverty traps and natural disasters in
Ethiopia and Honduras, World Development, 35, 835-856.
Cavallo, E. and Noy, I. (2009) The economics of natural disasters: a survey, Inter-American Development Bank Working Paper, 124.
Chami, R., Gapen, M., Barajas, A., Montiel, P., Cosimano, T. and Fullenkamp, C. (2008) Macroeconomic Consequences of Remittances, IMF Occasional Paper 259, pp. 1-92. Chami, R., Hakura, D. and Montiel, P. (2009) Remittances: An automatic output stabilizer?,
IMF Working Paper No. 09/91.
Chinn, M. and Ito, H. (2008) A new measure of financial openness, Journal of Comparative Policy Analysis: Research and Practice, 10, 309-322.
Combes, J-L. and Ebeke, C. (2010). Remittances and household consumption instability in developing countries, World Development, forthcoming.
Cuaresma, J. (2010) Natural disasters and human capital accumulation, The World Bank Economic Review, 24, 280-302.
David, A. (2010) How do international financial flows to developing countries respond to natural disasters?, IMF Working Papers 10/166, International Monetary Fund.
Di Giovanni, J., and Levchenko, A. (2009). Trade openness and volatility, The Review of Economics and Statistics. 91, 558-585.
Fatas, A. and Mihov, I. (2003) The Case for Restricting Fiscal Policy Discretion, Quarterly Journal of Economics, 118, 1419-1447.
26
IPCC (2007) in Climate Change 2007: Impacts, Adaptation and Vulnerability. Contribution of Working Group II to the Fourth Assessment Report of the Intergovernmental Panel on Climate Change, eds Parry ML , Canziani OF , Palutikof JP , van der Linden PJ , Hanson CE (Cambridge Univ Press, Cambridge, UK) Available at www.ipcc.ch . Kahn, M. E. (2005) The death toll from natural disasters: The role of income, geography, and
institutions, The Review of Economics and Statistics, 87, 271-284.
Kunreuther, H. and Pauly, M. (2009) Insuring against catastrophes, FX Diebold NJ.
Lane, P. and Milesi-Ferretti, G. (2007) The external wealth of nations mark II: Revised and extended estimates of foreign assets and liabilities, 1970-2004, Journal of International Economics, 73, 223-250.
Loayza, N., Olaberria, E., Rigolini, J. and Christiaensen, L. (2009) Natural disasters and growth - going beyond the averages, Policy Research Working Paper Series 4980, The World Bank.
Masten, A. B., Coricelli, F. and Masten, I. (2008) Non-linear growth effects of financial development: Does financial integration matter?, Journal of International Money and Finance, 27, 295-313.
Mohapatra, S., Joseph, G. and Ratha, D. (2009) Remittances and natural disasters : ex-post response and contribution to ex-ante preparedness, Policy Research Working Paper Series 4972, The World Bank.
Naude, W. (2010). The Determinants of migration from Sub-Saharan African countries, Journal of African Economies, 19, 330-356.
Noy, I. (2009) The macroeconomic consequences of disasters, Journal of Development Economics, 88, 221-231.
Ramcharan, R. (2007) Does the exchange rate regime matter for real shocks? Evidence from windstorms and earthquakes, Journal of International Economics, 73, 31-47.
27
Ramey, G. and Ramey, V. (1995) Cross-country evidence on the link between volatility and growth, The American Economic Review, pp. 1138-1151.
Raschky, P. (2008) Institutions and the losses from natural disasters, Natural Hazards and Earth System Sciences, 8, 627-634.
Raschky, P. and Weck-Hannemann, H. (2007) Charity hazard A real hazard to natural disaster insurance?, Environmental Hazards, 7, 321-329.
Roodman, D. (2009) A note on the theme of too many instruments, Oxford Bulletin of Economics and Statistics, 71, 135-158.
Windmeijer, F. (2005) A finite sample correction for the variance of linear efficient two-step GMM estimators, Journal of econometrics, 126, 25-51.
Yang, B. (2008a) Does democracy lower growth volatility? A dynamic panel analysis, Journal of Macroeconomics, 30, 562-574.
Yang, D. (2008b) Coping with disaster: The impact of hurricanes on international financial flows, 1970-2002, Advances in Economic Analysis & Policy, 8, 1903-1903.
28
APPENDIX: Descriptive statistics and list of countries in the sample
Table A1 : Descriptive statistics
Variable Obs Mean Std. Dev. Min Max
GDP per capita growth volatility 765 4.99 4.87 0.15 41.44
People affected (% initial population) 698 8.76 18.12 0 159.14
log (1+ people affected/initial population) 698 0.07 0.14 0 0.95 Weighted measure of people affected (%) 698 3.62 9.53 0 110.71
Remittance-to-initial GDP ratio (%) 430 5.23 8.26 0 89.30
Trade openness 780 79.54 41.69 1.75 266.42
Terms of trade growth volatility 691 11.58 13.62 0 176.79
Government consumption-to-GDP ratio (%) 780 22.31 12.17 3.38 72.30
Discretionary fiscal policy 760 11.01 13.31 0.03 155.92
Aid-to-GNI ratio (%) 607 11.07 14.07 -0.20 86.72
log (initial real GDP per capita) 643 8.08 0.88 5.08 10.15
Assets and Liabilities-to-GDP ratio (%) 708 142.91 147.57 13.09 1908.76
Chinn-Ito index 714 1.64 1.30 0.17 4.50
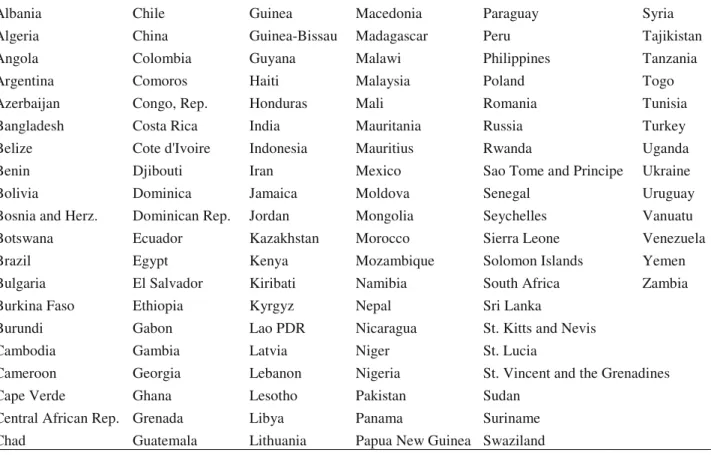
Table A2 : List of countries in the sample (113)
Albania Chile Guinea Macedonia Paraguay Syria
Algeria China Guinea-Bissau Madagascar Peru Tajikistan
Angola Colombia Guyana Malawi Philippines Tanzania
Argentina Comoros Haiti Malaysia Poland Togo
Azerbaijan Congo, Rep. Honduras Mali Romania Tunisia
Bangladesh Costa Rica India Mauritania Russia Turkey
Belize Cote d'Ivoire Indonesia Mauritius Rwanda Uganda
Benin Djibouti Iran Mexico Sao Tome and Principe Ukraine
Bolivia Dominica Jamaica Moldova Senegal Uruguay
Bosnia and Herz. Dominican Rep. Jordan Mongolia Seychelles Vanuatu
Botswana Ecuador Kazakhstan Morocco Sierra Leone Venezuela
Brazil Egypt Kenya Mozambique Solomon Islands Yemen
Bulgaria El Salvador Kiribati Namibia South Africa Zambia
Burkina Faso Ethiopia Kyrgyz Nepal Sri Lanka
Burundi Gabon Lao PDR Nicaragua St. Kitts and Nevis
Cambodia Gambia Latvia Niger St. Lucia
Cameroon Georgia Lebanon Nigeria St. Vincent and the Grenadines
Cape Verde Ghana Lesotho Pakistan Sudan
Central African Rep. Grenada Libya Panama Suriname