Publisher’s version / Version de l'éditeur:
Technical Note (National Research Council of Canada. Division of Building Research), 1970-04-01
READ THESE TERMS AND CONDITIONS CAREFULLY BEFORE USING THIS WEBSITE.
https://nrc-publications.canada.ca/eng/copyright
Vous avez des questions? Nous pouvons vous aider. Pour communiquer directement avec un auteur, consultez la
première page de la revue dans laquelle son article a été publié afin de trouver ses coordonnées. Si vous n’arrivez pas à les repérer, communiquez avec nous à PublicationsArchive-ArchivesPublications@nrc-cnrc.gc.ca.
Questions? Contact the NRC Publications Archive team at
PublicationsArchive-ArchivesPublications@nrc-cnrc.gc.ca. If you wish to email the authors directly, please see the first page of the publication for their contact information.
NRC Publications Archive
Archives des publications du CNRC
For the publisher’s version, please access the DOI link below./ Pour consulter la version de l’éditeur, utilisez le lien DOI ci-dessous.
https://doi.org/10.4224/20358657
Access and use of this website and the material on it are subject to the Terms and Conditions set forth at
Strength of St. Lawrence River Ice
Krausz, A. S.; Gold, L. W.
https://publications-cnrc.canada.ca/fra/droits
L’accès à ce site Web et l’utilisation de son contenu sont assujettis aux conditions présentées dans le site LISEZ CES CONDITIONS ATTENTIVEMENT AVANT D’UTILISER CE SITE WEB.
NRC Publications Record / Notice d'Archives des publications de CNRC: https://nrc-publications.canada.ca/eng/view/object/?id=387395cc-5d41-4e32-b18a-568555276b3d https://publications-cnrc.canada.ca/fra/voir/objet/?id=387395cc-5d41-4e32-b18a-568555276b3d
DIVISION OF BUILDING RESEARCH
NATIONAL RESEARCH COUNCIL OF CANADA
,.
PREPARED BY
PREPARED FOR
TEClHIN ][CAJL
===
A. S. Krausz and CHECKED BY
L. W. Gold Limited Distribution
NOTJE
APPROyED ByNo.
548 C.B.C. April 1970SUBJECT STRENGTH OF ST • LAWRENCE RIVER ICE
A series of icebreaker trials on the St. Lawrence River was initiated in the winter of 1968-69 by the Ship Channel Division of the Federal Department of Transport. Prior to these trials, the., Geotechnical Section of the Division of Building Research was con-sulted concerning the observations that should be made on the char-acteristics of the ice cover and the properties of the ice. It was decided that the Section would undertake observations on the strength properties of the ice, required for evaluating the performance of the
icebreakers. The ice for these measurements was obtained by the
Department of Transport from the sites where the trials were con-ducted. It was transported to the laboratory cold room of the Section in insulated boxes. The sites were located at Repentigny, on the St. Lawrence River between Lanoraie and Cap St-Michel, at Lac St-Pierre, and in the harbour of Montreal.
experセental PROCEDURE
Identification of the Specimens
Ice covers are not usually composed of just one type of ice. The type that forms depends on the conditions at the time of formation, and can change either abruptly or gradually. As the strength depends on the ice type, it was necessary to identify the ice before preparing specimens for testing.
2
-Thin sections were cut parallel and perpendicular to the original surface of the ice cover. The sections cut perpendicular to the surface extended through the full thickness of the cover.
Each section was 4 in. wide. They were viewed with polarized light
to determine the location of the layers in the cover, the type of ice associated with each layer, and the grain size. The ice was classified according to the classification developed by the Ice Laboratory at
Laval University (1). A brief description of the types of ice observed in this study is given in Table I. Measurements were also made of the density of each well-defined layer.
Specimen Preparation
The specimens used in the tests were rectangular, 2 x 4 x 10 in. for nominal rates of strain less than about 5 x 10⁻³ min-1 , and
1. 5 x 3 x 7. 5 in. for nominal rate s of strain greater than this value. The size of the specimens had to be changed to keep the loads within
the capacity of the testing machine. The specimens were prepared
with a milling machine designed specifically for ice.
The columnar-grained types Sl and S2 ice were always cut so that the load was applied perpendicular to the long direction of the grains. Each specimen was cut so that its 4- x 10-in. or 3- x 7. 5-in. face was parallel to the original ice surface.
Testing Method
The stress-strain behaviour of the various ice types provided was observed under conditions of approximately constant rate of strain, applied by a Wykeham Farrance 10,000 -lb capacity soil testing
machine. This machine provided a maximum rate of crosshead
movement of 0.3 in./min. The lowest rate used was 2.5 x 10⁻⁴ in./min.
These rates corresponded to nominal strain rates of 5.8 x 10⁻² min-1 to 2.1 x 10⁻⁶min-1 • All tests were conducted at -9.5
±
0.5°C.The strain was determined by measuring the relative displace-ments between the upper and lower loading plates using four linear differential transformers mounted on each side and on the face of the
spel:imen. The load was measured with a load cell that had been
calibrated previously with a 10, OOO-ib capacity Tinius Olsen proving ring. A linear differential transformer was used to determine the deflection of the load cell. Both the load and the strain were recorded with a Hewlett -Packard 201 OH data logging system, and monitored with a two-pen 7100 B strip chart recorder.
3
-experセental RESULTS
Specimen Classification and Density
Typical thin sections of ice from the three locations are pre sented in Figures 1 to 4. The layers are identified and the associated ice type and density presented in the columns on the right-hand side. These photographs show the great variation that can occur in the ice cover of
a river such as the St. Lawrence. The ice cover in Montreal Harbour
appears to have begun with the accumulation of frazil or snow slush. The initial build-up was of agglomerate type R1 ice, which subsequently developed into columnar-grained type S2. A layer of frozen frazil, type S4, formed at the bottom, and snow ice, type T 1, developed at the upper surface.
Histories of similar complexity occurred at Repentigny and the
two Lac St-Pierre sites. The thin sections from Lac St-Pierre showed
that the ice cover must have initiated under relatively calm conditions at the N -site, resulting in type S1 ice. At both the Lac St-Pierre sites and the Repentigny site there was evidence of surface flooding and subsequent freezing.
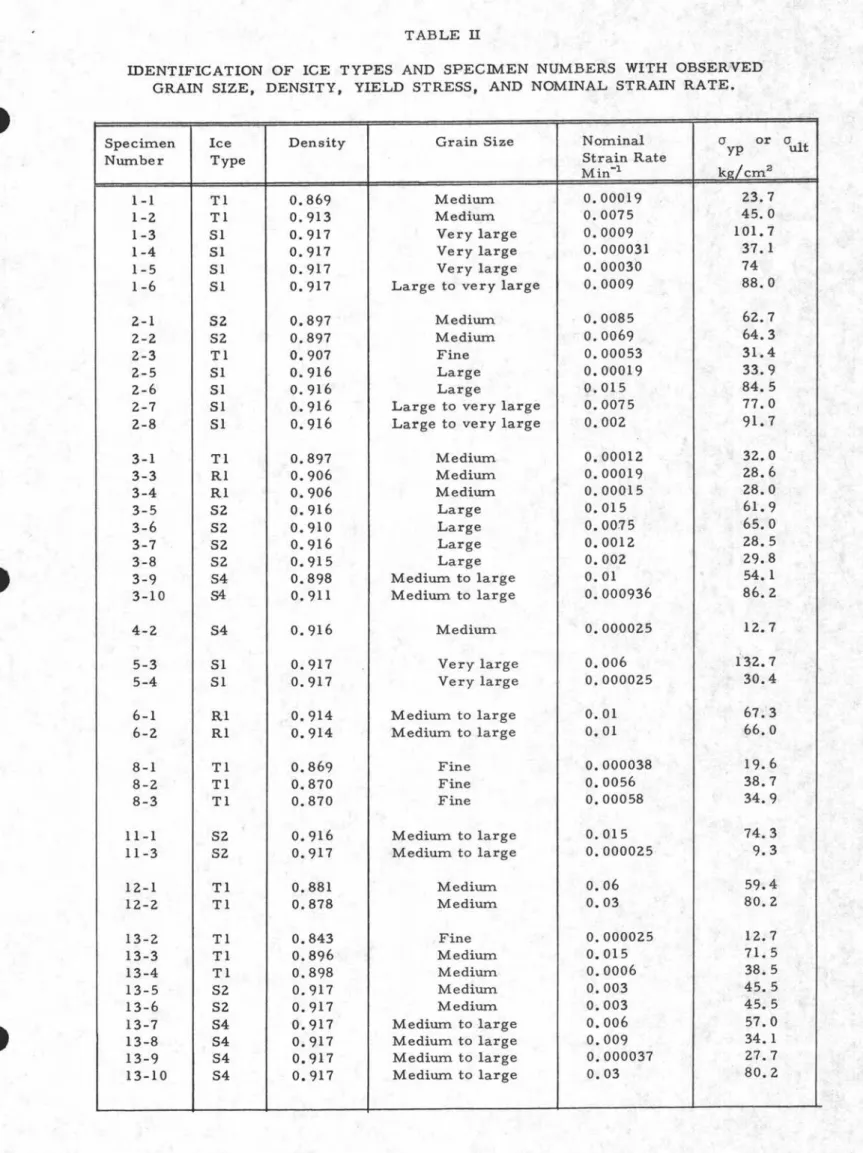
Specimens for testing were cut from the layers of types S1, S2,
S4, T1 and R1 ice. Only two tests were carried out on type Rl because
of its scarcity. The type of ice, grain size and density are given in Table II for each specimen. Given also is the nominal strain for each test.
Compression Tests
It was found that the strain rate during a test could vary by as much as a factor of two. Investigations showed that this variation was caused partly by the softness of the testing machine, and partly by an inherent sensitivity of the motor drive to the external conditions. The large variation in the actual strain rate was carefully considered in the evaluation of the experimental results, and was found to be acceptable for the purpose of the present tests. The considerations leading to this conclusion will be elaborated upon in the Discussion (p. 5). When present-ing the re suIts, the strain rate was taken to be equal to that at failure for brittle behaviour, and to the constant value attained after yield for ductile behaviour.
4
-Typical stress strain curves for types 51, 52, 54 and T 1 ice are shown in Figures 5,
6
and 7 for nominal strain rates of 2 x 10⁻⁶ ,1 X 10-3 , and 1 x 10⁻³ m.in-1 , respectively. The strain rate dependence
of the stress-strain behaviour of the four types is shown in Figures 8, 9, 10 and 11. The behaviour of type Rl ice was sim.i1ar to that of type Tl ice under the sam.e test conditions.
It can be seen that a m.axim.um. occurs in the stres s (upper yield stress, Ouy) for the exam.ples that have been presented. The upper yield stress increases with increase in the rate of strain. A ductile-to-brittle transition in behaviour was observed at strain
rates of about 10-3 m.in-1. For strain rates just below the transition,
specim.ens fractured after yield at strains of less than 0.2 per cent (see Figure 7, curve 51). For strain rates above the transition, the specim.ens fractured before the upper yield stress was attained.
The strain rate dependence of the upper yield stress is of great im.portance in calculations of the forces that ice covers can exert. In the present study, it was observed that the strain rate dependence of the upper yield stress for unconfined com.pression could be expressed by:
n
o = 0
HセI
= 203€ 0.25 kg/cm.2 (1)uy 0
e:
oThis is shown in Figure 12 where the logarithm. of the upper yield stress is plotted against the logarithm. of the strain rate. The upper yield stress or ultim.ate strength m.easured for each specim.en is listed in Table II.
When the strain rate exceeded about 10-6 m.in-1 , crack
form.ation was a characteristic feature of the deform.ation. The first cracks were usually observed at a load of about O. 50uy• Cracking activity was usually uniform. prior to the upper yield and increased in severity after this point was passed. At strain rates greater than about 5 x 10⁻⁶ m.in-1
, the cracking activity was sufficiently
severe to cause the resistance of the specim.en to deform.ation to de-crease continuously.
The specim.ens deform.ed sufficiently uniform.ly up to the yield point and beyond, that the stress distribution at yield could be
con-sidered uniform. within the usuallim.itations of a com.pression test. In the later stage of low strain rate tests, extensive barrelling
sometim.es occurred followed by buckling. Despite the very severe cracking that was associated with this condition, the specim.ens did not break apart. A typical exam.ple of a specim.en deform.ed to this
5
-extent is shown in Figure 13. At high strain rates the specimen fractured in a brittle manner before extensive deformation or change of shape could occur.
DISCUSSION
It should be noted that the strain rate increased to the nominal value at yield or fracture, and exceeded this value for a brief period after yield (i. e., during the rapid drop in stress after yield). It can be seen in Figure 12 that a change in strain rate by a factor of 2.4 changes the upper yield stress by less than 25 per cent. The structural changes developed prior to yield would be different from those that would occur if the strain rates were truly constant. The stres s that was observed is probably less than would have been attained for the constant strain rate condition. On the other hand, it must be greater than would have been attained if the constant strain rate was lower by a factor of 1/2.4. It is considered, therefore, that the observed yield stresses and ultimate strengths are within 25 per cent of the constant strain rate values. It should be noted that the scatter in the measured upper yield stresses is greater than this amount.
The observations shown in Figure 12 indicate that the difference in the yield or failure stress of natural granular type Tl ice, frazil type S4, and columnar-grained type S2, is less than the scatter in the results for one type of ice subject to given conditions of loading. This result is significant for engineering calculations. As can be seen in Figures 1 to 4, two or three of these ice types can occur simultaneously in a cover. The determination of the strength of such a layered
structure would be extremely difficult if the strengths of the various types of ice differed significantly from each other. If it can be assumed that an ice cover composed of layers of these types of ice is homogeneous, it would greatly simplify calculations. It is important to note that type Sl ice, oriented so that the load was applied perpendicular to the long direction of the columns, was significantly stronger than the other three types.
It was observed that the ductile -to-brittle transition occurred for columnar-grained types Sl and S2 ice at strain rates of about
10-2min-1 • The rate of crosshead movement of the testing machine was not great enough, unfortunately, to establish the transition rate for the granular, type Tl, ice. It was not possible to extend the observations sufficiently beyond the ductile -to-brittle transition point to establish the general trend in the dependence of the ultimate strength on strain rate. Limited information presented by Jellinek (2) for tensile
6
-tests on fresh water ice, by Peyton (3) for sea ice, and by Russian investigators, indicate that a maximum occurs near the transition point, and the ultimate strength then gradually decreases with increasing rate of strain.
The strain rate dependence of the initial slope of the stre s s-strain curve (i. e., Young's modulus), is shown in Figure 14. No significant difference in the strain rate dependence of the modulus was apparent for the four types of ice. The large scatter in the observations is typical for the mechanical properties of ice. CONCLUSIONS
The study of natural, granular, type T 1 ice, columnar type s SI and S2, and frazil type S4, showed that for strain rates less than about 10-2 min-1, these ice types exhibited a yield behaviour under
constant strain rate conditions. A ductile-to-brittle transition occurred at a strain rate of about 10-2 min-1. In the ductile region, the logarithm
of the upper yield stress was linearly dependent on the logarithm of the strain rate. There appeared to be no significant difference, from an engineering point of view, in the strain rate dependence of the upper yield stress for types Tl, S2 and S4 ice. The ductile-to-brittle transi-tion of granular type T 1 ice occurred at a higher rate of strain than for
columnar-grained ice. Large grained, type SI ice, loaded so that the
stress is perpendicular to the long direction of the columns, had a significantly higher yield stress than granular, frazil, and type S2 ice subject to the same rate of strain.
REFERENCES
(1) Michel, B. and Ramseier, R.
o.
(1969). Classification ofRiver and Lake Ice. Presented to 6th Snow and Ice
Conference, Snow and Ice Subcommittee, Associate
Committee on Geotechnical Research, National Research Council of Canada, 1969.
(2) J ellinek, H. H. G. (1965). The Influence of Imperfections on
the Strength of Ice. Proc. Phys. sッ」NセL 797-814.
(3) Peyton, H. R. (1968). Sea Ice Forces. Proceedings of
Conference on Ice Pressures Against Structures, Tech Memo 92, Associate Committee on Geotechnical
TABLE I
GENETIC CLASSIFICATION OF ICE (Michel and Ramseier, 1969)
Secondary Ice (develops from primary) Sl S2 S4 Tertiary Ice T1 R1 Grain Size Small: Mediwn: Large:
Co1wnnar-grained; C axis vertical; crystal size increases with depth, and is usually large to extra large; grain shape irregular.
Colwnnar-grained; C axes tend to become perpendicular to long direction of columns with growth; crystal size small to large, increasing more rapidly with depth than type Sl.
Congealed frazil slush: grain boundaries are irregular, their shape is equiaxed to tabular, and crystallographic orientation is random.
Snow ice; crystallographic orientation is random; grains are equiaxed; the grain size small to mediwn. Agglomerate ice; grain size can be from fine to extra large, and the shape can vary from equiaxed to
tabular to colwnnar, with the crystal boundaries regular to angular in shape. Crystallographic orientation can be from random to preferred.
Grain diameter less than 1 rom. Grain diameter between 1 and 5 rom. Grain diameter between 5 and 20 mm. Very Large: Grain diameter greater than 20 rom.
TABLE II
IDENTIFICATION OF ICE TYPES AND SPECIMEN NUMBERS WITH OBSERVED GRAIN SIZE. DENSITY. YIELD STRESS. AND NOMINAL STRAIN RATE.
Specimen Ice Density Grain Size Nominal (J or (Julf
Number Type Strain Rate yp
Min-1 kl!/ cm2 1 -1 Tl 0.869 Medium 0.00019 23.7 1-2 Tl 0.913 Medium 0.0075 45.0 1-3 Sl 0.917 Very large 0.0009 101. 7 1-4 Sl 0.917 Very large 0.000031 37.1 1-5 Sl 0.917 Very large 0.00030 74 1-6 Sl 0.917 Large to very large 0.0009 88.0 2-1 S2 0.897 Medium 0.0085 62.7 2-2 S2 0.897 Medium 0.0069 64.3 2-3 Tl 0.907 Fine 0.00053 31.4 2-5 Sl 0.916 Large 0.00019 33.9 2-6 Sl 0.916 Large 0.015 84.5 2-7 Sl 0.916 Large to very large 0.0075 77.0 2-8 Sl 0.916 Large to very large 0.002 91. 7 3-1 Tl 0.897 Medium 0.00012 32.0 3-3 Rl 0.906 Medium 0.00019 28.6 3-4 Rl 0.906 Medium 0.00015 28.0 3-5 S2 0.916 Large 0.015 61.9 3-6 S2 0.910 Large 0.0075 65.0 3-7 S2 0.916 Large 0.0012 28.5 3-8 S2 0.915 Large 0.002 29.8 3-9 S4 0.898 Medium to large 0.01 54.1 3-10 S4 0.911 Medium to large 0.000936 86.2 4-2 S4 0.916 Medium 0.000025 12.7 5-3 Sl 0.917 Very large 0.006 i'32.7 5-4 Sl 0.917 Very large 0.000025 30.4 6-1 Rl 0.914 Medium to large 0.01 67.3 6-2 Rl 0.914 Medium to large 0.01 66.0 8-1 T1 0.869 Fine 0.000038 19.6 8-2 Tl 0.870 Fine 0.0056 38.7 8-3 T1 0.870 Fine 0.00058 34.9 11-1 S2 0.916 Medium to large 0.015 74.3 11-3 S2 0.917 Medium to large 0.000025 9.3 12-1 Tl 0.881 Medium 0.06 59.4 12-2 T1 0.878 Medium 0.03 80.2 13-2 T1 0.843 Fine 0.000025 12.7 13-3 T1 0.896 Medium 0.015 71. 5 13-4 Tl 0.898 Medium 0.0006 38.5 13-5 S2 0.917 Medium 0.003 45.5 13-6 S2 0.917 Medium 0.003 45.5 13-7 S4 0.917 Medium to large 0.006 57.0 13-8 S4 0.917 Medium to large 0.009 34.1 13-9 S4 0.917 Medium to large 0.000037 27.7 13-10 S4 0.917 Medium to large 0.03 80.2
MMMMMMMMMMセ セMMセMMMMMMMMMMM
Figure 1
Thin Section of Ice from the St. Lawrence River
Location of Sample: Ice type
and Longueuil Montreal Harbour grain size
Average density glcc Location of specimens 0.916 3-8 3-3 3-4 3-1 3-9 3-10 0.897 0.906 0.898 0.911 0.916 3-5 0.910 3-6 T1 med. Rl med. 3-7 $2 large S4 med. to large
o
10 20Figure 2
Thin Section of Ice from the St. Lawrence River
o
10 20 Location of Sample: RepentIgnyI
I
I
I,.
I
Ice type and grain size 52 larp;e to very Jarg Rl Tl med. Tl fine T1 med. 52 med. 54 fine 54 med. to Jar p,e Average density glee 0.843 0.896 0.898 0.917 0.917 LocatIon of specimens 13-2 13-3 13-4 13-5 13-6 13-7 13-11 13-9 13-10Figure 3
Thin Section of ice from the St. Lawrence River
o
10 20 Location of Sample: Lac St. Pierre g-N Ice type and grain size 52 med. T1 fine to med. 51 large to very large Averap;e density glcc O.!H 7 Location of specimens 5-3 5-4Figure 4
·Th in Section of ice f rOi,) the St. Lav.Jrence River
Locution of SiH.)ple: Ice tyf'e Average Location
anrl density of
lac St. Pierre 2-S grain size glce sreeirr,ens
[) 52 med. to large T1 merl. rn ュセイャN to large 0.914 6-1 6-2 10 20 52 large
110
r - - - r - - - r - - - . . , . . . - - - .
100
90
80
N70
セ u-
セ セ60
b
V')50
V') LJ.Ja::::
l -V')40
30
20
Tl
10
SI
S4
S2
0
0.00
0.01
0.02
0.03
STRAIN
E
FIGURE
5
STRAIN DEPENDENCE OF THE STRESS FOR ICE FROM ST LAWRENCE
110
....---...,...---r---...,.---....
100
90
80
N70
:E
u-
セ セ60
b V')50
V') LLJ a::: l -V')40
30
- - - 5 4
20
Tl
10
52
0.03
0.02
STRAIN
C
0.01
0---'---.--10----0.00
FIGURE
6
STRAIN DEPENDENCE OF THE STRESS FOR ICE FROM ST LAWRENCE
RIVER; STRAIN RATE
=lxl0- 3 MIN. -1, T
=-9.5°C
130 __
-120
110
100
90
N80
:2: u-
<.:) セ70
b V)60
V) w 0::: l -V)50
4030
Tl
S2
20
10
0.03
0.02
STRAIN
t.
0.01
olNNMMMMMMNNNNjNNNMMMMMMMMiMMMMMMセMMMMMG0.00
FIGURE
7
STRAIN DEPENDENCE OF THE STRESS FOR ICE FROM ST LAWRENCE
RIVER;STRAIN RATE
=lxl0- 2 MIN. -1, T
=-9.5°C
1 3 0
-120
110
100
90
£=0.01
min-1
N80
セ u-
c.::> セ70
b Vl60
Vl 1.LJ セ I -Vl50
40
30
£= 0.001
min-1
20
10
•
- 1
£
= 0.00002
min0.03
0.02
STRAIN
c
0.01
O---__-'-
---J ....L-_ _セ0.00
FI
GURE8
DEPENDENCE OF STRESS ON STRAIN AND STRAIN RATE FOR
TYPES 1 ICE; T
= -9.
50
C
IHS28·-?1 1 0 , . . - - - , - - - . . , . - - - .
100
90
80
N70
:;E u-
<.=> セ60
b
Vl50
Vl I..LJ 0:: I--Vl40
•min-
1
E
=
0.01
30
20
10
i
=
0.00002
min-
1
E=
0.001
min-1
0.03
0.02
STRAIN
E
0.01
Ot...-
--L.. ---I ...L..-_ _- - - - '0.00
FIGURE
9
DEPENDENCE OF STRESS ON STRAIN AND STRAIN RATE FOR
110
セ--.-
---r ""100
90
80
N70
:z:
u-
(,:) セ60
b
V')50
V') LLJ.
-1
0:::E
=0.01 min
l -V')40
30
20
10
£=
0.001 min- 1
£
=0.00002 minI
0.03
0.02
STRAIN
£
0.01
oャNNMMMMMMセMMMMMNNNNNNFMMMMMMNNNFMMMMMMG
0.00
FIGURE
10
DEPENDENCE OF STRESS ON STRAIN AND STRAIN RATE FOR
11
oイMMMMMMMセMMMMM⦅⦅⦅イBMMMMM⦅⦅⦅NMMMNNNL
100
90
80
E
= 0.00002 min- 1
£=0.00Imin- 1
20
30
10
N70
:E u-
c..=> セ60
•min- 1
E
= 0.01
b
V'l50
V'l LLJa:::
I -V'l40
0.03
0.02
STRAIN
E
0.01
O L - - - -_ _
...L. L...- ....-_ _0.00
FIGURE
11
DEPENDENCE OF STRESS ON STRAIN AND STRAIN RATE FOR
0.01 0.001 LOG
t
0.0001 I ce Type 0 S2•
Tl 11 S4•
SI 0 Rl•
•
FIGURE 12THE STRAIN RATE DEPENDENCE OF THE YIELD AND FAILURE STRENGTH OF TY PES S1, S2,S4, RIA ND Tl ICE,
cr
INK GICM2 tiN MIN - 1o 1'--_ ___'__..J._...L...L...L...L...Ju...J._ _NNNNNiNNM⦅⦅⦅⦅jl⦅⦅NlNMMャMMMGMNNlNNjNNセ _ _..J.___l.___L___'_....L..J'_J..J...L..._ ____JL__....L..___'_...I...J....l...J....J..J 0.00001 100 N :E u
--<.::> ::.::: 0 . >. b <.::> 0 10 セl3(a) - Specimen prior to application of load.
l3(b) - Crack formation in specimen during application of load.
•
e
e
セ
10 9セセ
I ce Type 0 S2•
T16r-
A S4 0•
Sl 5 0 0•
'<:t 4•
A•
I 0 A A-
x 0•
0 0•
\.I,)•
-
0•
A b 3 0 A•
c.:> 0 0 ....JRセ
·A A•
•
O. 1
0.01 0.001•
LOG£
0.0001I'
I 1 1 1 1 1 1 1 1 I 1 1 1 1 1 1 1 1 I 1 1 1 1 1 1 1 ' I 0.00001 I I I , I I I I QQHセD ...tJ-"
FIGURE 14THE STRAIN RATE DEPENDENCE OF YOUNG'S MODULUS FOR TYPES Sl, S2, S4 AND Tl ICE, O"IN KG/CM2 t IN MIN-1