HAL Id: hal-01808744
https://hal.archives-ouvertes.fr/hal-01808744
Submitted on 11 Jun 2018
HAL is a multi-disciplinary open access
archive for the deposit and dissemination of
sci-entific research documents, whether they are
pub-lished or not. The documents may come from
teaching and research institutions in France or
abroad, or from public or private research centers.
L’archive ouverte pluridisciplinaire HAL, est
destinée au dépôt et à la diffusion de documents
scientifiques de niveau recherche, publiés ou non,
émanant des établissements d’enseignement et de
recherche français ou étrangers, des laboratoires
publics ou privés.
Baselines and a datasheet for the Cerema AWP dataset
Ismaïla Seck, Khouloud Dahmane, Pierre Duthon, Gaëlle Loosli
To cite this version:
Ismaïla Seck, Khouloud Dahmane, Pierre Duthon, Gaëlle Loosli. Baselines and a datasheet for the
Cerema AWP dataset. Conférence d’Apprentissage CAp, Jun 2018, Rouen, France. �hal-01808744�
Baselines and a datasheet for the Cerema AWP dataset
Isma¨ıla Seck
2,3, Khouloud Dahmane
1, Pierre Duthon
1, and Ga¨
elle Loosli
21
Cerema, Clermont-Ferrand
2Universit´
e Clermont Auvergne, LIMOS
3
INSA de Rouen, LITIS
Abstract
This paper presents the recently published Cerema AWP (Adverse Weather Pedestrian) dataset for var-ious machine learning tasks and its exports in machine learning friendly format. We explain why this dataset can be interesting (mainly because it is a greatly con-trolled and fully annotated image dataset) and present baseline results for various tasks. Moreover, we decided to follow the very recent suggestions of datasheets for dataset, trying to standardize all the available informa-tion of the dataset, with a transparency objective. Mots-clef : Datasheet for dataset, Cerema AWP, clas-sification, regression, auto-encoder, GAN.
1
Introduction
Deep learning techniques have shown impressive results during the past years, in particular when dealing with image processing. However there remains a lot of open questions, for instance in terms of quality evaluation and method comparisons.
The introduction of new datasets and of new algo-rithms leads to new baselines. That raises some ques-tions about how those baselines are established, about the fairness in the comparison between the newly intro-duced algorithm and the ones previously known.This problem is not new [AZWM09] but it may be increased by the huge amount of publications in the field nowa-days. Let us take the case of Generative Adversar-ial Networks [GPAM+14], there are many variants of
GAN1, often with the claim to outperform previous
versions and so with no objective metric to back that claim.2
1 cf https://github.com/hindupuravinash/the-gan-zoo 2 more detail about baselines and objective evaluation for
GAN threadreaderapp.com/thread/978339478560415744.html
Another aspect linked to new datasets is the need for transparency and good understanding of its con-tent. The recent work-in-progress [GMV+18] discusses
the need for standardization of datasets we use. While the cited paper is only a work-in-progress proposal to a standard datasheet content that will likely change in the coming months/years, we decided to make an attempt of description of the Cerema AWP dataset ac-cording to this proposal.
The Cerema AWP (Adverse Weather Pedestrian) dataset [DEBAD+17][Dut17] was released recently3.
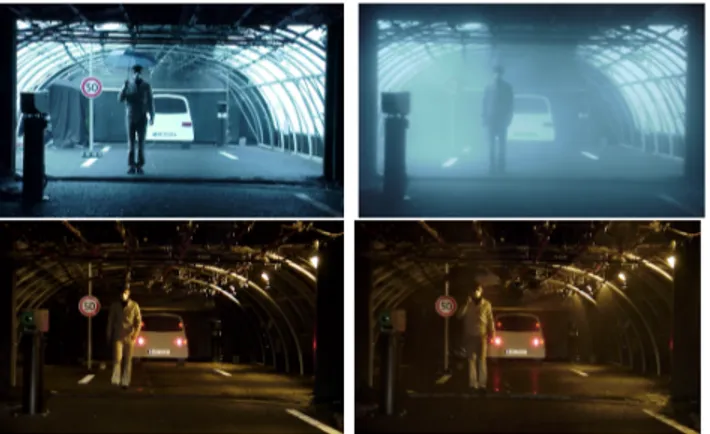
It is a very particular annotated image dataset since all images are obtained from a fully controlled envi-ronment. Each image shows exactly the same scene, as illustrated on figure 1, but under various controlled weather conditions.
Figure 1: Examples of the Cerema AWP dataset. The same pedestrian appears roughly at the same place in different weather and light conditions.
The interest of such a dataset relies on the precise knowledge of its content. Of course it might not be useful for real life machine learning applications, but we
believe that it could help in the evaluation of machine learning methods, such as controlled image generation.
2
Cerema AWP datasheet
The idea of creating datasheets for datasets [GMV+18]
comes from several observations of major failures of machine learning systems due to biases or internal flaws in the dataset that were used to train them. Most of times, the misuse of datasets are unintentional and due to the fact that very few factual information is known about publicly available datasets. Such a document, with standard questions, would have at least two tar-gets : on the one hand, the consumers of the data, who would be informed of how and what for were the data collected, and on the other hand, the providers who would have the opportunity to improve their dataset quality and maybe focus on point that would have been ignored otherwise (such as legal aspects or fairness).
We present the datasheet for Cerema AWP, as it is suggested in [GMV+18] as an attempt to follow their guidelines and hopefully participate to this very inter-esting initiative aiming at bringing more fairness in ma-chine learning. The datasheet is organized exactly as proposed and is placed at the end of the paper on page 7 for readability issues.
To sum-up the content of the dataset, it was origi-nally designed to train more robust pedestrian detec-tors, starting from the observation that most of the ex-isting datasets were containing favorable weather con-ditions. In a special installation (the Cerema Fog and Rain R&D platform ), a tunnel in which rain, fog and night can be artificially created, it was possible to take photos of 5 persons walking back and forth in the tunnel, wearing different clothes and under different weather conditions. Using classical detectors on those images, it was observed that indeed they were failing much more under adversarial weather conditions.
In this paper we are not interested directly on the pedestrian detection but we rather want to exhibit other interests of this particular dataset.
3
Tasks and baseline results
In this section, we present several identified tasks for the Cerema AWP and some baseline results. All presented baselines are convolutional neural networks, which are well adapted to image processing and large datasets. For each proposed model, we tried to produce the best models we could, using only standards layers.In the following, we first present how we pre-processed and split the dataset.
3.1
Pre-processing
The dataset provided on the original website consists of raw images stored in a hierarchy of folders, which gives some of the labels:
• Level 1 : Weather conditions (5 with daylight, la-bels beginning with ’J’), 5 during night (lala-bels be-ginning with ’N’). The 5 are good weather (labels ’JCN’ and ’NCN’), low rain (’JP1’,’NP1’), heavy rain (’JP2’,’NP2’), little fog (’JB1’,’NB1’), heavy fog (’JB2’,’NB2’)).
• Level 2 : Pedestrian (5 different persons) • Level 3 : Clothes (2 different jackets colors) The other labels and information (such as the pedes-trian direction, the bounding box or the exposure time) are provided in a separated csv file. This file also gives a redundant information concerning pedestrian and clothes, in the form of a new label that separates the dataset into 10 classes (combination of pedestrian identification and clothes).
We decided to export all the information (images and labels) in a single format in order to simplify the information management. The proposed script4 also
provides an option for image downsizing. Here is a final format of the hdf5 file for Python:
attribute ’width’ : width of stored images attribute ’height’ : height of stored images
dataset ’train’ : stores 85% of the dataset dataset ’test’ : stores the remaining 15% of the dataset
The split between train and test is done such that both sets have similar proportion of each class (10 classes weather, 10 classes pedestrian, 6 classes direction). On average, the test set contains about 12 example of each of the 600 combinations of classes. The information inside train and test is stored as follows:
weather : list of labels from 0 to 9 (or-der compared to the original dataset : [’JB1’, ’JB2’, ’JCN’, ’JP1’, ’JP2’, ’NB1’, ’NB2’, ’NCN’, ’NP1’, ’NP2’])
pedestrian : list of labels from 0 to 4 clothes : list of labels from 0 to 1 pedestrianClothes : list of labels from 0 to 9
(combination of the two previous ones) direction : list of labels from 0 to 5 exposition : list of reals
4available on github https://github.com/gloosli/
boundingBox : list of size (nbElements, 4), [x,y,width,height] in proportion of height and width (originally this information is given in pix-els, but since we propose to extract images at dif-ferent scales of downsizing, we preferred propor-tions)
images : Numpy matrix (nbElements ×width×height×3)
Unless mentioned otherwise, results are provided on images of size 1/4 of the original size (256x158). For all experiments, the train set is split randomly in order to have results on a 20% validation set.
3.2
Classification tasks
We applied standard convolutional networks, using Keras on Tensorflow, to each of the classification tasks. The summary of the architectures can be found in the annexe, the optimization algorithm is Adam with de-faults parameters, except for the learning rate set at 10−5. We expect the results to be very high on most of the classes: due to the large similarity between im-ages, we can foresee that some sort of over-fitting will do well.
Easy classification tasks We summarize here re-sults for Weather, Pedestrian, Clothes, and Pedestri-anClothes, since each of them can be easily solved with validation performance higher than 99%. From the simplest (the weather, since the relevant informa-tion is mainly contained in the color range) for which 1 epoch is enough, to the least simple (Pedestrian-Clothes) which requires 10 epochs, we observe that there is no real challenge.
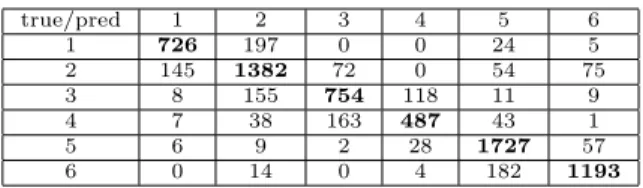
Classification on the Direction labels The direc-tion label indicates how the pedestrian is shown on the image : face, back, left, right (close or far), diagonal from far right to close left. This classification task is less obvious since the algorithm has to focus on details on the pedestrian only. However it is possible that it can infer results from the position in the image because of the regularity of the path. After 10 epochs, the ac-curacy on the validation set is quite stable and stays at around 80%. We observe the confusion matrix (table 1) and see that some distinctions are not easy (like be-tween 3 and 4 or bebe-tween 5 and 6), which make sense since the positions in the image are similar for these couple of classes, but also between 1 and 2, which is more surprising. On the contrary, directions 1 and 2 are almost never mismatched with the other directions. From this we conclude that indeed the position in the
image is used to detect the direction, but not only (5 and 6 are exactly at the same locations but are rather well distinguished overall).
true/pred 1 2 3 4 5 6 1 726 197 0 0 24 5 2 145 1382 72 0 54 75 3 8 155 754 118 11 9 4 7 38 163 487 43 1 5 6 9 2 28 1727 57 6 0 14 0 4 182 1193
Table 1: Confusion matrix for the direction detection
3.3
Multi-label classification
We decided for this experiment to build an architecture that will share the convolutional part but have sepa-rate output for each class, in order to obtain multi-label classification. Labels that are taken here are weather, pedestrian, clothes, direction. For pedestrian and clothes, we decided to add a common layer as shown in the annexe. Based on the individual per-formance and number of required epochs of each clas-sification tasks, the losses are weighted as follows :
• weather : 0.2 • pedestrian : 0.2 • clothes : 0.5 • direction : 1
We also trained the model without weighting losses to compare.
Without weights With weights Acc Weather 100% 100% Acc Ped 100% 100% Acc Clothes 99.3% 99.2% Acc Direction 82.1% 85.0%
Table 2: Results for different loss weights after 10 epochs
From table 2, we observe that easy classes are per-fectly detected in this setting, but also that the Direc-tion detecDirec-tion seems to be improved. We suspect that sharing the feature extraction part with tasks that are directly related to the pedestrian characteristics (such as clothes) helps the model to focus on the interesting part of the image, which is the pedestrian. We also observe that the loss weighting has a positive impact on the Direction detection.
3.4
Regression
The bounding box information comes as a vector of size 4, containing (x,y) of the top left corner and (w,h), the
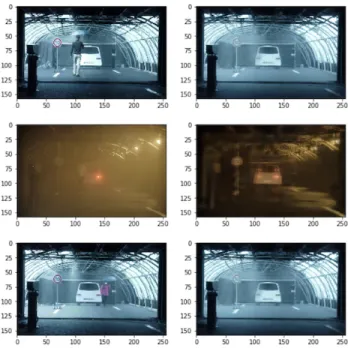
width and height of the box. All values are between 0 and 1 and represent a percentage of image width and height. For this experiment we treat those vectors as a multi-regressor problem. The architecture is the simi-lar to the classification tasks, with an output shape of 4. We achieve a mean square error (MSE) on the vali-dation set of 0.0020 and a mean absolute error (MAE) of 0.0327. From those results it’s hard to conclude on
Figure 2: Examples of good and bad predicted bound-ing boxes. The red box is the true one, the blue box is the predicted one.
the interest of this tasks using only regression : it’s not obvious that the machine actually learns to detect the pedestrian. In order to have a more precise idea, we de-cided to make another experiment in which we train on a selected subsample of the dataset, such that pedes-trian in the validation set will appear at places that were not presented in the train set. To achieve this, we use the direction information and simulate a covari-ate shift problem [QCSSL09]. Indeed, as illustrcovari-ated on figure6, the directions are linked to the positions. We decided to exclude from the training set all images with directions 1 and 2 (labels 0 and 1). For the evaluation, we present only the images with directions 1 and 2, or images with any directions. This experiment confirms that the method can actually detect a pedestrian at an unusual place but with twice the amount of errors.
3.5
Image reconstruction and
genera-tion
3.5.1 Auto-encoders
From now on, we focus on image reconstruction and generation, starting with auto-encoders [HZ94]. The idea of autoencoders is to train a neural network that learns to reproduce its input as output, with a smaller size intermediate layer. The representation inside the
Excluded directions All directions MSE 0.0620 0.0393 MAE 0.0066 0.0031
Table 3: Results of the regression tasks when training with a subpart of the dataset, such that some pedes-trian position do not appear in the training set. The two tests sets are composed by either only images of the remaining positions, or all images. We see from those results that the proposed method actually uses the position in the image to detect the pedestrian
intermediate layer is a compression of the input. Au-toencoders can be staked to obtain successive compres-sions of the input. Here we use autoencoders to evalu-ate how difficult it is for a neural network to generevalu-ate our images. Figure 3 shows the obtained results, based on convolutional layers. We see that it is quite easy to make the autoencoder catch the information on the background and weather conditions. However, we were not able to make it print the pedestrians.
Figure 3: Examples of reconstructed images using auto-encoders. On the left columns are true images, on the right column are the generated images. We observe that no pedestrian is generated, only the re-current background is reconstructed.
3.5.2 GAN
Generative adversarials Networks,GANs, were intro-duced in 2014 [GPAM+14] and since then dragged the interest of many. The idea is to train simultaneously two networks the generator G and the discriminator D. Working for example with an image dataset, the aim of the discriminator D is predict whether or not an image presented to it is from the dataset or from the generator G. This simultaneous training of those net-works can be seen as a two-player minimax game which has a unique solution. At that solution, neither the discriminator nor the generator can improve anymore. Hopefully, by the time the training get that optimal point, images generated can not be told apart by the discriminator, and that stands for humans too. Since the introduction of GANs many versions have been in-troduced but [LKM+17] states that all those variants are at some points equivalent, we use a DCGAN-like [RMC15] which is suitable in our experiments. It is well known that GANs are difficult to train, and this difficulty increase with the variability of the input im-ages, and also their size.
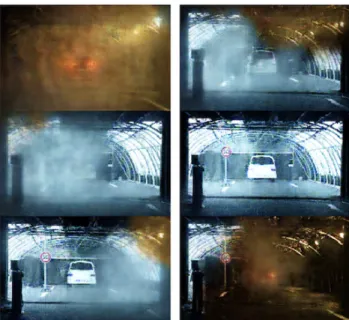
Figure 4: Examples of generated images using a DC-GAN on images of size 256×158. The remarkable point is that the tunnel and car are well generated but the weather condition varies inside each image. As for the auto-encoder case, pedestrian are not easily generated.
3.5.3 Conditional GANs
For conditional GANs [MO14], we use the same archi-tecture as previously but with conditional inputs, and conditioning with the weather. As we can see on fig.4, in the previous generated images, several weathers can be present in a single image, but that behaviour disap-pears when conditioning on the weather. We illustrate that using the CEREMA database which at first sight is a very simple database with a fixed background for each weather. We can also infer that the discrimina-tor relies at first on the background to distinguish real images from generated ones. That can back the idea that the networks learn first the most general patterns before learning the particular ones [AJB+17] . As we
can see in the examples on fig.5, while training our conditional DCGAN, the generator learn first to gener-ate the background for the different weather conditions properly. And only after that, we can see the genera-tor trying to print the pedestrian on the picture. This behavior is seen for all the settings we have tried so far.
Figure 5: Examples of generated images using a con-ditional DCGAN-like architecture on images of size 128 × 128. The weather is uniform on each image but the pedestrian is not well generated or ignored.
4
Conclusion
To conclude this paper, we first summarize our baseline results for the Cerema AWP dataset. It is very likely that these score can be improved with more elaborated
models or having the chance to run experiments on a bunch of GPU to practice a better model selection. However we think that establishing and publishing a fair baseline before applying fancy methods on this new dataset will produce higher quality results in time.
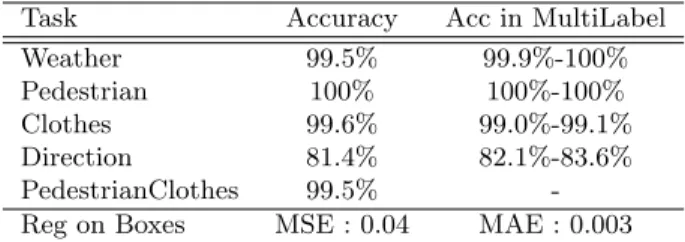
We summarize in table 4 the results on the test set for each supervised task. Those results were obtained once, for our best models selected on validation results.
Task Accuracy Acc in MultiLabel Weather 99.5% 99.9%-100% Pedestrian 100% 100%-100% Clothes 99.6% 99.0%-99.1% Direction 81.4% 82.1%-83.6% PedestrianClothes 99.5% -Reg on Boxes MSE : 0.04 MAE : 0.003
Table 4: Final results of our baseline, on the test set. For results in the multi label setting, the first value in for unweighted costs and the second for the weighted costs.
The purpose of this paper was two fold :
• presenting a dataset that we believe can be use-ful for some systematic exploration of some algo-rithms properties, in an attempt of standardiza-tion,
• and establishing baseline results before any ad-vanced exploitation, in order to reduce the bias in later results presentation.
This work was greatly influenced by current discus-sions inside and outside the community about fairness, results quality and comparability. While we know that publishing datasheets and baselines won’t solve many issues, we believe that is at least a step in the good direction.
Our future work concerning this database is quite evidently to take advantage of its particularity to push generative models towards unexplored behaviors and to work on the quality evaluation of produced images, using a validation dataset, which is mainly impossible with existing standards dataset.
Acknowledgment
This work has been partly supported by the grant ANR-16-CE23-0006 “Deep in France” and by the French National Research Agency within the ”In-vestissement d’avenir” program via the LabEx IMobS3 (ANR-IO-LABX-16-01).
References
[AJB+17] Devansh Arpit, Stanislaw Jastrzebski, Nicolas Bal-las, David Krueger, Emmanuel Bengio, Maxin-der S. Kanwal, Tegan Maharaj, Asja Fischer, Aaron Courville, Yoshua Bengio, and Simon Lacoste-Julien. A Closer Look at Memorization in Deep Networks. arXiv:1706.05394 [cs, stat], June 2017. arXiv: 1706.05394.
[AZWM09] Timothy G Armstrong, Justin Zobel, William Web-ber, and Alistair Moffat. Relative significance is in-sufficient: Baselines matter too. In Proceedings of the SIGIR 2009 Workshop on the Future of IR Evalua-tion, pages 25–26. Citeseer, 2009.
[DEBAD+17] K. Dahmane, N. Essoukri Ben Amara, P. Duthon,
F. Bernardin, M. Colomb, and F. Chausse. The Cerema pedestrian database: A specific database in adverse weather conditions to evaluate computer vision pedestrian detectors. In 2016 7th Interna-tional Conference on Sciences of Electronics, Tech-nologies of Information and Telecommunications, SETIT 2016, pages 472–477, 2017.
[DT05] N. Dalal and B. Triggs. Histograms of oriented gradi-ents for human detection. In 2005 IEEE Computer Society Conference on Computer Vision and Pat-tern Recognition (CVPR’05), volume 1, pages 886– 893 vol. 1, June 2005.
[Dut17] Pierre Duthon. Descripteurs d’images pour les syst`emes de vision routiers en situations atmo-sph´eriques d´egrad´ees et caract´erisation des hy-drom´et´eores. PhD thesis, Universit´e Clermont Au-vergne, Clermont-Ferrand, France, 2017.
[GMV+18] Timnit Gebru, Jamie Morgenstern, Briana Vecchione, Jennifer Wortman Vaughan, Hanna Wallach, Hal Daum´e, and Kate Crawford. Datasheets for Datasets. March 2018.
[GPAM+14] Ian J. Goodfellow, Jean Pouget-Abadie, Mehdi Mirza,
Bing Xu, David Warde-Farley, Sherjil Ozair, Aaron Courville, and Yoshua Bengio. Generative Adversar-ial Networks. arXiv:1406.2661 [cs, stat], June 2014. arXiv: 1406.2661.
[HZ94] Geoffrey E Hinton and Richard S. Zemel. Autoen-coders, Minimum Description Length and Helmholtz Free Energy. pages 3–10. Morgan-Kaufmann, 1994. [LKM+17] Mario Lucic, Karol Kurach, Marcin Michalski,
Syl-vain Gelly, and Olivier Bousquet. Are GANs Created Equal? A Large-Scale Study. arXiv:1711.10337 [cs, stat], November 2017. arXiv: 1711.10337.
[MO14] Mehdi Mirza and Simon Osindero. Conditional Gen-erative Adversarial Nets. arXiv:1411.1784 [cs, stat], November 2014. arXiv: 1411.1784.
[QCSSL09] Joaquin Quionero-Candela, Masashi Sugiyama, An-ton Schwaighofer, and Neil D. Lawrence. Dataset Shift in Machine Learning. The MIT Press, 2009. [RMC15] Alec Radford, Luke Metz, and Soumith
Chin-tala. Unsupervised Representation Learning with Deep Convolutional Generative Adversarial Net-works. arXiv:1511.06434 [cs], November 2015. arXiv: 1511.06434.
[VJ01] P. Viola and M. Jones. Rapid object detection using a boosted cascade of simple features. In Proceedings of the 2001 IEEE Computer Society Conference on Computer Vision and Pattern Recognition. CVPR 2001, volume 1, pages I–511–I–518 vol.1, 2001.
Datasheet for Cerema AWP
Motivation for Dataset Creation
Why was the dataset created? (e.g., was there a spe-cific task in mind? was there a spespe-cific gap that needed to be filled?)
The Cerema AWP dataset was created for the specific need of pedestrian detection under any weather and light condi-tion. The argument was that most of the vision techniques work pretty well when the weather is good under the day light. This dataset aimed at evaluating the existing pedes-trian detectors in various conditions, and at providing a dataset to train more efficient methods.
What (other) tasks could the dataset be used for?
By construction, there are many information included in the dataset : the weather condition, the pedestrian posi-tion, the pedestrian clothes color and the pedestrian di-rection. It could be then used for various classification, multi-label, regression tasks. Another application is the image generation field. Indeed, the dataset is large enough to train GANs or auto-encoders. With all the available la-bels, this dataset could be used to study different types of conditioning in image generation or information discover-ing.
Has the dataset been used for any tasks already? If so, where are the results so others can compare (e.g., links to published papers)?
Currently the dataset was only used in the paper presenting it in the vision field [DEBAD+17], to compare HOG and Haar detectors.
Who funded the creation of the dataset?
The Cerema organized the data collection. From the ”README AND LICENCE” file available on the website: This work has been sponsored by the French government research program ”Investissements d’Avenir” through the IMobS3 Laboratory of Excellence (ANR-10-LABX-16-01) and the RobotEx Equipment of Excellence (ANR-10-EQPX-44), by the European Union through the Regional Compet-itiveness and Employment program -2014-2020- (ERDF – AURA region) and by the AURA region. The Cerema also would like to thank Pascal Institute and the National Engi-neering School of Sousse.
Any other comments?
Available at https://ceremadlcfmds.wixsite.com/ cerema-databases.
Dataset Composition
What are the instances?(that is, examples; e.g., docu-ments, images, people, countries) Are there multiple types of instances? (e.g., movies, users, ratings; people, interac-tions between them; nodes, edges)
Instances are images produced in Fog and Rain R&D Plat-form. This platform is used for : reproduction and con-trol of fog’s particle size, of meteorological visibility, and of rain’s particle size and intensity; physical characteriza-tion of natural and artificial fog and rain. The platform is
used for various applications as development of algorithms for image analysis and processing in adverse weather con-ditions, application and development of new imaging tech-nologies in the specific conditions of fog and rain (infrared, laser. . . ), performance testing of upcoming advance driver assistance systems (ADAS) including automatic obstacle detection features (lidar). 5.
Are relationships between instances made explicit in the data? (e.g., social network links, user/movie rat-ings, etc.)?No
How many instances are there? (of each type, if appropriate)?
There are 51302 images.
What data does each instance consist of ? “Raw” data (e.g., unprocessed text or images)? Fea-tures/attributes? Is there a label/target associated with instances? If the instances related to people, are subpop-ulations identified (e.g., by age, gender, etc.) and what is their distribution?
Images are raw images, in resolution 1024x631, which corre-sponds to standard resolution for cameras in cars. Concern-ing the image descriptions, some are available accordConcern-ing to the folder organization (folder names give the classes)
• the weather : 10 classes, day and night, each with good weather, light rain, heavy rain, light fog, heavy fog • the pedestrian : 5 groups, corresponding to 5 people
who participated to the data collection : 3 women, 2 men.
• the clothes : 2 categories, each pedestrian appears with 2 outfits (one light and one dark)
Other labels are available in an external csv file:
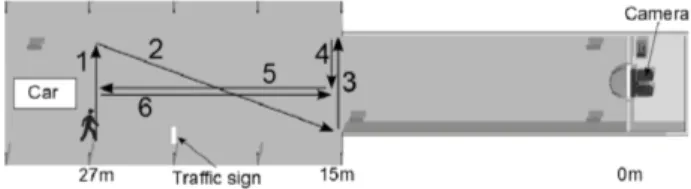
• the bounding box containing the pedestrian (coordi-nates of the top left corner, height and width) • the direction of the pedestrian : 6 directions, left close,
right far and right close, forth, back and 1 diagonal. See figure 6
• pedestrian id : 10 groups, corresponding to each of the 5 persons with each of the 2 outfits. Be careful, some labels are set to 0 in the file (but it is easy to correct it from the pedestrian and clothes information.
Is everything included or does the data rely on ternal resources? (e.g., websites, tweets, datasets) If ternal resources, a) are there guarantees that they will ex-ist, and remain constant, over time; b) is there an official archival version; c) are there access restrictions or fees?
All included
Are there recommended data splits and evaluation measures? (e.g., training, development, testing; accuracy or AUC)No
What experiments were initially run on this dataset?
5More information - in French - https://www.
cerema.fr/system/files/documents/technology2017/ Cerema-effi-sciences_Plateforme-9-10.pdf
Figure 6: Path taken by each of the pedestrian, indi-cating the directions.
Pedestrian detection was tested only in favorable condi-tions. So that, Cerema-AWP was created to evaluate pedes-trian detection under adverse weather conditions by day and by night with two of the most common detectors (Haar detector [VJ01] and HOG detector [DT05])
Have a summary of those results.
The results show that two representative state-of-the-art detectors (HOG and Haar) have much lower results when the weather is degraded, which justifies the need for this dataset.
Any other comments?
If necessary, additional experiments can be carried out within the Fog and Rain R&D Platform on request. For this, it is possible to contact the authors (Pierre Duthon)
Data Collection Process
How was the data collected? (e.g., hardware appa-ratus/sensor, manual human curation, software program, software interface/API)
The images were acquired by DFW-SX700 Sony camera at 7.5 fps and with a resolution of 1024x631 (aperture = 8.6 ; focus = 30m ; zoom = 8mm ; exposure time given for each image in the csv file).
Who was involved in the data collection process? (e.g., students, crowdworkers) and how were they compen-sated (e.g., how much were crowdworkers paid)?
3 permanent researchers, 2 permanent technicians and 1 trainee was involved for the technical preparation of data collection. 1 permanent technician, 1 PhD student, 1 post-doc and 2 trainees are pedestrians on the dataset. Labeling was performed by the permanent researcher and a trainee.
Over what time-frame was the data collected? Does the collection frame match the creation time-frame of the instances?
It was collected between April 19th and 27th 2016. The real time-frame of the instance is given in the filename of each instance in format YYYY-MM-DD HH-MM-SS MS.
How was the data associated with each instance acquired? Was the data directly observable (e.g., raw text, movie ratings), reported by subjects (e.g., survey responses), or indirectly inferred/derived from other data (e.g., part of speech tags; model-based guesses for age or language)? If the latter two, were they validated/verified and if so how?
All information are directly observable and the collection process was done according to a scenario. There’s no room for subjectivity.
Does the dataset contain all possible instances? Or is it a sample (not necessarily random) of instances from a larger set?It contains all possible instances (all positions of the scenario for all pedestrian under all weather conditions).
If the dataset is a sample, then what is the pop-ulation? What was the sampling strategy (e.g., de-terministic, probabilistic with specific sampling probabili-ties)? Is the sample representative of the larger set (e.g., geographic coverage)? If not, why not (e.g., to cover a more diverse range of instances)? How does this affect possible uses?
Not relevant.
Is there information missing from the dataset and why? (this does not include intentionally dropped in-stances; it might include, e.g., redacted text, withheld doc-uments) Is this data missing because it was unavailable?No.
Any other comments?
Preprocessing
What preprocessing/cleaning was done? (e.g., discretization or bucketing, tokenization, part-of-speech tagging, SIFT feature extraction, removal of instances) Was the “raw” data saved in addition to the prepro-cessed/cleaned data? (e.g., to support unanticipated future uses)
Only raw data.
Is the preprocessing software available?
Not relevant.
Does this dataset collection/processing procedure achieve the motivation for creating the dataset stated in the first section of this datasheet? If not, what are the limitations?Yes
Any other comments?
Dataset Distribution
How will the dataset be distributed? (e.g., tarball on website, API, GitHub; does the data have a DOI and is it archived redundantly?)
3 rar files on the website.
When will the dataset be released/first distributed? What license (if any) is it distributed under?
It was released in February 2018 under the Open Database Licence http://opendatacommons.org/licenses/odbl/1. 0/.
Are there any copyrights on the data?
Any rights in individual contents of the database are licensed under the Database Contents License: http://opendatacommons.org/licenses/dbcl/1.0/.
Are there any fees or access/export restrictions?No
Dataset Maintenance
Who is supporting/hosting/maintaining the
dataset?
Cerema.
Will the dataset be updated? If so, how often and by whom?No.
How will updates be communicated? (e.g., mailing list, GitHub)
Not relevant.
Is there an erratum? No.
If the dataset becomes obsolete how will this be communicated?
Not relevant.
Is there a repository to link to any/all pa-pers/systems that use this dataset?No.
If others want to extend/augment/build on this dataset, is there a mechanism for them to do so? If so, is there a process for tracking/assessing the quality of those contributions. What is the process for communicating/distributing these contributions to users?No.
Any other comments?
Legal & Ethical Considerations
If the dataset relates to people (e.g., their at-tributes) or was generated by people, were they in-formed about the data collection? (e.g., datasets that collect writing, photos, interactions, transactions, etc.)Not relevant.
If it relates to people, were they told what the dataset would be used for and did they consent? If so, how? Were they provided with any mechanism to revoke their consent in the future or for certain uses?Not relevant.
If it relates to people, could this dataset expose people to harm or legal action? (e.g., financial social or otherwise) What was done to mitigate or reduce the potential for harm?Not relevant.
If it relates to people, does it unfairly advantage or disadvantage a particular social group? In what ways? How was this mitigated?Not relevant.
If it relates to people, were they provided with pri-vacy guarantees? If so, what guarantees and how are these ensured?Not relevant.
Does the dataset comply with the EU General Data Protection Regulation (GDPR)? Does it comply with any other standards, such as the US Equal Employment Opportunity Act?Not relevant.
Does the dataset contain information that might be considered sensitive or confidential? (e.g., personally identifying information)No.
Does the dataset contain information that might be considered inappropriate or offensive? No.
Any other comments?
A
Architecture details
A.1
Classification and regression tasks
The provided architecture is for Weather and Pedestri-anClothes which are both 10 classes. For the other clas-sification tasks, only the output is modified to match the number of classes or the number of regression val-ues.
Layer (type) Output Shape Param # ================================================================= conv1 (Conv2D) (None, 77, 126, 64) 4864 _________________________________________________________________ pool1 (MaxPooling2D) (None, 38, 63, 64) 0 _________________________________________________________________ batch_normalization_1 (Batch (None, 38, 63, 64) 256 _________________________________________________________________ conv2 (Conv2D) (None, 18, 31, 128) 73856 _________________________________________________________________ pool2 (MaxPooling2D) (None, 9, 15, 128) 0 _________________________________________________________________ batch_normalization_2 (Batch (None, 9, 15, 128) 512 _________________________________________________________________ conv3 (Conv2D) (None, 4, 7, 256) 295168 _________________________________________________________________ pool3 (MaxPooling2D) (None, 2, 3, 256) 0 _________________________________________________________________ batch_normalization_3 (Batch (None, 2, 3, 256) 1024 _________________________________________________________________ flatten_19 (Flatten) (None, 1536) 0 _________________________________________________________________ fc2 (Dense) (None, 128) 196736 _________________________________________________________________ output_weather (Dense) (None, 10) 1290 =================================================================
A.2
Multi label classification
Layer (type) Output Shape Param# Connected to ================================================================ main_input(InputLayer) (None, 158, 256, 3) 0
________________________________________________________________ conv1 (Conv2D) (None, 77, 126, 64) 4864 main_input[0][0] ________________________________________________________________ pool1 (MaxPooling2D) (None, 38, 63, 64) 0 conv1[0][0] ________________________________________________________________ batch_norm_13(BatchNorm)(None, 38, 63, 64) 256 pool1[0][0] ________________________________________________________________ conv2 (Conv2D) (None, 18, 31, 128) 73856 batch_norm_13[0][0] ________________________________________________________________ pool2 (MaxPooling2D) (None, 9, 15, 128) 0 conv2[0][0] ________________________________________________________________ batch_norm_14(BatchNorm) (None, 9, 15, 128) 512 pool2[0][0] ________________________________________________________________ conv3 (Conv2D) (None, 4, 7, 256) 295168 batch_norm_14[0][0] ________________________________________________________________ pool3 (MaxPooling2D) (None, 2, 3, 256) 0 conv3[0][0] ________________________________________________________________ batch_norm_15 BatchNorm) (None, 2, 3, 256) 1024 pool3[0][0] ________________________________________________________________ flatten_5 (Flatten) (None, 1536) 0 batch_norm_15[0][0] ________________________________________________________________ fc1d (Dense) (None, 512) 786944 flatten_5[0][0] ________________________________________________________________ fc1w (Dense) (None, 512) 786944 flatten_5[0][0] ________________________________________________________________ fc1p (Dense) (None, 512) 786944 flatten_5[0][0] ________________________________________________________________ fc2d (Dense) (None, 128) 65664 fc1d[0][0] ________________________________________________________________ fc2w (Dense) (None, 128) 65664 fc1w[0][0] ________________________________________________________________ fc2p (Dense) (None, 128) 65664 fc1p[0][0] ________________________________________________________________ output_direction(Dense) (None, 6) 774 fc2d[0][0]
________________________________________________________________ output_weather (Dense) (None, 6) 774 fc2w[0][0] ________________________________________________________________ output_pedestrian (Dense) (None, 5) 645 fc2p[0][0] ________________________________________________________________ output_clothes (Dense) (None, 2) 258 fc2p[0][0] ================================================================
A.3
Auto-encoder
_________________________________________________________________ Layer (type) Output Shape Param # ================================================================= image_input (InputLayer) (None, 158, 256, 3) 0 _________________________________________________________________ conv1 (Conv2D) (None, 79, 128, 64) 4864 _________________________________________________________________ pool1 (MaxPooling2D) (None, 40, 64, 64) 0 _________________________________________________________________ batch_normalization_85 (Batc (None, 40, 64, 64) 256 _________________________________________________________________ conv2 (Conv2D) (None, 20, 32, 128) 73856 _________________________________________________________________ pool2 (MaxPooling2D) (None, 10, 16, 128) 0 _________________________________________________________________ batch_normalization_86 (Batc (None, 10, 16, 128) 512 _________________________________________________________________ conv3 (Conv2D) (None, 5, 8, 256) 295168 _________________________________________________________________ pool3 (MaxPooling2D) (None, 3, 4, 256) 0 _________________________________________________________________ batch_normalization_87 (Batc (None, 3, 4, 256) 1024 _________________________________________________________________ flatten_29 (Flatten) (None, 3072) 0 _________________________________________________________________ fc1d (Dense) (None, 256) 786688 _________________________________________________________________ fc2d (Dense) (None, 100) 25700 _________________________________________________________________ fc1g (Dense) (None, 256) 25856 _________________________________________________________________ fc2g (Dense) (None, 3072) 789504 _________________________________________________________________ reshape_27 (Reshape) (None, 3, 4, 256) 0 _________________________________________________________________ deconv3 (Conv2DTranspose) (None, 6, 8, 256) 590080 _________________________________________________________________ cropping2d_15 (Cropping2D) (None, 5, 8, 256) 0 _________________________________________________________________ depool2 (UpSampling2D) (None, 10, 16, 256) 0 _________________________________________________________________ deconv2 (Conv2DTranspose) (None, 20, 32, 128) 295040 _________________________________________________________________ depool1 (UpSampling2D) (None, 40, 64, 128) 0 _________________________________________________________________ deconv1 (Conv2DTranspose) (None, 80, 128, 64) 204864 _________________________________________________________________ depool0 (UpSampling2D) (None, 160, 256, 64) 0 _________________________________________________________________ cropping2d_16 (Cropping2D) (None, 158, 256, 64) 0 _________________________________________________________________ deconv0 (Conv2DTranspose) (None, 158, 256, 3) 4803 =================================================================
A.4
GAN
Generator:
_________________________________________________________________ Layer (type) Output Shape Param # ================================================================= dense_3 (Dense) (None, 81920) 4177920 _________________________________________________________________ leaky_re_lu_8 (LeakyReLU) (None, 81920) 0 _________________________________________________________________ batch_normalization_5 (Batch (None, 81920) 327680 _________________________________________________________________ reshape_2 (Reshape) (None, 20, 32, 128) 0
_________________________________________________________________ dropout_5 (Dropout) (None, 20, 32, 128) 0 _________________________________________________________________ up_sampling2d_4 (UpSampling2 (None, 40, 64, 128) 0 _________________________________________________________________ conv2d_transpose_5 (Conv2DTr (None, 40, 64, 128) 409728 _________________________________________________________________ leaky_re_lu_9 (LeakyReLU) (None, 40, 64, 128) 0 _________________________________________________________________ batch_normalization_6 (Batch (None, 40, 64, 128) 512 _________________________________________________________________ up_sampling2d_5 (UpSampling2 (None, 80, 128, 128) 0 _________________________________________________________________ conv2d_transpose_6 (Conv2DTr (None, 80, 128, 64) 204864 _________________________________________________________________ cropping2d_2 (Cropping2D) (None, 79, 128, 64) 0 _________________________________________________________________ leaky_re_lu_10 (LeakyReLU) (None, 79, 128, 64) 0 _________________________________________________________________ batch_normalization_7 (Batch (None, 79, 128, 64) 256 _________________________________________________________________ up_sampling2d_6 (UpSampling2 (None, 158, 256, 64) 0 _________________________________________________________________ conv2d_transpose_7 (Conv2DTr (None, 158, 256, 32) 51232 _________________________________________________________________ leaky_re_lu_11 (LeakyReLU) (None, 158, 256, 32) 0 _________________________________________________________________ batch_normalization_8 (Batch (None, 158, 256, 32) 128 _________________________________________________________________ conv2d_transpose_8 (Conv2DTr (None, 158, 256, 3) 2403 _________________________________________________________________ activation_3 (Activation) (None, 158, 256, 3) 0 ================================================================= Total params: 5,174,723 Trainable params: 5,010,435 Non-trainable params: 164,288 _________________________________________________________________ Discriminator: _________________________________________________________________ Layer (type) Output Shape Param # ================================================================= conv2d_4 (Conv2D) (None, 79, 128, 32) 2432 _________________________________________________________________ leaky_re_lu_12 (LeakyReLU) (None, 79, 128, 32) 0 _________________________________________________________________ dropout_6 (Dropout) (None, 79, 128, 32) 0 _________________________________________________________________ conv2d_5 (Conv2D) (None, 40, 64, 64) 51264 _________________________________________________________________ leaky_re_lu_13 (LeakyReLU) (None, 40, 64, 64) 0 _________________________________________________________________ dropout_7 (Dropout) (None, 40, 64, 64) 0 _________________________________________________________________ conv2d_6 (Conv2D) (None, 20, 32, 128) 204928 _________________________________________________________________ leaky_re_lu_14 (LeakyReLU) (None, 20, 32, 128) 0 _________________________________________________________________ dropout_8 (Dropout) (None, 20, 32, 128) 0 _________________________________________________________________ flatten_2 (Flatten) (None, 81920) 0 _________________________________________________________________ dense_4 (Dense) (None, 1) 81921 _________________________________________________________________ activation_4 (Activation) (None, 1) 0 ================================================================= Total params: 340,545
Trainable params: 340,545 Non-trainable params: 0