HAL Id: hal-01539768
https://hal.sorbonne-universite.fr/hal-01539768
Submitted on 15 Jun 2017
HAL is a multi-disciplinary open access
archive for the deposit and dissemination of
sci-entific research documents, whether they are
pub-lished or not. The documents may come from
L’archive ouverte pluridisciplinaire HAL, est
destinée au dépôt et à la diffusion de documents
scientifiques de niveau recherche, publiés ou non,
émanant des établissements d’enseignement et de
Assessment of trabecular bone tissue elasticity with
resonant ultrasound spectroscopy
H. Daoui, Xiran Cai, F. Boubenider, P. Laugier, Q. Grimal
To cite this version:
H. Daoui, Xiran Cai, F. Boubenider, P. Laugier, Q. Grimal. Assessment of trabecular bone tissue
elasticity with resonant ultrasound spectroscopy. Journal of the mechanical behavior of biomedical
materials, Elsevier, 2017, 74, pp.106-110. �10.1016/j.jmbbm.2017.05.037�. �hal-01539768�
Assessment of trabecular bone tissue elasticity with
resonant ultrasound spectroscopy
H. Daouia,b, X. Caia,∗, F. Boubeniderb, P. Laugiera, Q. Grimala
aSorbonne Universit´es, UPMC Univ Paris 06, INSERM UMR-S 1146, CNRS UMR 7371, Laboratoire d’Imagerie Biom´edicale, 75006 Paris, France
bUniversit´e des Sciences et de la Technologie Houari Boumediene, Facult´e de Physique, Laboratoire de Physique des Mat´eriaux, 16111 Algiers, Algeria
Abstract
The material properties of the trabeculae (tissue-level properties), together with the trabecular architecture and the bone volume fraction determine the appar-ent millimetre-scale bone mechanical properties. We presappar-ent a novel method to measure trabecular tissue elastic modulus Et using resonant ultrasound
spec-troscopy (RUS). The first mechanical resonance frequency feof a freestanding cuboid specimen is measured and used to back-calculate Et. The steps of the
back-calculation are (1) the apparent stiffness tensors C( ˜Et) is computed
us-ing micro-finite elements for a set of trial values of tissue Young’s modulus ˜Et
based on the computed tomography image of the specimen; (2) the modeled free-vibration resonance frequencies fm( ˜E
t) of the specimen is calculated with
the Rayleigh-Ritz method using C( ˜Et); (3) finally, Etis obtained by
interpola-tion using fe and fm( ˜E
t). Four bovine bone specimens were tested (nominal
size 5×6×6 mm3). Average (standard deviation) of E
t was 13.12 (1.06) GPa.
The measurement of a single resonance frequency enabled an estimation of tis-sue elasticity in line with available data. RUS is a non destructive technique relatively easy to implement compared to traditional mechanical testing. The novel method could contribute to a better documentation of bone tissue elas-ticity which is an important parameter of micro-finite element analyses for the
∗Corresponding author
clinical assessment of bone strength.
Keywords: Cancellous bone, Tissue elasticity, Micro-finite elements, Vibration, Porous medium
1. Introduction
The material properties of the trabeculae (tissue-level properties), together with the trabecular architecture and the bone volume fraction determine the apparent mechanical properties of trabecular bone at the scale of several mil-limetres (Cowin, 2001). These properties change during growth (Boskey and Coleman, 2010) and possibly in adult life in response to changes in loading con-ditions, or due to pathologies (Brennan et al., 2009; Oftadeh et al., 2015). Also, tissue-level properties are required as input for numerical bone models based on high resolution imaging (van Rietbergen and Ito, 2015).
Although many studies have been devoted to measure the elastic proper-ties of trabeculae, it remains technically challenging and demanding to quan-tify these properties. Nanoindentation (Zysset et al., 1999) and acoustic mi-croscopy (Raum, 2008) require fine surface preparation (polishing) and give only local values of elasticity which may not be representative of the specimen and depend on the probing direction. Similarly, elasticity values obtained from a bending test (Choi et al., 1990; Szab´o et al., 2011) or an ultrasonic test (Rho, 1998) of an individual trabeculae may not be representative of larger volumes of the tissue. An alternative approach is to back-calculate the tissue-level elastic properties using experimental data of a mechanical test of a specimen of several millimetres (van Rietbergen et al., 1995; Ladd et al., 1998). That is, the value of trabecular tissue Young’s modulus Etis obtained by fitting the response of a
micro-finite element (µ-FE) model to the apparent macroscopic modulus E of a specimen. As opposed to previously mentioned approaches, tissue modulus Et
obtained this way is representative of the entire specimen’s volume.
Simulations using µ-FE methods has become a standard procedure to obtain in silico apparent trabecular bone properties (Niebur et al., 2000; Verhulp et al.,
2008). However, the accuracy and precision of mechanical testing to obtain E is limited and may critically depend on experimental boundary conditions and specimen size (Keaveny et al., 1997). Also, mechanical testing may be destructive because rather larger strains are induced to increase precision.
The steps of the method are (1) the first free-vibration resonance frequency fe of a cuboid specimen is measured; (2) apparent stiffness tensor C( ˜E
t) are
computed using µ-FE for a set of trial values of tissue Young’s modulus ˜Et;
(3) the free-vibration resonance frequencies fm( ˜E
t) of a model of the vibrating
specimen are calculated using the set of tensors C( ˜Et); (4) finally, the actual
tissue modulus Etis obtained by interpolation using feand fm( ˜Et). In order to
demonstrate the feasibility of the technique, we measured four bovine specimens taken from a single femoral head.
2. Method
2.1. Specimens
Four rectangular parallelepipeds (RP) specimens of bovine bone were pre-pared from the femoral head of a bovine obtained from a local butcher. The bovine was about two years old. In between preparation steps, specimens were stored at -20◦C. The femoral head was excised from the femur and the soft tissues were removed manually. RP specimens were prepared using a linear saw (Isomet 4000, Buehler GmbH, Dusseldorf, Germany) under continuous ir-rigation. During cutting, care was taken to obtain, for each specimen, pairs of parallel faces in three orthogonal directions. The specimens were pure tra-becular bone and did not contain cortical bone parts as could be verified on micro-CT images. The orientation of the specimen with respect to anatomical axes was not controlled as the method introduced in this paper does not require any assumption on trabecuae orientation. Specimens were defatted for 12h in a chemical bath of diethylether and methanol (1:1) and washed with saline water. This protocol does not modify bone elasticity (Cai et al., 2017). After deffat-ing, specimens were stored at ambient temperature in phosphate-buffered saline
Table 1: Dimensions and mass of specimens
specimen 1 2 3 4
mass (mg) 115.48 117.82 135.18 123.48 dimensions (mm3) 4.92×5.59×6.05 4.90× 5.83× 6.83 4.90× 6.04× 6.85 4.93× 5.58× 5.83
solution(Gibco, cat. no. 70011044).
Specimen dimensions were determined using an electronic calliper (±0.02 mm precision). The smallest specimen dimensions were (4.93×5.58×5.83) mm3and
the largest were (4.90×6.04×6.10) mm3. Mass was measured with a scale
(pre-cision ±0.1 mg). Table 1 gives the dimension and mass of all specimens.
2.2. Image acquisition and processing
The specimens were imaged using a desktop micro-CT system (Skyscan 1172, Bruker, Kontich, Belgium), with a field of view of 2000×2000 pixels, a source voltage 80 kV, current 100 µA, and rotation step 0.3◦ over a 360◦ rotation. An isotropic voxel size of 9 µm was used. Images were reconstructed using a filtered back-projection algorithm (NRecon software, V 1.6.9, Skyscan NV, Kontich, Belgium).
After reconstruction, images were processed using ImageJ (Schneider et al., 2012): the pixel size was doubled to reduce image size; images were segmented with Otsu method, rotated and cropped in order to obtain specimen’s faces aligned with the image frame.
2.3. RUS measurements
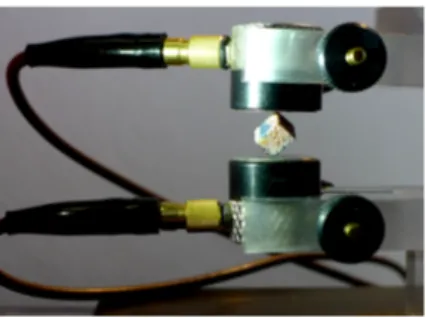
Specimens were taken out of the saline solution five to six hours before the RUS measurement. Any water between the trabeculae was removed with an air jet and absorbent paper. RUS measurements were conducted following the method and apparatus introduced by (Bernard et al., 2014). Briefly, the specimen was placed between a pair of shear ultrasonic transducers (V154RM, Panametrics, Waltham, MA), one acting as an emitter and the second one as a
Figure 1: RUS measurement configuration showing the mounting of a bovine specimen be-tween ultrasonic transducers. Measurements are repeated with successive mounting on the different pairs of opposite corners.
receiver (Fig. 1). Quasi stress-free boundaries conditions are achieved by plac-ing the specimen on the transducers on two opposite corners and minimizplac-ing the force acting on the specimen. The force applied was not monitored but a single trained operator conducted all the measurements; accordingly we as-sume that the specimens were measured with comparable boundary conditions very close to free standing. A vectorial network analyser (Bode 100, Omicron electronics GmbH, Klaus, Austria) was used to record the frequency spectrum (phase and magnitude) of the specimen between 20 and 140 kHz with 50 Hz resolution. The receiver output signal was preconditioned before recording by a broadband charge amplifier (HQA-15 M-10 T, Femto Messtechnik GmbH, Berlin, Germany).
RUS measurement of one specimen consisted in a series of 8 spectra acqui-sitions: the specimen was successively maintained by each of the four pairs of opposite corners and two spectra were acquired for each case, with a rotation of 90◦ of the specimen in between. The purpose of this procedure is to maximize the chance to excite the first vibration mode and to account for the possible small variability of the resonance frequency according to the specimen position. For each specimen, the frequency fe of the first peak was estimated from
the 8 spectra acquisitions of a series. A typical acquisition of a series of eight spectra is shown in Fig. 2. In preliminary measurements, we found that for the different specimens, the first resonant frequency could not be identified for
Figure 2: Typical RUS spectra around the first resonance frequency. Eight repetitions are shown corresponding to two measurements for the positioning on each of the four pairs of corners. The vertical line indicates the estimated average frequency of the first resonance peak.
all spectra of an acquisition series. Typically in one to three acquisitions in a total of eight, the peak due to the first resonance could not be observed, likely because the corresponding eigenmode was weakly excited. To account for this, fe was calculated as the average of the frequency of the three peaks of larger amplitude.
2.4. µ-FE and model frequency calculation
Specimens’ CT scans were converted into FE models using direct voxel to element conversion in FAIM software (FAIM version 7.1, Numerics88 Solutions, Calgary, Canada). The size of the hexahedral elements was 18µm. This oper-ation includes removing non connected voxels. In our model, isotropic tissue elastic properties were assumed. All bone voxels were given a Young’s modulus
˜
Et. Trial values of ˜Etfor µ-FE models were between 4 and 20 GPa. Preliminary
tests showed that the influence of the value of Poisson’s ratio on the calculated first resonant frequency was negligible. Accordingly, a unique Poisson’s ratio value of 0.3 was used for all calculations. Six different uniaxial strains were suc-cessively applied to each specimen following the Direct Mechanics method (van Rietbergen et al., 1996) as implemented in FAIM. This resulted in apparent stiffness tensors C( ˜Et). In 6×6 matrix form, these tensors had in general 21 non
Table 2: Tissue elastic modulus Et(GPa) back-calculated from the first resonance frequency of each specimen.
specimen 1 2 3 4 Et(GPa) 13.35 13.92 11.56 13.63
with respect to the trabecular organization.
Rayleigh-Ritz method (Ohno, 1976; Sedl´ak et al., 2014) which is traditionally used to process RUS data, was used to calculate the first free vibration resonant frequency of each specimen for the different values ˜Et. Namely, for each trial
value ˜Et, the frequencies fm( ˜Et) were calculated given the specimen’s mass,
dimensions, and stiffness tensor C( ˜Et). Using linear interpolation, the actual
tissue modulus Etof a specimen was deduced from fm( ˜Et) and the frequency
fefrom the RUS measurement. Data analysis was conducted with Matlab 2014b
(The Mathworks Inc., Natick, MA, USA).
3. Results
The average bone volume fraction reported as bone volume divided by total volume (BV /T V ) after removing non-connected voxels was 0.27±0.02. The first resonant frequency fe, which depends both on the dimensions and the
apparent properties of the specimen, were in the range [50.9, 66.5] kHz. The precision of the frequency estimation of the peak was obtained by conducting four measurements of the peak for the four specimens. The resulting precision of fe(average of three peak frequencies) was 1.17% (Gluer et al., 1995).
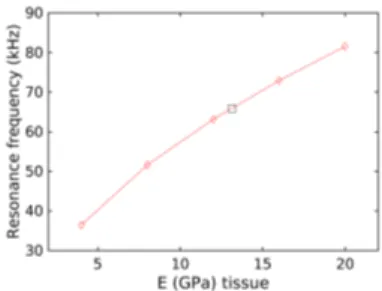
For all specimens, the calculated first resonant frequency fm had a
mono-tonic and smooth dependence in ˜Et (Fig. 3) and a linear interpolation was
sufficient to back-calculate Etfrom the experimental frequency fe. Table 2
re-ports the calculated Et for all the specimens. The average of back-calculated
Figure 3: Calculated first resonance frequency as a function of test values of tissue Young’s modulus. The black square symbol corresponds to the measured resonant frequency.
4. Discusion
RUS has seldom been used to measure heterogeneous materials or foam-like materials similar to trabecular bone (Li et al., 2013). Our observations on bovine trabecular bone specimens demonstrated that at least the resonance of the first vibrational mode can be successfully identified. The precision of less than 2% suggests that the recorded frequency is weakly dependent on the positioning of the specimen in the set-up.
The calculation to obtain the tissue modulus from the measurement of a res-onance frequency involves a µ-FE computation of the apparent stiffness tensor of the specimen and the calculation of the resonance frequency of a model of the specimen (with the semi-analytic Rayleigh-Ritz method). It is noteworthy that the orientation of the specimen does not need to be controlled in our approach. The main orientation of the trabeculae actually made an angle with respect to the specimen faces. The fact that the vibrational response of the specimen depends on the orientation of the trabeculae with respect to the specimen faces
is fully taken into account in the µ-FE computation.
We found that a measurement of a single resonance frequency enables an estimation of tissue Young’s modulus in line with data published previously.
The recent review by Oftadeh et al. (2015) has showed a high variability of trabecular bone tissue Young’s modulus in humans and animals (bovine, sheep, porcine) with values ranging from 5.7 to 24.4 GPa. There may be several
rea-sons to this wide range of values, including experimental artifacts, anatomic site-dependence, heterogeneity of tissue density, sample size, or the effect of strain rate. Several authors have used µ-FE models calibrated using exper-imental data (usually an uniaxial compression) to obtain an effective tissue moduli: for instance Verhulp et al. (2008) found 6.54±1.11 GPa (bovine tra-becular bone), Niebur et al. (2000) found a Young’s modulus of 18.7 ±3.4 GPa (bovine trabecular bone), and Bayraktar et al. (2004) found 18.0 ± 2.8 GPa (hu-man femoral bone). Measuring the Young’s modulus of individual trabecuae in the direction of their long axis with ultrasound, Rho (1998) found an average of 14.9 ±1.7 GPa with a minimum of 12.1 and a maximum of 19.4 GPa (human tibia). Somewhat higher values (29.09 ± 2.39 GPa) have also been found for the extravascular tissue Young’s modulus (Luczynski et al., 2015) performing uniaxial compression on micro-scale beam specimens. The Young’s modulus found in the present study (13.12 ± 1.06 GPa) is in the mid-range of the moduli determined in aforementioned studies.
Given that the specimens were prepared from a single femoral head, we did not expect large variations in measured Et. Overall, the variability of tissue
moduli determined in the present study was 18.5 % with a variability of only 4.2 % for three out of four specimens. This variability may be explained both by a small heterogeneity of tissue modulus within the femoral head and various sources of errors as detailed below.
Given the precision of the measured frequency peaks we estimate the preci-sion of the frequency estimation to about 1 kHz. The sensitivity of the technique can be estimated from ∂fe/∂ ˜Etwhich is about 2.3 kHz/GPa. The resulting
un-certainty on Etis about 0.4 GPa. Other sources of uncertainty may come from
the numerical bone model manipulation. The computation of frequencies in-volves image cropping and rotation to obtain a perfect RP with faces aligned with the frame of the µ-FE computation in order to apply the loadings accord-ing to the direct mechanics scheme. The uncertainties associated to this process remain to be quantified.
did not conduct a convergence study to quantify the potential bias in the de-termination of Etdue to the digitization of the trabeculae. Nevertheless, we do
not expect an important error due to meshing. Indeed, the chosen element size is significantly less than one-fourth of the typical trabecular thickness, as rec-ommended for numerical convergence (Niebur et al., 1999). Also, the element size was smaller than in most of the previously published µ-FE studies (Van Rietbergen et al., 1998; Ladd et al., 1998; Niebur et al., 2000; Bayraktar et al., 2004; Verhulp et al., 2008; Blanchard et al., 2013).
Another potentially important source of errors is related to the precision the shape of the RP specimen. In an unpublished work, we estimated the uncertainty of the apparent elasticity of the specimen due to geometry errors to be between 1 and 5 %.
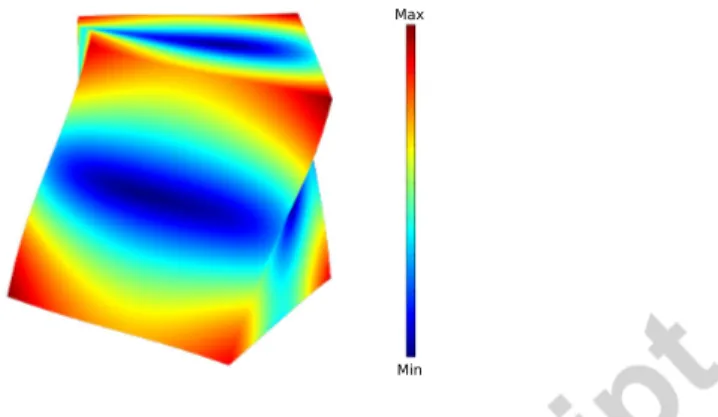
Similarly to practically all previous studies implementing trabecular bone µ-FE models, the bone tissue was assumed to be isotropic and homogeneous, with a fixed Poisson’s ratio. There is extensive experimental evidence that this assumption yields µ-FE results consistent with actual mechanical testing (Ladd et al., 1998; Kabel et al., 1999; Niebur et al., 2000; Bayraktar et al., 2004). For instance, Kabel et al. (1999) demonstrated the consistency with experiments of simulations of uniaxial compression tests in three orthogonal directions us-ing a µ-FE trabecular bone model with isotropic tissue elastic properties, i.e., the anisotropic apparent level properties were correctly modeled assuming an isotropic tissue. This is because the apparent level anisotropy is essentially due to the oriented trabecular architecture. In uniaxial compression, trabeculae are essentially loaded in compression or bending, hence their deformation is essen-tially governed by their elastic properties in the long direction of the trabeculae (average direction of collagen fibers). Accordingly, the tissue Young’s modu-lus used in the µ-FE simulations is interpreted as the modumodu-lus in the direction of the trabeculae axis Cowin (1997). Nevertheless, these assumptions may be challenged depending on loading type and specimen’s microarchitecture. In our testing method, the first vibrational mode is associated to a torsion-like deformation of the specimen illustrated on (Fig. 4). Further studies should
in-Max
Min
Figure 4: The first free vibrational mode (a torsion-like mode) of the specimen computed with typical apparent stiffness obtained by the µ-FE model.The color scale demonstrates the displacement level.
vestigate the validity of the assumptions of isotropy and constant Poisson’s ratio for such a loading. Although the model accounts for the microarchitecture, it also seems important to investigate further possible interactions between the back-calculated Etand microarchitectural variables.
This study has several limitations. Only four specimens from a bovine were used. An important question is the extrapolation of the technique proposed here to human cancellous bone. The bone volume fraction of human bone can be somewhat smaller than that of bovine bone. Some preliminary tests achieved with the setup used in the present work indicate that the first vibration peak is measurable in human cancellous bone.
An important limitation is that the back-calculated values of Et were not
validated against an independent assessment of tissue Young’s modulus from a reference technique. Several avenues could be explored toward this goal. A first possibility would be to use nanoindentation to measure tissue modulus. But, even if nanoindentation is used as a reference method, many difficulties will have to be overcome. Many indentation measurements should be combined to obtain an average tissue Young’s modulus because indentation measures a local elastic property and is sensitive to the local orientation of mineralized collagen fibres. Another possibility would be to measure the apparent elastic modulus of
a specimen with a set-up for quasi-static mechanical testing and compare it to the apparent modulus predicted from µ-FE using the tissue modulus obtained for the same specimen from a RUS measurement. This would indirectly validate the tissue modulus.
Quasi-static mechanical testing of a trabecular bone specimen associated to µ-FE calculation has been widely used to recover the tissue Young’s modulus through back-calculation. The vibrational method introduced in this paper has a number of advantages over mechanical testing. The method is non destructive and is potentially more precise because the measurement can be performed several times for a single specimen and the data can be averaged to enhance precision. In the present work we only used three measurements per specimen but the duration of a measurement being of the order of one minute, data from a large number of measurements may be averaged if necessary. The precision and accuracy of mechanical testing is driven by the limited precision when measuring small displacements in the elastic range of deformation of the specimen, and by end-effect artefacts which may be all the more important when the specimen is small. In contrast, resonant ultrasound spectroscopy is well adapted to ’small’ specimens of the typical size of bone specimens (Keaveny et al., 1997). Using RUS, the limitations in terms of accuracy and precision are essentially related to the quality of the rectangular parallelepiped geometry of the specimen and the accuracy of the measurement of its dimensions and mass. Note that RUS can also be conveniently performed on cylindrical specimens, which are easier to prepare.
5. Conclusion
As far as we know, the present study is the first attempt to assess trabecular bone tissue elasticity with a vibrational method, namely RUS. The elasticity values compare favorably with previously published data. Our results call for a broader investigation of the possibilities of the technique and of the sources of error. RUS is a non destructive technique, relatively easy to implement
compared to traditional mechanical testing, and that is efficient to measure large series of bone specimens (Bernard et al., 2016). The technique proposed in this study could contribute to a better documentation of bone tissue elastic properties of various species, at different skeletal sites, and elastic alterations with ageing, modifications of the loading environment and pathologies. Tissue elastic properties are important parameters of micro-finite element analyses for clinical assessment of bone strength (van Rietbergen and Ito, 2015).
Acknowledgment
The authors would like to thank Dr. Christine Chappard and IMOSAR facility (Universit´e Paris Diderot, INSERM, CNRS) for the access to micro-computed tomography. This work has received financial support from the Agency National Research under the ANR-13-BS09-0006 MULTIPS project.
6. References
Bayraktar, H. H., Morgan, E. F., Niebur, G. L., Morris, G. E., Wong, E. K., Keaveny, T. M., 2004. Comparison of the elastic and yield properties of human femoral trabecular and cortical bone tissue. Journal of Biomechanics 37 (1), 27–35.
Bernard, S., Grimal, Q., Laugier, P., 2014. Resonant ultrasound spectroscopy for viscoelastic characterization of anisotropic attenuative solid materials. The Journal of the Acoustical Society of America 135 (5), 2601–13.
Bernard, S., Schneider, J., Varga, P., Laugier, P., Raum, K., Grimal, Q., 2016. Elasticity–density and viscoelasticity–density relationships at the tibia mid-diaphysis assessed from resonant ultrasound spectroscopy measurements. Biomechanics and modeling in mechanobiology 15 (1), 97–109.
Blanchard, R., Dejaco, A., Bongaers, E., Hellmich, C., Oct 2013. Intravoxel bone micromechanics for microct-based finite element simulations. J Biomech
46 (15), 2710–2721.
URL http://dx.doi.org/10.1016/j.jbiomech.2013.06.036
Boskey, A. L., Coleman, R., 2010. Aging and bone. Journal of dental research 89 (12), 1333–1348.
Brennan, O., Kennedy, O. D., Lee, T. C., Rackard, S. M., O’Brien, F. J., 2009. Biomechanical properties across trabeculae from the proximal femur of normal and ovariectomised sheep. Journal of Biomechanics 42 (4), 498–503.
Cai, X., Peralta, L., Giron, A., Helfen, L., Olivier, C., Peyrin, F., Laugier, P., Grimal, Q., 2017. Cortical bone elasticity measured by resonant ultrasound spectroscopy is not altered by defatting and synchrotron x-ray imaging. Jour-nal of the Mechanical Behavior of Biomedical Materials (submitted).
Choi, K., Kuhn, J. L., Ciarelli, M. J., Goldstein, S. A., 1990. The elastic mod-uli of human subchondral, trabecular, and cortical bone tissue and the size-dependency of cortical bone modulus. Journal of biomechanics 23 (11), 1103– 1113.
Cowin, S., NOV-DEC 1997. Remarks on the paper entitled ‘Fabric and elastic principal directions of cancellous bone are closely related’. JOURNAL OF BIOMECHANICS 30 (11-12), 1191–1192.
Cowin, S. C., 2001. Bone mechanics handbook : imaging of bonoe structure. Vol. 1. CRC Press, Boca Raton, FL, (Ed.) chapter 22 fluid flow:.
Gluer, C. C., Blake, G., Lu, Y., Blunt, B. A., Jergas, M., Genant, H. K., 1995. Accurate assessment of precision errors: how to measure the reproducibility of bone densitometry techniques. Osteoporos Int 5 (4), 262–70.
Kabel, J., Van Rietbergen, B., Odgaard, A., Huiskes, R., 1999. Constitutive relationships of fabric, density, and elastic properties in cancellous bone ar-chitecture. Bone 25 (4), 481–486.
Keaveny, T. M., Pinilla, T. P., Crawford, R. P., Kopperdahl, D. L., Lou, A., 1997. Systematic and random errors in compression testing of trabecular bone. Journal of Orthopaedic Research 15 (1), 101–110.
Ladd, A. J. C., Kinney, J. H., Haupt, D. L., Goldstein, S. A., 1998. Finite-element modeling of trabecular bone: Comparison with mechanical testing and determination of tissue modulus. Journal of Orthopaedic Research 16 (5), 622–628.
Li, D., Dong, L., Lakes, R. S., 2013. The properties of copper foams with neg-ative Poisson’s ratio via resonant ultrasound spectroscopy. Physica Status Solidi (B) Basic Research 250 (10), 1983–1987.
Luczynski, K. W., Steiger-Thirsfeld, A., Bernardi, J., Eberhardsteiner, J., Hellmich, C., DEC 2015. Extracellular bone matrix exhibits hardening elasto-plasticity and more than double cortical strength: Evidence from homoge-neous compression of non-tapered single micron-sized pillars welded to a rigid substrate. JOURNAL OF THE MECHANICAL BEHAVIOR OF BIOMED-ICAL MATERIALS 52, 51–62.
Niebur, G., Yuen, J., Hsia, A., Keaveny, T., DEC 1999. Convergence be-havior of high-resolution finite element models of trabecular bone. JOUR-NAL OF BIOMECHANICAL ENGINEERING-TRANSACTIONS OF THE ASME 121 (6), 629–635.
Niebur, G. L., Feldstein, M. J., Yuen, J. C., Chen, T. J., Keaveny, T. M., 2000. High-resolution finite element models with tissue strength asymmetry accurately predict failure of trabecular bone. Journal of Biomechanics 33 (12), 1575–1583.
Oftadeh, R., Perez-Viloria, M., Villa-Camacho, J. C., Vaziri, A., Nazarian, A., 2015. Biomechanics and mechanobiology of trabecular bone: a review. Journal of Biomechanical Engineering 137 (1), 1–15.
Ohno, I., 1976. Free vibration of a rectangular parallelepiped crystal and its application to determination of elastic constants of orthorhombic. J. Phys. Earth 24 (2), 355–379.
Raum, K., 2008. Microelastic imaging of bone. IEEE Transactions on Ultrason-ics, FerroelectrUltrason-ics, and Frequency Control 55 (7), 1417–1431.
Rho, J. Y., 1998. Ultrasonic characterisation in determining elastic modulus of trabecular bone material. Medical and Biological Engineering and Computing 36 (1), 57–59.
Schneider, C. a., Rasband, W. S., Eliceiri, K. W., 2012. NIH Image to ImageJ: 25 years of image analysis. Nature Methods 9 (7), 671–675.
Sedl´ak, P., Seiner, H., Z´ıdek, J., Janovsk´a, M., Landa, M., 2014. Determination of All 21 Independent Elastic Coefficients of Generally Anisotropic Solids by Resonant Ultrasound Spectroscopy: Benchmark Examples. Experimental Mechanics 54 (6), 1073–1085.
Szab´o, M. E., Taylor, M., Thurner, P. J., 2011. Mechanical properties of sin-gle bovine trabeculae are unaffected by strain rate. Journal of Biomechanics 44 (5), 962–967.
van Rietbergen, B., Ito, K., 2015. A survey of micro-finite element analysis for clinical assessment of bone strength: The first decade. Journal of Biomechan-ics 48 (5), 832–841.
van Rietbergen, B., Odgaard, A., Kabel, J., Huiskes, R., 1996. Direct mechanics assessment of elastic symmetries and properties of trabecular bone architec-ture. Journal of Biomechanics 29 (12), 1653–7.
Van Rietbergen, B., Odgaard, A., Kabel, J., Huiskes, R., 1998. Relationships between bone morphology and bone elastic properties can be accurately quan-tified using high-resolution computer reconstructions. Journal of Orthopaedic Research 16 (1), 23–28.
van Rietbergen, B., Weinans, H., Huiskes, R., Odgaard, A., 1995. A new method to determine trabecular bone elastic properties and loading using microme-chanical finite-element models. Journal of Biomechanics 28 (1), 69–81. Verhulp, E., van Rietbergen, B., M¨uller, R., Huiskes, R., 2008. Indirect
determi-nation of trabecular bone effective tissue failure properties using micro-finite element simulations. Journal of Biomechanics 41 (7), 1479–1485.
Zysset, P. K., Edward Guo, X., Edward Hoffler, C., Moore, K. E., Goldstein, S. A., 1999. Elastic modulus and hardness of cortical and trabecular bone lamellae measured by nanoindentation in the human femur. Journal of Biome-chanics 32 (10), 1005–1012.