a
Commercial Bank Behavior In Local Markets: Theory And Evidence From New England
by
Edward W. Hill
B.A., University of Pennsylvania (1973)
M.C.P., Massachusetts Institute of Technology (1976)
Submitted In Partial Fulfillment Of The Requirements For The
Degree Of
Doctor of Philosophy
at the
Massachusetts Institute of Technology (April 1981)
Edward W. Hill, 1981
Signature of Author..-...,...r...-...
Department of Urban Studies and Planning Department of Economics, April 1981
Certified by ...
Professor William C. Wheaton, Thesis Supervisor
Accepted by...
Professor Robert Fogelson, Jhairman, Department Committee
Accepted by... Professor Richard Eckaus, Chairman, Department Committee
MAACHST7SiSTU7EI
OF TECHNOLOGY
AUG 11 1981
Commercial Bank Behavior In Local Markets: Theory and Evidence From New England
by
Edward W. Hill
Submitted to the Departments of Urban Studies and Planning and Economics on April 2, 1981 in partial fulfillment of the requirements for the Degree of Doctor of Philosophy
ABSTRACT
Since 1974 there has been an increasing amount of debate about the way in which domestic capital markets operate and influence local economic development. These concerns have intensified since 1978 with the gradual deregulation of the banking and thrift industries and increased competition for liabilities. Commercial banks, thrift institutions and money market funds are now competing for savings. These liabilities have become much more ex-pensive and volatile. These two forces promise to greatly change the insti-tutional structure of the capital markets. This thesis examines a small but important portion of the puzzle: how does local market concentration in the commercial banking industry influence local economic development?
The thesis contains seven chapters. The first two chapters establish the reasons for examining the commercial banking industry. It is shown that this industry is the most important intermediary for local economic develop-ment. The third and fourth chapters provide institutional detail and des-cription of the banking industry. The third chapter presents the major
regulations under which the industry operates. The fourth chapter is a compar-ison of the industry in New England and the nation as a whole.
In the fifth chapter this information is used to construct a theoretical model of the way in which commercial banks will allocate their assets in con-centrated local markets. Essentially the model is a portfolio model where the supply of one class of assets is restricted. The model demonstrates that a bank in a monopolized local banking market will hold a portfolio with a smaller, but riskier, share of local assets than would a bank in a competi-tive market.
The sixth chapter contains two econometric models of bank behavior. The first is a model of the behavior of individual banks in New England and the second is an aggregate model of the 57 banking markets in New England. The estimating equations demonstrate that concentration in.local banking markets influences the rate of return from the local risky asset more than the composition of the portfolio per se. It is also demonstrated that struc-tural variables exert a strong influence over the portfolio behavior of bank-ing firms in New England.
The final chapter summarizes the thesis and speculates as to its relevance for regulatory reform in the industry and the impact of the structure of the banking industry on local economic development.
Name and Title of Thesis Supervisor: William C. Wheaton
Associate Professor of Economics and Urban Studies
Acknowledgements
There are many people who have helped in the successful completion of this dissertation; they have offered advice, encouragement and support over the past two years freely and without them the dissertation would have been greatly diminished. The topic was suggested to me by Bennett Harrison and Peter Doeringer. They provided patience and financial support in my early
efforts to understand the ways in which the banking industry influenced local development. These two people gave me the encouragement to pursue what was then a very nebulous topic. My greatest debt is owed to my advisor, William Wheaton. He provided guidance and encouragement in many ways. Pri-marily he forced me to think rigorously and guided the thesis to completion. Richard Schmalensee greatly influenced the development of the theoretical model and suggested the use of portfolio theory.
Dan Kurtz read and commented extensively on the first four chapters. His comments are responsible for many changes and greatly improved the
pre-sentation. Four people made themselves available to discuss various aspects of the dissertation and provided valuable comments: Tee Tagert, Barry Blue-stone and David Kreesge all of the Joint Center and Millard Long of Boston University.
Several people at Data Resources provided assistance which proved to be valuable and without which the sixth chapter could not have been completed. Jill Thompson has been a friend throughout the dissertation. She provided perspective and encouragement which is most appreciated. Jill also provided computer time and training, without which the project could not have been completed. Paul Ross gave me access to the FDIC data set. Denise Harrison wrote the software used to transcribe the data. She tolerated many woeful telphone calls with good grace. I cannot thank her enough.
There are many others who have been friends throughout. Denise DiPasquale has been with me since the beginning. She has been a constant source of en-couragement and has offered help in all phases of the dissertation; she was always available as a sounding board and her advice continues to be well taken. Glynnis Trainer, Virginia Randall, Heath Paely, Maryellen Kelly, Paul Osterman, and Sandy Kanter all provided perspective and assistance in ways which cannot be properly acknowledged.
Funding for this research was provided from four sources. Initial funding was provided by the Regional Institute on Employment Policy of Boston Univer-sity. This was later supplemented by funds from a larger research project entitled: "Private Investment, Public Policy and the Transformation of Older Regions: An Analysis of the New England Economy." The project was conducted at the Joint Center for Urban Studies of the Massachusetts Institute of Tech-nology and Harvard University, grant number OER-620-G78-14 (99-7-13440). The grant was co-sponsored by the Office of Economic Analysis and Research,
Economic Development Administration, U.S. Department of Commerce; the Office of Research and Development, Employment and Training Administration, U.S. Department of Labor; and the Center for the Study of Metropolitan Problems, National Institutes of Mental Health, U.S. Department of Health and Human Services. The research was completed with the additional assistance from the Catherine Bauer Wurster Fellowship at the Joint Center for Urban Studies and computational assistance from Data Resources Incorporated. The state-ments, findings, conclusions and recommendations are solely those of the
author and they do not necessarily reflect the views of any of the sponsors. My last and greatest debt is to my family. They all were understanding and patient. It was also fortunate that my wife, Karen, was employed in the research department of a bank and was conversant in this topic. She listened to too many hours of conversation about banks and contributed directly to the
thesis. She also was supportive in ways too many to list. I was also
motivated by the memory of my sister Bridget. She accomplished a great deal in twenty-six years. She taught all who were close to her how to sacrifice to reach personal goals. We are still learning.
TABLE OF CONTENTS page ABSTRACT LIST OF TABLES LIST OF FIGURES ACKNOWLEDGEMENTS
CHAPTER 1--BUSINESS FINANCE AND ECONOMIC DEVELOPMENT 10
CHAPTER 2--FINANCIAL INTERMEDIARIES AND PRIVATE CAPITAL
FORMATION 22
A. The Size of the American Credit Market:
Sources of Demand 25
B. Financial Intermediaries: Sources of Supply 36
Life Insurance Companies 41
Credit Unions 45
Thrift Institutions: Mutual Savings Banks
and Savings and Loan Associations 46
A Note on the Commercial Paper Market 50 C. Capital Markets as a Barrier to Entry in the
Product Markets 53
D. Summary 59
CHAPTER 3--THE ROLE OF REGULATION AND THE INFLUENCE ON
COMMERCIAL BANK BEHAVIOR 65
A. Types of Commercial Banks 71
B. The Impact of Insurance Legislation 74
C. Correspondent Banks and Participation Networks 78 D. Bank Holding Companies: A Response to Regulation 79
E. Reaction to Regulation 85
CHAPTER 4--THE STRUCTURE OF THE COMMERCIAL BANKING INDUSTRY
IN THE UNITED STATES AND NEW ENGLAND 94
A. Aggregate Industry Structure 96
B. Concentration and Competition 103
C. The Asset Structure of the Industry Nationally 120 D. The Liability Structure of the Industry Nationally 126 E. Asset and Liability Holdings in New England 134
Assets 135
Liabilities 141
CHAPTER 5--A THEORY OF OLIGOPOLY BEHAVIOR IN LOCAL
BANKING MARKETS 151
A. The Demand for Bank Assets: the Opportunity Set 151
B. A Review of Portfolio Theory 153
Composition of Optimal Portfolio 160
C. The Demand Side of the Local Credit Market:
Departures from Modern Portfolio Theory 171 An Intuitive Approach to the Problem 173 D. Two Models of Bank Portfolios in the Local
Loan Market 177
The Efficiency Frontier 178
The Capital Market Lines 179
The Optimization Problem 180
Monopoly Market Model 181
Competitive Market Model 183
E. The Comparative Static Results 186
Monopoly Model 187
Competitive Model 191
Comparison of the Two Models 192
F. What Is the Relevant Market? 199
Term Structure of Liabilities 201
The Market Process 202
G. Summary 205
CHAPTER 6--AN EMPIRICAL INVESTIGATION OF BANK BEHAVIOR
IN NEW ENGLAND 211
A. Recent Literature on Commercial Bank Behavior 214
B. The Asset Allocation Models 223
C. The Bank Model 229
Empirical Results 237
D. The Market Model 241
E. Comparing the Estimating Equations Across
the Two Models 244
F. Conclusion 248
CHAPTER 7--THE BANKING INDUSTRY: PROSPECTS 259
A. Forces Promoting Structural Change 261
B. The Prospect of Interstate Branch Banking 265
C. The Future Role of Small Banks 277
APPENDIX 1 The Structure of New England's 31 Largest
Banking Organizations 285
2 Relative Composition of Assets and
Liabilities Among U.S. Commercial Banks 288 3 Definitions of the Variables Used in
the Statistical Models 289
4 The Banking Data Set Used in Chapter 6 293 5 Coefficients of Variation of the
Variables in the Market Model 295
LIST OF TABLES
Table Title Page
2.1 Funds Raised in U.S. Credit Markets in
Nonfinancial Sectors 26
2.2 Funds Raised in U.S. Credit Markets by
Nonfinancial Borrowing Sector 27
2.3 Sources of Financing for Gross Capital Expenditure
for New England Manufacturers, 1973-1977 29 2.4 Financial Structure of Manufacturing Corporations
by Asset Size: 1972-1976 Average 31
2.5 Sources of Funds for Manufacturing Corporations
by Asset Size: 1958-1971 and 1972-1976 Average 32 2.6 Distribution of Net Public and Private Debt:
1950- to 1976 35
2.7 Assets, Loans and Investments of U.S. Financial
Institutions: 1976, 1977 37
2.8 Distribution of Assets and Investments Among Seven
Large Intermediaries in the United States: 1977 38 2.9 Distribution of Financial Assets by Sector:
1950-1978 40
2.10 Distribution of Assets of U.S. Life Insurance
Companies: 1960-1978 42
2.11 Distribution of Assets of Private and State
and Local Government Pension Funds: 1960-1973 43 2.12 Credit Supply: Claims Held by Private Financial
Institutions 47
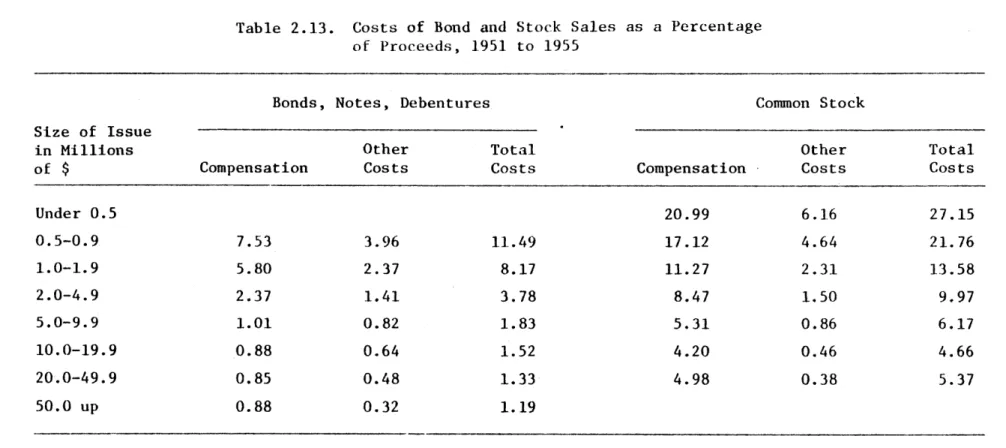
2.13 Costs of Bond and Stock Sales as a Percentage of
Proceeds, 1951-1955 51
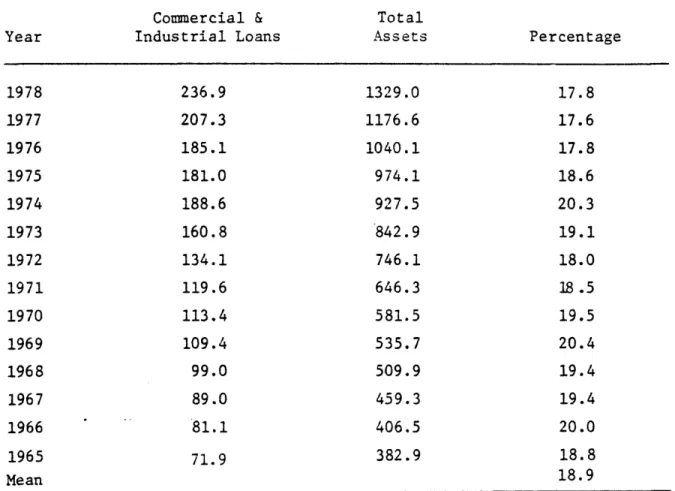
3.1 Portion of Total Bank Assets Invested in Commercial
and Industrial Loans: 1965-1978 66
3.2 Distributions of Assets of Commercial Banks 67 3.3 Three-Firm Concentration Ratios for the Banking
Industry in New England States and Banking
Market Areas: 1976 70
3.4 Commercial Banks by Class of Bank in 1970 and 1977 72 4.1 Distribution of Insured U.S. Commercial Banks
Table Title Page
4.2 Distribution of U.S. and New England Banking
Organizations with Assets Greater than $300 Million 98 4.3 Distribution of New England Banks by Asset Size 100
4.4 Bank-International Income of the Top 35 Banks 105 4.5 Assets of Largest Commercial Banks, Financial Data,
by Rank of Assets: 1960 to 1978 111
4.6 SMSA Banking Statistics for New England: 1979 112 4.7 Percent Distribution of Funds Among Domestic
Earning Assets of Member Commercial Banks in U.S. 121
4.8 Liability Structure of Commercial Banks in the U.S. 130 4.9 Composition of Domestic Purchased Liabilities
for All Federal Reserve System Banks 131
4.10 Average Net Interest Margin for U.S. Commercial
Banking Organizations by Peer Group: 1978, 1979 133 4.11 Percent Distribution of Funds Among Earning
Assets for New England Commercial Banks by State 136 4.12 Purchased Liabilities as a Percentage of Total
Liabilities for New England's Commercial Banks
by State and Membership Status 142
4.13 Average Financial Ratios for New England's Banking Organizations with Total Assets Greater
than $300 Million 143
6.1 Variables Included in the Bank Model 225 6.2 Variables Included in the Market Model 226 6.3 Bank Model: Ordinary Least Squares Regression
Results 236
6.4 Market Model: Ordinary Least Squares
TABLE OF FIGURES
Figure Title Page
5.1 The Opportunity Set 158
5.2 Utility Functions of Banks 163
5.3 The Optimal Risky Portfolio 164
5.4 From Opportunity Space to Asset Space 166
5.5 Optimal Portfolio and Asset Selection 167
5.6 The Equilibrium Local Portfolio in a Monopolized
Banking Market 190
5.7 The Equilibrium Portfolio of a Bank in a
Perfectly Competitive Local Banking Market 193 5.8 The Equilibrium Portfolio of a Bank in a Monopolized
Chapter 1
BUSINESS FINANCE AND ECONOMIC DEVELOPMENT
Popular sentiment and political action often predate academic awareness of a problem. Politicians in such an environment know that something is wrong and that they need to act. The trouble with such an environment is that the problem is often not well identified; actions are directed at the problem's symptoms and actions are most often based on the "conventional wisdom" or on the application of theories that are, at times, inappropriate, outdated, or wrong. However, politicians are often correct in their initial impression that something is amiss, and they can often recognize this fact at an earlier stage than academicians because they are not constrained by the academicians' theoretical
blinders. Since 1974 there has been an increasing amount of political activity centered around the way in which capital markets operate and
influence local economic development. The New England Regional Commis-sion sponsored a capital market task force in the mid-1970s which stud-ied the existence of a capital gap. Two New England states founded
state-wide investment banks and a raft of state-sponsored intermediaries were proposed. The federal government has proposed to greatly expand
the small business guarantee program of the Economic Development Admin-istration and a proposal for large scale reorganization of bank regula-tions was due to be released by the White House in the early fall of 1980.
Politicians are pursuing two arguments in separate areas. There is concern over the existence of a capital gap; it is felt that small to medium sized firms and new ventures are being rationed out of the market.
A separate stream of activity is based on the argument that the domestic
banking industry is over-regulated, is being put in an unfair position vis-a-vis foregin investors in terms of bank ownership and that the small saver is being hurt as a result. The impacts on the demand side are not being discussed.
The symptoms of a problem in the way in which capital markets
influence local economic development have been presented by several dif-ferent authors.1 All of these sources agree on the symptoms of the problem. All allude to the fact that capital markets are not working perfectly. By this they assert that the credit and capital market is not financing socially desirable investments -- investments that offer a stream of returns to society superior to those that are currently being funded. But they all disagree as to which components of the market are not operating in a socially efficient manner. The implica-tion is that because this higher stream of benefits would go to society as a whole and not necessarily to private investors, the latter discount
the benefits that they cannot recoup.
The "capital gap" was discovered during the recession of 1969 when venture capital began to dry up and the rate of new business start-ups
fell to historical lows.2 This was especially acute in the Northeast and in areas with older capital stock because their comparative economic advantage was assumed to rest on their capacity to generate new firms and activities.3 Accompanying the decline in venture capital was a perceived
lack of buy-out money to finance acquisitions and reinvestment in older industrial plants. James Howell, Beldon Daniels, and Lloyd Brace (they are respectively, a bank economist, an academic, and a bank consultant) agree that two of the most serious consequences of the capital gap were a contraction in the pool of longer term money for plant expansion that was
available to medium sized firms, and the difficulty that medium and small firms have had in obtaining financing for inventories and daily opera-tions that was not secured by personal assets or government guarantee. Bearce, for example, quotes from the President's 1977 Urban Report indicating that the capital market problem has important spatial conse-quences. So that "...special incentives are required in the early stages of urban redevelopment to make cities in transition competitive for new investment." A major theme of the report is that "...several aspects of the overall urban policy problem are heavily conditioned by capital flows: that is, the accumulation, mobilization and investment of capital resources in some industries, firms, and activities rather than others...."
4
Similarly, Howell notes that producers in New York City have recently been investing 9% less than their depreciation allow-ances. He states this is symptomatic of disinvestment that is occurring throughout the Northeast.These statements imply that there are three sets of problems in the way in which capital markets operate in an advanced capitalist economy.
First, there is said to be a shortage in the availability of longer term buy-out and reinvestment money. This is said to be especially true in
sectors of the economy that have slower rates of growth. Secondly, there appear to be problems in the way in which capital is allocated spatially. Inner-city areas and areas that are experiencing a transi-tion in their economic base appear to be having problems attracting capital. Thirdly, there is scattered anecdotal evidence throughout New England that smaller ventures are having trouble attracting start-up capital. The result of all of this is that declining or transitional regions (such as New England) are experiencing abnormally low levels of capital formation as a result.
Answering questions about the efficiency of regional and local finance capital markets is difficult due to the lack of data and a rigorous definition of the problem. Work that was sponsored by the New England Regional Commission has responded to the data scarcity by
5
identifying sources of demand for credit and capital. They then recommended that each source of demand deserves a sheltered window for borrowing. For example, Brace, in his study of the capital market in Maine, argued that the market lacked intermediaries which specialized in local venture capital financing. However, while it is true that he has identified potential demand for such an investment vehicle, he still has not demonstrated whether the demand is effective, i.e., demanders
can afford to pay the market price for its services if the financing were to be accessible.6
Two questions must be asked about the efficiency of local capital markets, and their impact on economic development. Are the differences in access to capital indicative of a market failure; or are they the traumatic result of a market rationing a tight supply of funds effi-ciently? Capital must be shown to have been allocated according to criteria other than price and risk for there to be a valid claim of market failure. If it is true that capital markets are structured in such a way as to systematically exclude segments of demand, we must ask who is being excluded and why is this occurring.
These are important policy questions for several reasons. Creating new capital market institutions is an expensive policy prescription and altering the market-determined flow of capital is a fundamental
intru-sion into one of the economy's two basic markets: capital and labor. One had better be able to demonstrate, at least qualitatively, that the
demand for the capital is really there. It is very important that policy analysts do not forget the fallacy of Say's Law. J. B. Say was a nineteenth century French economist who became famous for stating that supply creates its own demand and that general overproduction was
impossible. Several major depressions have proved this nineteenth century pronouncement to be incorrect. A variant of this law has been
lurking at the edges of discussions about the role that capital markets play in local economic development: that there exists a large pool of pent-up demand for finance capital being denied to economically deserving entrepreneurs. If a sheltered pool of funds were established -- it is
asserted -- viable demand for it would quickly surface.
In fact, businesses have a wide variety of intermediaries from which they can obtain external finance capital: formal and informal equity
investors, commercial banks, the commercial paper market, and other large institutional intermediaries such as insurance companies and pension funds. However, questions as to how the capital markets allocate credit, and if segments of the business community are systematically discrimi-nated against, are too broad and intractable to be answered in the
thesis. Instead a key sector of the capital market has been chosen for study, the commercial banking industry.
The commercial banking industry was chosen for two reasons. First, we know that commercial banks are the primary source of finance for small
and medium-sized businesses. The latter are usually demanding loans that are too small for other intermediaries, especially the commercial paper market and insurance companies. These banks are also connected to national credit markets and tie local markets to the larger regional and national markets. Secondly, the demand for smaller business loans is
primarily local. A survey by the Federal Reserve System indicates that over 90% of the commercial and industrial loans that are smaller than
$100,000 are placed by local commercial banks.
Before the Great Depression commercial banks, and their affiliated investment banks and insurance companies, were the only source of this type of credit. After the Second World War there was a growth in alter-native institutions which competed for the credit demands of large
corporate and industrial customers, primarily through the commercial bond and paper market.
Commercial banks participate in new capital formation either by financing mortgages or by making loans to commercial and industrial customers, which have consistently absorbed 19% of the assets of all
commercial banks during the post-war period. Two types of commercial loans are made, differentiated by their term structure. The total volume of loans is fairly evenly split between the two. The first are short-term secured loans. These are used to finance inventories and to
meet seasonal credit needs. The other type of commercial loan is a term
loan; this is a loan that is for a time period that is greater than a year, but usually less than five. These loans are made to finance
expansion plans and other longer term activities of the firm. There are few alternatives to term loans for smaller businesses. Large firms can float bonds but this is.an expensive enterprise that is only justifiable for the largest debt issues. The firm can also sell equities or take advan-tage of a capital subsidy program that is run by a state agency (such as an industrial revenue bond).
It is hypothesized that concentration in local banking markets has had, and will continue to have, a direct effect on the way in which banks
invest their asset portfolios between three types of assets. The asset classes are the risk-free asset (U.S. government issues), ubiquitous
risky assets (widely traded issues which are equally available to all banks), and local risky assets (assets which banks invest in but which
do not have well developed secondary markets). Concentration will cause banks to underinvest in local risky assets. This is especially true for
those assets without close substitutes being offered by other inter-mediaries, for example commercial and industrial loans as opposed to
consumer credit. This in turn will influence the way in which the econ-omy develops, making it harder for local firms to obtain adequate levels of finance. It is also argued that this is the outcome of normal com-petitive behavior, reinforced by the way in which the industry is
regulated. The data in the thesis are drawn from New England's commer-cial banks in December of 1977. The region was chosen for several reasons. The distribution of banks by asset size is representative of the nation as a whole. This is coupled with the diversity of economic activity in the region. New England's economy has completed the transi-tion from a declining mill-based economy to one that contains a mixed economic base with local market areas which are expanding and others which are declining.
Much is known about the American commercial banking industry in the aggregate. But little quantitative work has been completed on the inter-relationship between the structure of the industry, spatial economics and local economic development. It is easy to find general statements about the way in which the industry is organized, such as "...The
(organizational) pattern in banking is one of loose oligopoly in nation-wide credit markets and large cities, with very tight oligopoly or even
monopoly confronting individuals in smaller cities and towns..."8
But the basic description of the asset holdings of commercial banks, segmented by size and location, are not well known to those who are not industry "insiders," i.e., either those who operate the firms or regu-late the industry. Policy decisions and theoretical discussions about the performance of banking firms are being conducted with little infor-mation.
The thesis must, therefore, proceed in three directions. First the broader policy problem is discussed: what is the role of the commercial banking industry in the capital markets and in the process of local economic development. Secondly, how do commercial banks in New England compare to those in the United States as a whole and what is the com-position of their asset portfolios. Third, what is the impact of in-dustry organization and concentration in local banking markets on the asset portfolios of commercial banks; specifically does the share of a bank's total assets which are invested in local risky assets vary systematically with differences in local market structure.
The questions about local bank behavior are of interest for several reasons. There is anecdotal evidence that a capital gap exists in the finance capital markets and this will influence the way in which this economy develops. Empirical evidence which can be used to directly test the hypothesized existence of such a gap does not exist. In the thesis another approach is taken. The function of different iaries in the capital markets are examined to identify which intermed-iaries are active in the segments of the credit industry where the existence of a gap is likely to occur. Then a theoretical model is formed to discover the local credit market conditions which are likely to breed a capital gap. Then a likely data source is used to test the model.
There is a second reason for examining the impact of the structure of the banking industry at the local level. The industry is under a lot of strain. Disintermediation has been rampant and the cost of funds for banks has increased markedly. Regulators and large banks are arguing
that the spatial expansion of banking systems coupled with elimination of
inter-est rate ceilings will bring stability to the supply of funds to the industry. Foreign entities, mostly banks, are actively trying to pur-chase American banks. They are not restrained by the McFadden Act and they can cross state boundaries when they purchase banks. American money center banks are claiming that this is unfair and they should be able to cross state lines and purchase banks. The combined cry for equal treatment and concern over small savers has led to a review of banking
regulation which should result in legislation being filed in late 1981 or early 19E2. This work raises a number of issues on the demand side of the credit market which have not yet appeared in the public debate.
A third reason for undertaking the study reflects more academic concerns. The Markowitz portfolio model is an important development in the theory of finance and in the economics of uncertainty. The model is aspatial and it embodies the assumptions of a perfectly competitive market. The two models which are developed in the fifth chapter start with the Markowitz model and adapt them to markets where there is
imper-fect access to assets, that is the demander is a monopolist. This model is developed to investigate the behavior of banks in local credit
markets.
There are six chapters following this one. The second chapter describes the role of various financial intermediaries in private capital formation. This is followed by a chapter which describes the
major regulations under which the banking industry operates. The fourth chapter is a statistical comparison of the banking industry in the nation as a whole and in New England. The fifth presents two micro-economic models of bank behavior in local credit markets which are
monopolized and perfectly competitive. The sixth chapter statistically tests this model for banks in New England. The last chapter summarizes the work and speculates as to its relevance for regulatory reform in the industry.
NOTES
1. Bearse, Peter. "Influencing Capital Flows for Urban Economic
Development: Incentives or Institution Building." Journal of Regional Science. Vol. 19, No. 1, pp. 79-91.
Daniels, Beldon. "Capital Is Only Part of the Problem," in Peter Bearse, ed., Mobilizing Capital for Economic Development. Princeton, N.J.: Woodrow Wilson School for Public and International Affairs, Princeton University, August 1978.
Office of the President. Toward a National Urban Policy: The President's Urban Policy Report, 1978.
2. Howell, James. "The Northeast's Regional Economic Dilemma," in Peter J. Bearse (ed.) Mobilizing Capital for Economic Development, pp. 20-25.
3. Chinitz, Benjamin. "City and Suburb" in Benjamin Chinitz (ed.) City and Suburb: The Economics of Metropolitan Growth (Englewood Cliffs, N.J.: Prentice-Hall, 1964).
Heckman, John S. "The Future of High Technology Industry in New England: A Case Study of Computers." New England Economic Review. January/February 1980, pp. 5-17.
"The Product Cycle and New England Textiles."
Quarterly
Journal of Economics, forthcoming.Norton, R. D. City of Life-Cycles and American Urban Policy (New York: Academic Press, 1979).
Struyk, Raymond J. and Franklin J. James. Intrametropolitan Indus-trial Location (Lexington, Mass.: D.C. Heath-Lexington Press, 1975).
Vernon, Raymond. "International Investment and International Trade in the Produce Cycle." Quarterly Journal of Economics, 1966, pp. 190-207.
4. Bearse, Peter. "Influencing Capital." op. cit.
5. New England Business: Verification of Capital Gaps in New England.
(Boston: New England Regional Commission, September 1976).
6. Brace, Lloyd D. Capital Markets in Maine. Augusta, Me.: Maine State
Planning Office, June 1977.
7. The largest body of quantitative work has been generated by Heggestad
and his co-authors. They tend to focus on the impact of concentration on local market firm stability or the pricing of commercial banking services, using ordinary least squares regressions. Graddy and Kyle have recently made a major contribution to this body of work by demonstrating the necessity of using simultaneous modeling techniques in efforts to study the behavior of individual banking organizations.
Edwards, Franklin R. "Managerial Objectives in Regulated Industries. "Expense-Preference Behavior in Banking." Journal of Political Economy. February 1977, pp. 147-162.
and Arnold A. Heggestad. "Uncertainty, Market Structure, and Performance: the Galbraith-Caves Hypothesis and Managerial Motives
in Banking." Quarterly Journal of Economics. August 1973, pp. 455-473. Heggestad, Arnold A. "Market Structure, Risk, and Profitability in Commercial Banking." Journal of Finance. September 1977, pp. 1207-1216.
and John J. Mingo. "The Competitive Condition of U.S. Banking Markets and the Impact of Structural Reform." Journal of Finance. June 1977, pp. 649-661.
and Stephen A. Rhoades. "Concentration and Firm Stability in Commercial Banking." Review of Economics and Statistics. November 1976, pp. 443-452.
and . "Multi-Market Interdependence and Local Market Competition in Banking." Review of Economics and Statistics. November 1978, pp. 523-532.
Graddy, Duane B. and Reuben Kyle III. "The Simultaneity of Bank Decision-Making, Market Structure and Bank Performance." Journal of Finance. March 1979, pp. 1-18.
8. Scherer, F. M. Industrial Market Structure and Economic Performance. (Chicago: Rand McNally, 1980) p. 66.
Chapter 2
FINANCIAL INTERMEDIARIES AND PRIVATE CAPITAL FORMATION
Before we can successfully understand the ways in which the orga-nization of the commercial banking industry has influenced private capital formation and local economic development we must first examine the importance and role of the industry in the economy, and compare it to other intermediaries. The financial capital markets are unusual in
several ways. There are several industries which act as intermed-iaries in these markets. Each has a specialized function, a different set of regulators and different customers. Yet they serve
as substitutes for one another, with varying degrees of success. The capital markets also differ from other markets due to the prominent position of the intermediaries. Suppliers and demanders of the product rarely approach each other directly. Productive capital, the stock of equipment, buildings, inventory and claims on these assets are not
easily traded. In response to this fact, financial capital markets have been established where claims to physical capital can be traded. These intermediaries act on both sides of the market. Savers place their funds with a financial intermediary, which then loans them to a demander of capital. The intermediaries alternate between acting as demanders of
funds from those in surplus positions (savers) and as suppliers of funds to those in deficit positions (the end users who put the funds to use for private capital formation); this form of trading is known as arbitrage.
Finance capital markets are often confused with money investment markets, a distinction which is easier to make in theory than it is in
for investments.2 Capital markets are of a longer term nature and they exist at the local, regional, and national levels.3 A rule of thumb that is commonly used to distinguish capital markets from money markets is that the investment must have a term of at least a year. Instruments which are traded on the capital market are either debt instruments, personal mortgages, personal loans, corporate loans, corporate bonds, corporate mortgages, and government bonds or equity issues such as a stock offering. Each of these markets has two components. Newly issued securities are sold in the primary markets. Existing securities are traded among investors in the secondary markets. The bulk of the trading occurs on the secondary markets. Whereas secondary capital markets trade
long-term claims on assets, the secondary money markets trade in short-term debt instruments as well as currency. These near-money issues are not considered to be part of the market for economic, or physical, capital.
Intermediaries purchase primary securities as assets: mortgages, bonds, and loans, issued by demanders of capital, and they issue their
own securities as liabilities to savers, such as certificates of deposit, insurance contracts, and deposit accounts. The safety and liquidity of the intermediaries' liabilities allow them to charge a higher price or
lower interest rate than they receive from their asset portfolio. The intermediaries also sell packages of securities on the secondary markets to maintain their liquidity and to balance the term structure of their portfolios. They generally attempt to manage their assets and liabilities
so that they come due at the same time. This is the principle of "hedging." In theory when an asset reaches maturity it is used to pay off corresponding liabilities. Financial intermediaries which operate
in the capital market have asset portfolios which are made up of longer-term debt and equity issues,.such-as loana, bonds, and mortgages and more liquid assets, such as government securities. Intermediaries mix
these assets to construct a portfolio which meets profit targets that are established by the firm, subject to constraints (especially in the banking industry) imposed by regulators as to the amount of risk that is
4
contained in the portfolio. The portfolio of the intermediary is
constrained by the term structure of the intermediary's liabilities, the degree of risk-taking that is allowed by regulatory agencies, and the competitive structure of the particular market in which the intermediary is operating.
There are three groups of non-economic variables which influence the behavior of financial intermediaries. These include the rules and regulations which governmental bodies impose on the industry and rules of thumb which have developed over the years to guide the way in which the portfolios of the intermediary are managed. The latter may have developed in response to economic factors but the impact of their exis-tence must be examined. The last set is the impact of industry structure. This is the number and size distribution of firms in the industry, the markets which it operates in, and its spatial organization. These factors combined with the different types of investment markets in which the inter-mediaries are active are used to describe the functions of the different
institutions that operate in the American credit market. They are the measures which are used to identify the commercial banking industry as the
intermediary of special importance to small and medium-sized business and, through these firms, to local economic development.
A. The Size of the American Credit Market: Sources of Demand
In 1977, $340.5 billion was raised in the U.S. credit markets, of which $271.4 billion was absorbed by the private nonfinancial sector
(see Tables 2.1 and 2.2). Of this amount, $35 billion was invested in consumer credit and is not counted as part of gross capital formation. Of the remaining $236.4 billion, almost 44 percent, or $103.8 billion, was invested in residential structures and $4.7 billion of the $29.2 billion issued by state and local governments was issued as industrial revenue bonds. The non-farm corporate sector of the economy absorbed $96 billion on the credit market in 1977, or about 35 percent of the total issue of credit.
Other data indicate that the corporate sector of the economy spent $135.8 billion on plant and equipment alone, and that business inven-tories increased by $15.5 billion dollars,5 all of which had to be
financed. These figures indicate that at a minimum the nonfarm sector of the economy had to finance $151.3 billion worth of expenditures in 1977
from internal and external sources. The credit markets supplied the funds which corporations had to raise externally. In so doing they met 63% of the effective demand for capital from domestic corporations. The remainder of the demand was financed internally from two sources, un-distributed profits and capital consumption allowances. Corporations had a net cash flow of $164.4 billion in 1977, $58.4 billion in undistributed profits and $106 billion in capital consumption allowances.
Data from the Federal Reserve System indicate that the nonfarm, non-financial, corporate sector of the economy generated 62 percent of its funds externally. These funds were used for all purposes, not just cap-ital formation, and accounted for $121.1 billion out of the $257.5 billion
Table 2.1. Funds Raised in U.S. Credit Markets Sectors (Billions of Dollars)
in Nonfinancial
1977 1978
Total funds raised Excluding equities U.S. Government
All other nonfinancial sectors Corporate equities
Debt instruments Foreign
Private domestic nonfinancial sectors Corporate equities
Debt instruments
Debt capital instruments
State and local obligations Corporate bonds Mortgages Home Multifamily Commercial Farm
Other debt instruments Consumer credit Bank loans n.e.c. Open market paper Other
SOURCE: "Funds Raised in U.S. Credit Markets." Reserve Bulletin (May, 1979).
340.5 337.4 56.8 283.8 3.1 280.6 12.3 271.4 2.7 268.7 181.1 29.2 21.0 131.0 96.4 7.4 18.4 8.8 87.6 35.0 30.6 2.9 19.0 389.4 387.4 53.7 335.8 2.1 337.1 25.7 310.1 2.6 307.5 194.8 29.6 20.1 101.4 10.1 23.1 10.3 112.7 50.5 37.1 4.9 20.2 Table 1.57. Federal
Table 2.2. Funds Raised in U.S. Credit Markets by Nonfinancial Borrowing Sector (Billions of Dollars)
1977 1978
Private domestic nonfinancial sectors 271.4 310.1
State and Local Governments 25.9 24.9
Households 139.1 161.3
Farm 14.7 17.2
Nonfarm corporate 12.6 17.2
Corporate 78.7 89.5
SOURCE: "Funds Raised in U.S. Credit Markets." Table 1.57. Federal Reserve Bulletin (May, 1979).
raised. Slightly more than 20 percent came from undistributed corporate profits which are usually called retained earnings.6 These shares are typical of all of the recent years except 1975, when external sources of
funds were not heavily used.
In New England most financing in manufacturing takes place through internal sources; either through retained earnings or from funds provided by a parent firm's capital budget (see Table 2.3). The amount of internal
financing has fluctuated since 1963, depending on money market conditions, but it has always been above 67 percent, and it has been as high as 85
percent. Loan financing, from commercial banks, is the second most pop-ular debt instrument accounting for approximately 10 percent of gross capital expenditure. Stock sales and lease financing play a clearly subordinate role to the other two vehicles. The reason for the depen-dence on internal financing by firms in New England is not entirely clear. However it does appear that this dependence is due to several
causes. First, the average size of manufacturing establishments in the region is smaller than the average size nationally. Size of firm is correlated with market power and stability of earnings, therefore the smaller firm size would lead one to believe that investments to firms in New England are on average riskier. The second reason for the region's dependence on internally generated funds is the product mix of
manu-facturing firms in the region. There are generically two types of
manufacturing industries in the region. The first is declining in
importance. These are the old, mill based industries, which appear to have largely lost their comparative advantage to importers and have seen waves of bankruptcies during the past two decades. Needless to say,
these firms are not the most desirable investment risks. The second type of manufacturing firm is the eralded high technology firm. These firms
Table 2.3. Sources of Financing for Gross Capital Expenditure
for New England Manufacturers, 1973 to 1977
1973 1974 1975 1976 1977
Percent Financed internally
Durable Goods
LOW 12.1 (instrumeto) 39.1 (mise.) 51.7 (lumber) 49.4 (instruments) 19.9 (inscruments)
High 96.8 (elec. equip) 94.9 (clay. etc.) 95.2 (alec. mach) 94.1 (pria. ets.) 88.7 (clay, etc.)
Mean 75.6 67.9 4.7 85.0 68.4
Noodurables
Low 62.0 (misc.) 46.3 (chemicals) 73.7 (textiles) 65.0 (misc.) 64.8 (misc.) High 98.9 (pulp) 94.2 (food) 87.1 (food) 92.4 (food) 96.0 (food)
Mean 83.3 74.7 80.0 74.8 80.6
Total Mfg. 79.5 70.2 83.4 80.1 74.5
Percent Financed
by Loans
Durable Goods
LoW 0.3 (pria. mets.) 2.0 (prim. mets.) 0.5 (clay, etc.) 3.3 (fab. mts.) 1.6 (instruments)
High 24.7 (instruments) 51.0 (misc.) 40.6 (lumber) 49.4 (instruments) 49.0 (prim. mats.)
MOan 9.1 23.3 9.0 11.1 17.9
Nondurables
Law 1.1 (pulp) 2.2 (food) 0.4 (chemicala) 11.6 (misc.) 2.0 (food ign 17.2 (textilas) 46.4 (cheaicals) 23.7 (textiles) 26.2 (textiles) 31.2 (textiles)
Mean 8.6 19.2 7.7 13.0 15.5
Total Kfg. 8.8 21.9 8.7 12.0 16.7
Percent Financed
by Stock Durable Goods
LoW 0.3 (elec. each)
High 5.9 (clay. etc.)
Mean 0.2* 1.2* 0.6
Nondurables
LOW 2.6 (chebicale 13.2 (muac.)
High 13.1 (aisc.) 20.4 (chmcals)
Mean 0.40 3.9 9.5
Total Mfg. 0.3 2.1 3.0
Percent Financed
by Lease
Durable Goods
Law 1.3 (pria. mte.) 0.3 (instruments) 0.3 (clay. etc.) 0.6 (Wlee. each) 2.7 (trans. equip)
High 39.0 (fab. mts.) 14.5 (lmber) 11.4 (feb. mets.) 38.2 (furniture) 16.6 (furniture)
Mean 6.2 4.0 3.4 2.5 3.2
Nondurables
LOW 0.8 (textiles) 0.7 (alec.) 0.7 (aise.) 2.6 (textiles)
High 7.7 (aisc.) 4.7 (chmica") 5.6 (food) U.6 (misc.)
Man 6.2 2.2 2.2 6.1 2.0*
Total Mfg. 3.9 3.4 3.1 4.2 2.6
SOURCZ: Research Dparrment; First National Bank of goston, Capital Expenditure Survey of New England Vanufacturers. Sample sise 275 in 1974, 400 ie 1975.
* one industry reporting.
AMTE: Totals for "Total Manocturing" do sot ad up to 1.00 due to existence of a "=isca.LaneOuS" finance
category.
attract external finance but they still rely heavily on re-tained earnings.7
Table 2.3 shows the variation in financing by industrial sector for manufacturing firms in New England. Durable goods industries tend to
use external finance to a greater extent than nondurable manufacturers;
but both generate more than 70% of their financing for capital
expendi-tures internally. Durable goods producers tend to make greater use of loans.8
Data for New England are compared with data on the financial struc-ture of manufacturing firms for the United States from the Federal Trade Commission in Tables 2.4 and 2.5; these data have the advantage of being categorized by the size of the firm's assets. The FTC data are for all
sources of funds; they are not restricted to funds used for capital expenditures. Retained earnings dominate these figures comprising 45 percent of all funds used by manufacturers from 1972 to 1976.
Short-term and long-Short-term liabilities, excepting bank loans, make up the next largest category. This reflects the fact that large corporations are on net paying back short-term bank loans resulting in a negative cash flow from this source. It is interesting to note that these are firms that are larger than $25 million in assets. Firms with assets of $1 to $10 million rely most heavily on short-term bank loans; they have not shifted out of this area of borrowing to other instruments, as firms in the $25 million to $1 billion classes have done in wholesale fashion. Long-term bank loans are crucial to firms with assets under $1 million and firms in the $25 to $100 million class. The debt of the smallest manufacturing firms is often secured by a government guarantee, the real property of the firm, or the assets of the entrepreneur. This can be contrasted to
Financial Structure of Manufacturing Corporations by Ass.et Size:
1972-1976 Average (Size in $ Million, Figures in Percent)
5-10 10-25 25-50 50-100 100-250 250-1000 >1000 Retained Earnings/ Total Fin. Equity Capital Stock/Total Fin. Other S.T. Liab./ Total Financing Trade Debt/ Total Fin. S.T. Bank Loans/ Total Fin. L.T. Bank Loans/ Total Fin. Otier L.T. Liab./ Total Fin. Equity/Debt 37.06 29.96 34.65 39.01 36.74 33.09 34.48 33.70 34.88 39.50 16.33 17.01 14.67 14.84 17.28 18.67 18.31 17.96 16.94 15.72 12.63 12.42 11.93 11.42 11.27 11.42 11.30 11.82 12.97 13.06 8.38 16.95 15.35 12.63 11.00 9.70 8.49 3.31 5.78 7.36 7.11 6.66 6.17 5.35 4.02 6.84 6.01 5.52 6.50 7.09 6.59 7.96 4.63 5.75 7.40 3.38 4.92 6.84 1.68 2.37 18.27 11.03 10.02 9.46 10.54 13.85 15.47 18.18 19.51 20.82 2.34 1.78 1.96 2/34 2.28 1.94 2.03 1.95 2.10 2.73
SOURCE: Quarterly Financial Reports of the
and Michael Kieschnick, Theory and Practice
Federal Trade Commiss ion, 1972-1976. from: Beldon Daniels in the Design of Development Finance Innovation, Cambridge, Mass.: Harvard University, Department of City and Regional Planning, 1978. p. 34.
S.T. refers to short term. L.T. refers to long term
Size All < 1 1-5
Sources of Funds for Manufacturing Corporations by Asset Size: 1958-1971
and 1972-1976 Averages (Size in $ Millions, Figures in Percent)
5-10 10-25 25-50 50-100 100-250 250-1000 1000 Retained Earnings 58-71 72-76 External Equity Capital Stock 58-71 72-76
Other Short Term Liabilities 58-51 72-76 Trade Debt 58-71 72-76 Short-Term Bank Loans 50-71 72-76 Long-Term Bank Loans 58-71 72-76 34.05 29.75 30.23 30.24 19.19 19.22 19.23 32.50 34.18 35.83 45.50 48.87 32.55 34.22 38.47 44.50 47.29 42.50 40.42 49.18 12.19 5.13 2.53 7.40 6.70 11.30 8.17 8.47 -5.78 7.56 5.25 6.39 4.20 -3.07 12.95 13.49 11.39 9.75 7.93 12.16 11.25 16.22 19.63 16.70 18.13 17.44 15.26 17.41 8.34 16.56 20.90 18.38 18.29 13.58 11.00 8.29 11.23 18.11 16.25 13.66 12.94 12.39 5.28 7.33 8.21 10.50 11.66 9.86 -2.87 1.59 7.86 7.75 4.33 -1.30 9.28 .71. 4.80 11.03 8.75 8.78 12.59 10.60 10.65 3.93 22.27 9.21 8.12 11.25 13.17 12.76 9.84 8.04 9.86 11.00 14.09 9.53 9.76 13.31 13.50 24.17 17.58 14.89 9.50 8.89 8.25 -7.79 8.64 5.45 7.57 8.38 6.63 -8.57 6.26 6.67 6.84 5.96 3.93 -3.85 3.01 .62 Other Long Term
Liabilities
58-71 22.39 16.75 18.00 14.94 23.64 23.28 30.40 21.51 22.18 22.79
72-76 20.46 2.19 8.01 10.29 8.46 11.23 12.52 18.73 24.52 23.67
SOURCE: Beldon Daniels and Michael Kieschnick. Theory and Practice in t
Finance Innovation, Cambridge, Mass.: Harvard University, Department of 1978. p. 88.
he Design of Development
City and Regional Planning,
All 1 1-5
loans that are made to larger corporations, which do not quite have the financial moxie to break into the national short-term commercial paper markets, which are secured on the expected cash flow of the firm.
The data indicate that manufacturing firms have three different ways of raising funds, which vary according to their size. In the first stage firms are small, with assets that are less than $10 million. Equity capital as a percentage of total financing is below average, resulting
in a low equity to debt ratio. Firms rely heavily on trade debt and bank loans for their financing. Manufacturing firms have a more stable finan-cial profile in the second stage, assets ranging from $10 to $25 million. The equity to debt ratio is near the mean, as firms begin to substitute
away from trade debt and short-term bank loans. Once the firm gets bigger it acquires more long-term debt, us.ing the commercial paper market more heavily. This is especially true for firms with more than $50 million in
assets.
Financial structure, as depicted in Table 2.4, is in some sense a picture of the average indebtedness of firms. Table 2.5 shows where funds were raised each year. As inflation began to accelerate in 1972 a major
shift appeared in the sources of funds. Reliance on retained earnings became much more pronounced, especially among the smallest and the very largest firms. There were two major differences in the way in which firms reacted to the cyclical contraction in the credit markets and increases in nominal interest rates. All firms relied more heavily on retained earnings. The largest firms substituted financing from retained earnings for short-term debt (in net terms they were paying banks back thereby becoming negative borrowers). They also moved from long-term bank debt to other sources of long-term finance. Smaller firms also used retained
earnings as substitutes for short-term bank debt. But they were still borrowing money. They were not able to replace banks for long-term
financing. In fact, they borrowed more heavily from this source. Small firms used their retained earnings most often to replace other forms of long-term liabilities.
Smaller firms are using retained earnings to finance their expansion. This category includes firms with less than $50 million in assets. The smallest of these are totally reliant on local sources of finance to meet their demand for external finance; if they are to expand, the funds must be raised internally from profits or from the commercial banking industry.
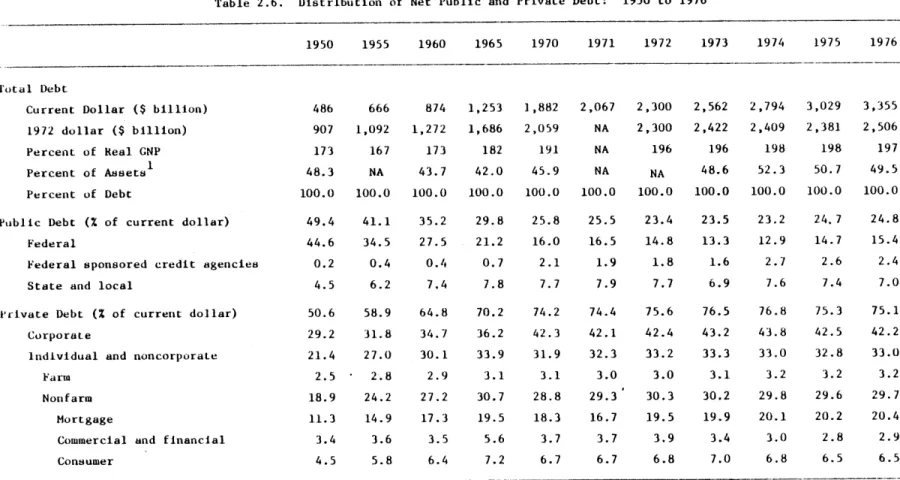
During the postwar period total debt in the United States has been a fairly constant portion of total assets; this figure has ranged from 42 percent in 1965 to 52 percent in 1974 with the average being 47.6 per-cent (see Table 2.6). The distribution of the source of debt has changed during the postwar period. Since 1960 public holdings of the debt have declined by 10.4 percent while the corporate share has increased by 7 percent. The share of debt held in mortgages accounts for most of
remain-ing reallocation. Corporations account for 42 percent of all debt in the United States, mortgage debt accounts for another 20 percent, while
governmental debt is 22 percent of the total. The only sector of publicly held debt that has increased appreciably over the past two decades is that issued by federally sponsored credit agencies, which now account for 2.4 percent of total debt.9
It is clear that commercial debt dominates the financial capital markets and that these are the investments that influence the development of a region's economy. It is also clear that not all firms have equal access to all of the markets, probably due to the relationship between
Table 2.6. Distribution of Net Public and Private Debt:
1950 1955 1960 1965 1970 1971 1972 1973 1974 1975 1976
Total Debt
Current Dollar ($ billion) 486 666 874 1,253 1,882 2,067 2,300 2,562 2,794 3,029 3,355
1972 dollar ($ billion) 907 1,092 1,272 1,686 2,059 NA 2,300 2,422 2,409 2,381 2,506
Percent of Real GNP 173 167 173 182 191 NA 196 196 198 198 197
Percent of Assets1 48.3 NA 43.7 42.0 45.9 NA NA 48.6 52.3 50.7 49.5
Percent of Debt 100.0 100.0 100.0 100.0 100.0 100.0 100.0 100.0 100.0 100.0 100.0
Public Debt (% of current dollar) 49.4 41.1 35.2 29.8 25.8 25.5 23.4 23.5 23.2 24.7 24.8
Federal 44.6 34.5 27.5 21.2 16.0 16.5 14.8 13.3 12.9 14.7 15.4
Federal sponsored credit agencies 0.2 0.4 0.4 0.7 2.1 1.9 1.8 1.6 2.7 2.6 2.4
State and local 4.5 6.2 7.4 7.8 7.7 7.9 7.7 6.9 7.6 7.4 7.0
Private Debt (% of current dollar) 50.6 58.9 64.8 70.2 74.2 74.4 75.6 76.5 76.8 75.3 75.1
Corporate 29.2 31.8 34.7 36.2 42.3 42.1 42.4 43.2 43.8 42.5 42.2
1ndividual and noncorporate 21.4 27.0 30.1 33.9 31.9 32.3 33.2 33.3 33.0 32.8 33.0
Farm 2.5 2.8 2.9 3.1 3.1 3.0 3.0 3.1 3.2 3.2 3.2
Nonfarm 18.9 24.2 27.2 30.7 28.8 29.3 30.3 30.2 29.8 29.6 29.7
Mortgage 11.3 14.9 17.3 19.5 18.3 16.7 19.5 19.9 20.1 20.2 20.4
Commercial and financial 3.4 3.6 3.5 5.6 3.7 3.7 3.9 3.4 3.0 2.8 2.9
Consumer 4.5 5.8 6.4 7.2 6.7 6.7 6.8 7.0 6.8 6.5 6.5
SOURCE: Table No. 881 "Net Public and Private Debt: 1950 to 1977." Statistical Abstract of the United States. 1978.
Various tables: Economic Report iof the President.
1. Asset Data from Table 2.9
N.A. Not available
the asset size of the firm, the volume of credit demanded and the
transactions costs that are involved in placing a loan. It also appears that firms with less than $50 million in assets are particularly depen-dent on the commercial banking industry for funds which are raised externally.
-B. Financial Intermediaries: Sources of Supply
There are a large number of institutions which serve as intermed-iaries in the finance capital market. Each institution serves a differ-ent type of saver: households, corporations, or some mix of the two.
They also specialize in serving different areas of credit demand, some portion of which is used in capital formation. These intermediaries are
in varying degrees substitutes for each other. They overlap on both sides of the money market. But they are often prevented from directly competing for the same set of customers by regulation, tax laws, or the way in which the specific industry is organized.
Several non-bank intermediaries are examined below to determine their role in local economic development. This is done by examining who has access to these intermediaries, how they are regulated and how their funds are put to use.10
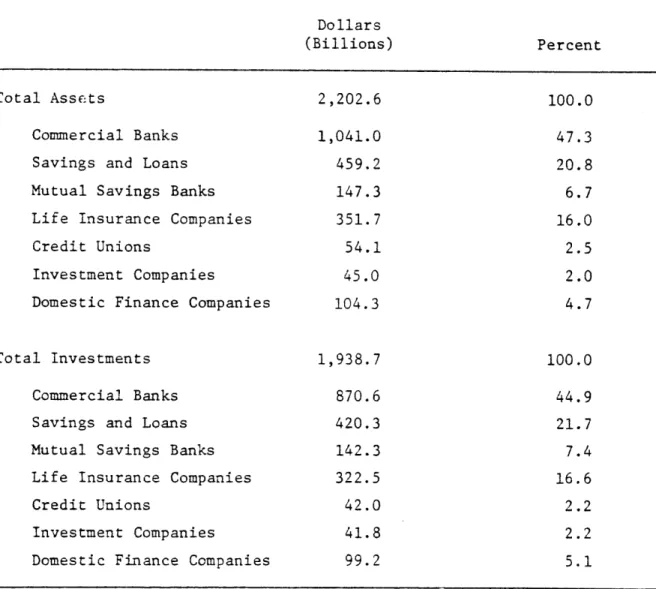
Tables 2.7 and 2.8 list the assets and investments of seven major intermediaries. Pension funds, property and liability insurance companies and real estate trusts are not listed in these tables. They are important intermediaries, but together they have only half the assets of commercial
banks (see Table 2.8). Commercial banks are clearly the largest set of
intermediaries with 47 percent of the total assets of all seven intermed-iaries. Their asset base and investments are twice that of any other
Table 2.7. Assets, Loans and Investments of U.S. Financial Institutions: 1976, 1977 (Billions of Dollars)
1976 1977
Commercial Banks: Assets 1,004 1,041
Total Loans, Investments 785.1 870.6
Loans 538.9 617.0 Commercial, Industrial 179.7 201.4 Other 359.2 415.6 Investments 246.2 253.6 U.S. Treasury 98.0 95.6 Other 148.2 158.0
Savings and Loan: Assets 391.9 459.2
Total Loans, Investments 358.7 420.3
Mortgages 323.0 381.2
Cash, Investment Securities 35.7 39.1
Mutual Savings Banks: Assets 134.8 147.3
Total Loans, Investments 133.4 142.3
Loans 86.8 94.4
Mortgages 81.6 88.2
Other 5.2 6.2
Securities 46.6 47.9
U.S. Government 5.9 5.3
State and Local 2.8 3.0
Other 37.9 39.6
Life Insurance Companies: Assets 321.6 351.7
Total (less foreign 296.4 322.4
securities) Mortgages 92.0 96.8 Real Estate 10.5 11.1 Policy Loans 25.8 27.6 Securities 175.1 195.2 U.S. Government 5.4 5.3
State and Local 5.6 6.0
Foreign Government 7.0 8.2
Business Bonds 123.0 141.9
Business Stocks 34.3 33.8
Credit Unions: Assets 45.2 54.1
Loans 34.2 42.0
Investment Companies: Assets 45.0
Cash 3.3
Other 41.8
Domestic Finance Companies: Assets 89.2 104.3
Accounts Receivable 83.4 99.2
Consumer 38.6 44.0
Business 44.7 55.2
SOURCE: Federal Reserve Bulletin. May, 1979. Vol. 65. No. 5. Table 1.23: "Loans and Investments, All Commercial Banks"; Table 1.38: "Savings Institutions, Selected Assets and Liabilities"; Table 1.521: "Domestic Finance Companies, Assets and Liabilities"; Table 1.522: "Domestic Finance Comapnies, Business Credit": Table 1.49: "Open-end Investment Companies."