HAL Id: inria-00374455
https://hal.inria.fr/inria-00374455
Submitted on 8 Apr 2009
HAL is a multi-disciplinary open access
archive for the deposit and dissemination of
sci-entific research documents, whether they are
pub-lished or not. The documents may come from
teaching and research institutions in France or
abroad, or from public or private research centers.
L’archive ouverte pluridisciplinaire HAL, est
destinée au dépôt et à la diffusion de documents
scientifiques de niveau recherche, publiés ou non,
émanant des établissements d’enseignement et de
recherche français ou étrangers, des laboratoires
publics ou privés.
Cycles in hypergraph-based networks: signal or noise,
artefacts or processes?
Lionel Tabourier, Jean-Philippe Cointet, Camille Roth
To cite this version:
Lionel Tabourier, Jean-Philippe Cointet, Camille Roth. Cycles in hypergraph-based networks: signal
or noise, artefacts or processes?. 10ème Rencontres Francophones sur les Aspects Algorithmiques des
Télécommunications (AlgoTel’08), 2008, Saint-Malo, France. pp.53-56. �inria-00374455�
Cycles in hypergraph-based networks: signal
or noise, artefacts or processes?
Lionel Tabourier
1
, Jean-Philippe Cointet
2
and Camille Roth
3
1SPEC, CEA, 91191 Gif-sur-Yvette,lionel.tabourier@cea.fr
2CREA, CNRS/Ecole Polytechnique, 1 rue Descartes, 75005 Paris,cointet@poly.polytechnique.fr
3LEREPS (U. Toulouse, 21 alle de Brienne, Toulouse) & CAMS (EHESS/CNRS, Paris),camille.roth@polytechnique.edu
Les r´eseaux `a structure de groupe sous-jacente induisent m´ecaniquement la cr´eation de cycles: chaque groupe peut ˆetre interpr´et´e comme un hyperlien connectant l’ensemble de ses noeuds les uns avec les autres, soit l’ajout d’une clique dans le r´eseau monoparti projet´e. Nous nous int´eresserons ici `a l’origine des cycles de tailles n (3 ≤ n ≤ 5) associ´es `a des coefficients de clustering g´en´eralis´es jusqu’`a l’ordre 5 (c3, c4 et c5) dans des r´eseaux `a structure de groupe
(ou d’hypergraphe) sous-jacente. Ces param`etres topologiques peuvent-ils ˆetre expliqu´es uniquement par le processus sp´ecifique de g´en´eration `a base d’hyperliens, ou d’autres processus doivent-ils ˆetre invoqu´es? Nous mesurons ainsi ces motifs cycliques sur un ensemble de r´eseaux r´eels et distinguons deux cat´egories de cycles — “structurels” ou “s´equentiels” — dont on ´evalue la part respective en fonction du type de r´eseau et de n, puis nous estimons la quantit´e de chaque type de motif obtenue `a partir de diff´erents mod`eles al´eatoires de r´eseaux `a base d’hypergraphes, en nous appuyant sur le cadre formel r´ecemment introduit par Mahadevan [MKFV06]. Nous nous en inspirons pour proposer un mod`ele original `a mˆeme de reconstruire l’ensemble des motifs sur l’ensemble des graphes r´eels ´etudi´es.
Keywords: r´eseau biparti, clustering, cycles, mod`eles de reconstruction, r´eseaux r´eels.
Introduction
We focus on networks featuring an underlying group structure, a.k.a. group-based or event-based networks. Affiliation networks, for instance, are such networks: nodes are affiliated with groups (or events), and the corresponding graph is such that links appear between all nodes belonging to a same group (or event). These networks may simply be described either (i) as the monopartite projection of a bipartite graph, where nodes on one side are linked to groups/affiliations on the other side, or (ii) as the projection of a hypergraph where hyperlinks gather nodes belonging to a same group or event.
As such, a group or event induces a clique in the resulting graph. Its structural properties are plausi-bly influenced by this phenomenon: as a first effect, cliques of size 3 and more automatically inflate the number of cycles of size 3, or “triangles” — in other words, the presence of clustering is likely to be signif-icantly influenced by the group-based nature of the network [NSW02]. It seems reasonable to expect that cycles of any length, in general, may simply be due to clique-generation processes, at least in a large part. More broadly, this process may also be responsible for numerous other patterns of interest, as suggested in [MIK+04] — such exhaustivity, however, is beyond the scope of the present paper, and we address the fol-lowing simple question: to what extent the cyclic structure observed in these networks could be explained by the underlying hypergraph structure?
This issue is strongly similar to the measure of clustering coefficients in graphs. In the remainder, we distinguish the monopartite graph and its underlying hypergraph, the former being the projected graph of the latter; and we define clustering as the normalized ratio between the number of triangles N△ and the
number of connected triples N∧in the monopartite graph, i.e.: c3= 3.N△
N∧ . This definition can be generalized
to longer cycles: we thus note c4= 4.N♦
N⊓ , c5= 5.ND
N∧∧, etc. More generally we define the n-order clustering
coefficient cnas the ratio between the number of cycles of length n, and n times the number of broken cycles
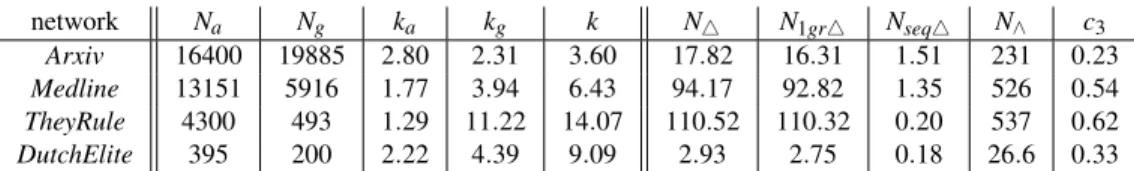
Lionel Tabourier, Jean-Philippe Cointet and Camille Roth network Na Ng ka kg k N△ N1gr△ Nseq△ N∧ c3 Arxiv 16400 19885 2.80 2.31 3.60 17.82 16.31 1.51 231 0.23 Medline 13151 5916 1.77 3.94 6.43 94.17 92.82 1.35 526 0.54 TheyRule 4300 493 1.29 11.22 14.07 110.52 110.32 0.20 537 0.62 DutchElite 395 200 2.22 4.39 9.09 2.93 2.75 0.18 26.6 0.33 Table 1: For each network, number of actors Na, number of groups Ng, avg. number of groups per actor ka, avg. size
of groups kg, average degree k in the resulting monopartite graph — number of thousands of triangles N∆, of triangles
due to a unique event N1gr∆or to several events Nseq∆; number of thousands of forks N∧and clustering coefficient c3.
Measures on real networks
Empirical datasets. We use four networks in our empirical evaluation†. Two are collaboration networks, featuring scientists coauthoring papers (i.e. groups are paper authors): Arxiv, extracted from preprints on the “arXiv cond-mat” database; and Medline, extracted from the “Pubmed” bibliographic archive, using the specific keyword “biomedicine”. Two are interlock networks, produced by linking individuals belonging to the same board (i.e. groups are boards): TheyRule features the collection of U.S. top companies boards;
DutchElitegathers affiliations of officials in the main national institutions of the Netherlands. Their basic features are given in Tab. 1.
Structural vs. sequential cycles. Hypergraph-based networks seem to be ubiquitous whenever social mechanisms are at work; in such networks indeed, groups (or events) gather agents thus induce cliques. Cycles in the monopartite graph may thus partly be a mechanical feature, in the sense that it is merely caused by the construction of the monopartite graph from an underlying hypergraph.
Nevertheless, non-mechanical processes may also account for the presence of cycles: for example in the case of 3-sized cycles, or triangles, A interacts with B in a group, B interacts with C in another group, and then A interacts with C in a later group — this is usually called “transitivity”. In this set-ting, we thus distinguish two kinds of triangles in the monopartite graph. On one hand, “single-group” or “structural” triangles (N1gr△) result (at least) from
one single group gathering 3 nodes (or more) at
once. On the other hand, “sequential triangles” (Nseq△) are created by a sequence of 3 events, none
of them involving the entire triple of nodes (Fig. 1).‡
A C B C C B A B A A C B + +
Figure 1: A triangle in the monopartite graph can arise from two kinds of configurations in the underlying hyper-graph: on top, single-group triangle; at the bottom, se-quential triangle made of three different groups.
In real networks, triangles are massively due to groups (Tab. 1): triangles stemming from a triad of groups are generally rare, and thus structural triangles are responsible for most of the clustering.
The notion of structural or sequential triangles can easily be extended to longer cycles: we may measure the number of diamonds or pentagons (cycles of length 4 or 5) produced by a single group and define sequential diamonds or pentagons as any cycle (of length 4 or 5) which is not based on a unique grouping. Contrary to triangles, results in Tab. 2 show that in most cases the proportion of higher-length sequential cycles is not negligible anymore — their presence may therefore not be explained only by the underlying clique aggregation process, i.e. by the fact that the monopartite graph is based on a hypergraph.
Morphogenesis models
Trivial underlying hypergraph. Since most triangles are structural, it seems plausible that a network model mimicking just the underlying hypergraph structure would lead to the same c3clustering coefficient. † Data available on, respectively: http://www.arxiv.org, http://www.ncbi.nlm.nih.gov/sites/entrez, http://www.theyrule.net,
http://vlado.fmf.uni-lj.si/pub/networks/data/2mode/DutchElite.
‡Here, triangles corresponding to both a single group and a sequence of groups are thus counted, by definition, as “structural”, not “sequential”, triangles (“there is at least one group involving the entire triple”). Empirically, this mixed case is negligibly rare.
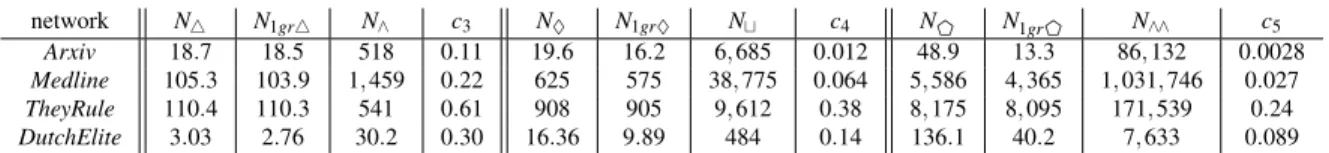
network N♦ N1gr♦ Nseq♦ N⊔ c4 ND N1grD NseqD N∧∧ c5
Arxiv 43.5 15.4 28.1 2,060 0.084 159.8 13.0 146.8 20,347 0.039 Medline 717 545 172 7,265 0.39 7,091 4,260 2,831 114,280 0.31 TheyRule 930.8 904.5 26.3 10,374 0.36 8,698 8,095 603 194,680 0.22 DutchElite 14.86 9.89 4.97 375 0.16 103.9 40.2 63.7 5,274 0.10 Table 2: For each network, number of thousands of: diamonds (resp. pentagons) N♦(ND), diamonds (resp. pentagons)
due to a unique event N1gr♦(N1grD) or to several events Nseq♦(NseqD); and broken diamonds (resp. broken pentagons) N⊔(N∧∧) along with the clustering coefficient c4(resp. c5).
Some authors indeed already suggested [NSW02, GL04] that this very feature could be reconstructed by a traditional null-model of bipartite graph (or hypergraph), the Molloy-Reed (MR) model [MR95]. MR generates a random bipartite graph with the same connectivity distributions from one side to the other side of the bipartite graph — in other words, MR generates a hypergraph made of as many hyperlinks of a given size as in the original hypergraph, with nodes belonging to as many hyperlinks as well.
In order to assess how a trivial underlying hypergraph structure may account for the monopartite topo-logical features, we therefore first perform simple MR reconstructions of our 4 empirical cases — in other words, we thus preserve the degree distribution of nodes to groups and the size distribution of groups. Ta-ble 3 gathers results concerning both structural and sequential length n cycles (for n= 3,4,5) on 20 distinct MR realizations, to be compared to original graph values (NB: all simulation results in this paper have standard deviations within 5%of the presented values).
network N△ N1gr△ N∧ c3 N♦ N1gr♦ N⊔ c4 ND N1grD N∧∧ c5
Arxiv 18.7 18.5 518 0.11 19.6 16.2 6,685 0.012 48.9 13.3 86,132 0.0028
Medline 105.3 103.9 1,459 0.22 625 575 38,775 0.064 5,586 4,365 1,031,746 0.027
TheyRule 110.4 110.3 541 0.61 908 905 9,612 0.38 8,175 8,095 171,539 0.24
DutchElite 3.03 2.76 30.2 0.30 16.36 9.89 484 0.14 136.1 40.2 7,633 0.089
Table 3: For each MR-reconstructed network, number of thousands of (i) 3-node patterns: total triangles (N△) and
triangles coming from a unique group (N1gr△), broken triangles, or forks (N∧) and clustering coefficient c3; (ii) 4-node
patterns (N♦, N1gr♦, N⊔) and c4; and (iii) 5-node patterns (ND, N1grD, N∧∧) and c5.
Because structural triangles, diamonds and pentagons are directly induced by groups (which size distri-bution is the same as in the original network), these values are unsurprisingly acceptably reconstructed by MR graphs. The story is much different for sequential cycles, and two classes of networks are exhibited. Interlock networks, on one hand, display acceptable fits for cycles, and broken cycles as well, (in the vicin-ity of 10% around the empirical value), consistently with partial previous research [RA04]; in this case, these features are plausibly an artefact of the underlying hypergraph structure. Collaboration networks, on the other hand, are not properly reconstructed by a simple hypergraph structure: be it either (i) for cy-cles of length n ≥ 4,often under-estimated by MR-graphs, or (ii) for broken cycy-cles of any length, often over-estimated by MR-graphs (e.g. the number of broken triangles, or forks, is at least twice larger). Con-sequently, clustering coefficients are not correctly reproduced for these graphs, because of reconstruction failures for both cycles and broken cycles. The limitation of a simple hypergraph-based model for collab-oration networks may be typical of non-artefactual, complex social processes. For instance, some kind of social transitivity (transitive creation of new relationships among “friends of friends”) may be needed if we want to account for the large value of the clustering coefficients when compared to random networks. Underlying hypergraph models. We propose to extend the MR model to constraints stronger than just bipartite degree distributions, yet still pertaining to the underlying hypergraph structure, and particularly to distributions of grouping and affilition sizes. In a recent paper, Mahadevan et al. [MKFV06] introduced random graph generation methods aiming at reconstructing increasingly more properties of an original input graph G by fitting increasingly detailed correlations on degrees in the original graph. This reconstruction is based on the notion of “dK distributions”, where a larger value of d corresponds to more constraining degree correlations. For example, 0K-graphs only reconstruct the mean connectivity of G, 1K-graphs reconstruct the original degree distribution, while 2K-graphs reconstruct the joint distribution of degrees of G, etc.
Lionel Tabourier, Jean-Philippe Cointet and Camille Roth
MR is equivalent to a bipartite version of the 1K-graph, constraining both degree distributions. By analogy with a bipartite 1K reconstruction, we shall denote MR as an “1BK-graph”.
On the whole, constraints induced by 1BK-graphs seem too weak to yield a proper reconstruction of collaboration networks. We suspected higher-level correlations between actor degrees and group sizes to play a role in the observed discrepancy, and therefore introduced bipartite versions of 2K and 3K models, as 2BK and 3BK models — in the 2BK case, e.g., we thus fit degrees at the end of bipartite links.
Nonetheless, these models still failed to account for the number of cycles and broken cycles of collabo-ration networks. The observed cyclic structure seems independent of strictly structural constraints, at least those induced by the first dBK reconstructions only respecting degree correlations (0BK, 1BK, 2BK and 3BK). To be sure, yet, we propose an alternative to 2BK, called “2BK′reconstruction” preserving the orig-inal joint distribution of degrees — like in the 2BK case — and preserving, for each bipartite link (node v ↔ group g), the sum of degrees of nodes connected to group g and the sum of sizes of groups connected to actor v. In other words, we conserve the following probability distribution: P(∑l∈ViKl,ki,Kj,∑l∈V
jkl)
(where
V
idenotes the (bipartite) neighborhood of node i, kithe number of groups in which node i takespart, Kjthe size of group j).
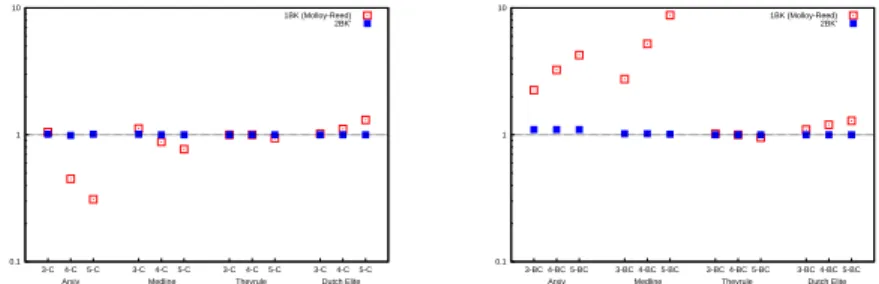
Results of the 2BK′reconstruction fit much more satisfyingly original values of collaboration networks — the amount of 3-, 4- and 5-node cycles and broken cycles is now suitable (see Fig. 2), while the ratio of sequential vs. structural cycles is also correctly reproduced. In short, the corresponding topology may well be explained, still, by a simple kind of degree correlations in the underlying hypergraph.
0.1 1 10 5-C 4-C 3-C 5-C 4-C 3-C 5-C 4-C 3-C 5-C 4-C 3-C
Arxiv Medline Theyrule Dutch Elite 1BK (Molloy-Reed) 2BK’ 0.1 1 10 3-BC 4-BC 5-BC 3-BC 4-BC 5-BC 3-BC 4-BC 5-BC 3-BC 4-BC 5-BC Arxiv Medline Theyrule Dutch Elite
1BK (Molloy-Reed) 2BK’
Figure 2: For each network and each pattern (at left: 3, 4 and 5-nodes cycles; at right: 3, 4 and 5-nodes broken cycles), we compare the ratios between their real value and their 1BK and 2BK′reconstructions (resp., empty and full boxes).
Conclusion
Classical hypergraph-based models reconstruct well several cyclic patterns (cycles and broken cycles of length 3, 4, 5 and corresponding clustering coefficients) for some networks with an underlying hypergraph structure — namely, interlock networks. Other such networks, including collaboration networks, seem to be properly reconstructed by a slightly alternative hypergraph-based model (2BK′) using another distribution of higher-range degree correlation. Contrary to the basic models, this one can account for the proportion of structural and sequential patterns, reconstructing therefore the clustering properties of various types of networks with accuracy. On the whole, we thus show that most of these cyclical features are likely to
stem first from constructional phenomenalinked to the underlying hypergraph only, rather than peculiar processes and interaction behaviors proper to the particular real-world context of the graph. Extensions to other empirical settings would be most fruitful to assess the generality of these results.
References
[GL04] J.-L. Guillaume and M Latapy. Bipartite structure of all complex networks. IPL, 90(5):215–221, 2004. [MIK+04] R Milo, S Itzkovitz, N Kashtan, R Levitt, S Shen-Orr, I Ayzenshtat, M Sheffer, and U Alon. Superfamilies
of evolved and designed networks. Science, 303(5663):1538–1542, Mar 2004.
[MKFV06] P Mahadevan, D Krioukov, K Fall, and A Vahdat. Systematic topology analysis and generation using degree correlations. arxiv, cs.NI, May 2006.
[MR95] M Molloy and B Reed. A critical point for random graphs with a given degree sequence. Random Struc-tures and Algorithms, 161(6):161–179, 1995.
[NSW02] M Newman, S Strogatz, and D Watts. Random graphs models of social networks. PNAS, 99:2566, 2002. [RA04] G Robins and M Alexander. Small worlds among interlocking directors: Network structure and distance