HAL Id: halshs-00586320
https://halshs.archives-ouvertes.fr/halshs-00586320
Preprint submitted on 15 Apr 2011
HAL is a multi-disciplinary open access archive for the deposit and dissemination of sci-entific research documents, whether they are pub-lished or not. The documents may come from teaching and research institutions in France or
L’archive ouverte pluridisciplinaire HAL, est destinée au dépôt et à la diffusion de documents scientifiques de niveau recherche, publiés ou non, émanant des établissements d’enseignement et de recherche français ou étrangers, des laboratoires
Financial development and survival of African agri-food
exports
Mélise Jaud, Madina Kukenova
To cite this version:
Mélise Jaud, Madina Kukenova. Financial development and survival of African agri-food exports. 2011. �halshs-00586320�
WORKING PAPER N° 2011 - 16
Financial development and survival of African
agri-food exports
Mélise Jaud Madina Kukenova
JEL Codes: G1, F10, C41
Keywords: Financial development, external finance
dependence, agri-food trade, SPS regulation, product risk index duration of trade
P
ARIS-
JOURDANS
CIENCESE
CONOMIQUES48,BD JOURDAN –E.N.S.–75014PARIS TÉL. :33(0)143136300 – FAX :33(0)143136310
www.pse.ens.fr
Financial Development and Survival of African
Agri-food Exports
Melise Jaud
yMadina Kukenova
zApril 2011
Abstract
This paper investigates the link between export survival of agri-food products and …nancial development. Our hypothesis is that …nancial developement dif-ferentially a¤ects the survival of exports across products based on their need of external …nance. We propose a test for the role of …nancial development by ex-amining whether exports of products that are relatively more reliant on external capital survive longer when initiated in more …nancially developped countries. Our results suggest that agri-food products that require more external …nance indeed sustain longer in foreign markets when exported from more …nancially developed countries.
Keywords: Financial Development, External Finance Dependence, Agri-food trade, SPS regulation, Product Risk Index Duration of trade
JEL classi…cation: G1 F10 C41
This paper is part of a World Bank program. Without implicating them, we would like to express our thanks to Nicolas Berman, Olivier Cadot, Anne-Célia Disdier, Lionel Fontagné, Jean Imbs, Marcelo Olarreaga, Denisse Pierola, Mathias Thoenig, Akiko Suwa and Thierry Verdier for useful comments. We are grateful to the following counties’customs departement for access to their data –Ghana, Mali, Malawi, Senegal, Tanzania.
yThe World Bank and Paris School of Economics; mjaud@worldbank.org zUniversity of Lausanne; madina.kukenova@unil.ch
1
Introduction
Surviving in the export market is not just about entering into, but also about not exiting from foreign markets. The rapidly growing literature on international trade at the level of individual …rms has mainly focused on the role of …xed costs and …rms’ characteristics–productivity and …nancial constraints–on exporting status (Melitz, 2003, Eaton et al., 2004; Bernard and Jensen, 2004; Chaney, 2005; Manova, 2008, Eaton et al., 2009). Yet, empirical evidence on the relevance of these determinants on …rms’ability to sustain once they entered is rather scarce. This is surprising given that sustained trade relationships are the driving force of …rms’export performances and subsequent economic growth (Besedes and Prusa, 2006a; Brenton and Newfarmer, 2007; Brenton et al., 2009). In countries as di¤erent as Columbia or China, higher export performances are to be expected from the securing (survival) and deepening of existing trade ‡ows rather than the creation of new ones (Eaton et al., 2008; Manova and Zhang, 2009).
In this paper we try to …ll this void of the literature and investigate the role of …nancial development in promoting export survival of agri-food export sensitive to food safety regulations of destination markets. The focus on the agri-food sector is dictated by the availability of a measure of …nancing needs at the product level. We rely on a measure of product sanitary risk developed by Jaud et al., (2009a). Additionally, the agri-food sector is particularly relevant to developing countries. International trade in high-value food products–including fresh and processed fruits and vegetables, …sh, live animals and meat, nuts, and spices–from developing countries has expanded enormously over the last two decades o¤ering opportunities for development. However, trade in agri-food is governed by a growing array of standards. Evolving Sanitary and Phytosanitary Standards (SPS) and technical regulations as well as changes in importers supply chain requirements impose additional sunk, …xed and operating costs along the …rms’export life. These costs may not only a¤ect the decision of …rms to start exporting but also a¤ect survival of the …rms “pricing out” producers that cannot comply with the SPS regulations.
The existence of these costs suggests a potential role of credit constraints in shaping the duration of trade relationships on foreign markets. Well-developed …nancial mar-kets by facilitating …rms access to …nance would allow them to survive demand shocks in foreign markets and maintain long-standing trade relationships. The more so for products with higher …nancing needs. We empirically test this prediction by examining the export survival of di¤erent agri-food products from …rms operating in …ve African countries to the world. We build on the seminal work of Rajan and Zingales (1998) and use a di¤erence in di¤erences approach. To capture the di¤erentiated e¤ect of …nancial development across industries, they interact the country level of …nancial development with the industry level of external …nance dependence and control for industry and country …xed e¤ects. The measure of external …nance dependence is computed using US …rm level data and re‡ects the industry technological demand for external …nance.
As a proxy for …nancing needs of agri-food products, a measure of sanitary risk computed at the 8-digit level of the HS classi…cation (Jaud et al., 2009a). The Sanitary Risk Index (SRI) re‡ects the propensity of products to fail health and safety controls on the European Union (EU) market. Thus, it captures the need for investments to comply with the EU food safety requirements. Several studies in the standard and trade literature, suggest high costs of compliance, both variable and …xed, for …rms exporting high-value food products (Garcia-Martinez and Poole, 2006; Maskus et al., 2005). Our proxy captures the need for …nancing associated with exporting to stringent developed countries market. Since our focus is on African …rms ability to sustain in the export markets, capturing the di¤erentiated e¤ect of …nancial development requires an export based measure rather than production based measure.
The paper contributes to three strands of literature. First, it contributes to a liter-ature on credit constraints and patterns of trade. This rapidly growing line of research highlights the role of …nance for credit constrained …rms to fund both short term and longer term needs. A number of papers have provided evidence on the positive e¤ect of the supply of external …nance to …rms on trade performances (Manova, 2008; Beck, 2003; Svaleryd and Vlachos 2005; Berman and Hericourt forth, Bugamelli et al. 2008; Görg and Spaliara 2009). More recently, several papers have looked into the e¤ects of liquidity shortages following banking crisis on the performances of …rms already engaged in exporting (Amiti and Weinstein, 2010; Bricogne et al., 2010). Crucially, the nega-tive e¤ects of credit constraints vary with the industry dependence on external …nance (Rajan and Zingales, 1998). Finance helps especially exports of those …rms with needs for greater external capital. An innovation of our paper with respect to the previous related literature is its reliance on the index of sanitary risk to capture the need for …-nancing of agri-food …rms to support their exports to high income destination markets. Additionally, we address the issue of export survival. The existing literature on …nance and trade usually focuses on the short-term year-to-year changes in the export status of products or …rms (Manova 2008, Berman and Héricourt forth). An exception is the recent paper of Jaud et al. (2009b), who show that …nancial development promotes export survival for …nancially vulnerable industries requiring a higher external …nancing to maintain their operations. Relying on the tools of survival analysis arguably enables us to better capture the medium and long run survival of exporters. This distinction is not innocuous. The majority of export relationships die within two years and the bulk of export growth in successful developing countries comes from the long-term survivors. Second, it contributes to the burgeoning trade literature using survival analysis (Besedes and Prusa 2006a, 2006b; Nitsch, 2009; Brenton et al., 2009). The literature has so far examined how di¤erent country characteristics contribute to longer survival of domestic …rms on foreign markets. The main problems of using country characteristics as regres-sors are the potential endogeneity and omitted variables bias. When trying to identify the causal e¤ect of …nancial development, it is impossible to control for all other coun-try characteristics that are correlated with …nance and also might a¤ect the survival
of exporting …rms. We address this issue by incorporating the methodology of Rajan and Zingales (1998) into the framework of survival analysis. This enables us to look for a speci…c channel through which …nancial development promotes export survival while controlling for country, …rm and product …xed e¤ects.
Third, we contribute to the food safety standards and trade literature. Most of the works have focused on the quantitative assessment of the e¤ects of standards on trade essen-tially by including standards–count of noti…cations–as explanatory variables in gravity equations (Otsuki et al. 2001, Moenius 2006, Disdier et al. 2008). We distinguish ourselves from this literature relying on an innovative measure of product sanitary risk. Our measure captures the need at the product level for …nance to comply with the food safety regulation.
The remainder of the paper is organized as follows. The next section brie‡y dis-cusses some key features of the data that motivated our empirical framework. Section
3 introduces the empirical strategy. Section 4 presents our African …rm-level data and
gives some descriptive statistics. Section 5 reports the main estimation results. Section
6shows some robustness checks. And …nally, section 7 concludes.
2
Motivation
2.1
Access to Finance and Trade Duration
The theoretical literature shapes a role for …nance on trade mainly at the time of entry, when access to …nancing is the most critical (Das et al., 2007; Berman and Hericourt forth). The prominence of …rms entry and subsequent exit from export markets suggests that initial entry costs are not as high as theoretical models predict. The high proportion of failures in trade relationships, past the …rst two years of exporting, can be explained by the high costs of sustaining in the export market (Besedes 2007). This calls for a role of access to …nance along the life of trade relationships. Long lasting trade relations depend on a well-functioning …nancial system both in the origin and destination country. In 2006, the average ratio of private credit to GDP was 110 percent in the OECD, 31 percent in Latin America–notoriously under-banked–and only 20 percent in Africa. The latter is most certainly biased upwards since a large number of African countries do not report any data. Additionally, the majority of …rms located in these …ve countries are small and medium sized …rms, for which the lack of technical quali…cations and necessary capital investments constrain their ability to remain and expand on foreign export markets.
We use …rm-level survey data to further show the relevance of access to …nance for …rms
export survival.1 We use answers from surveyed exporters in Ghana, Mali, Malawi,
1The survey data –100 responding companies– serves as anecdotal evidence. It highlights the
Senegal and Tanzania. The data comes from the World Bank International Trade De-partment. In each country around 100 …rms provided answers to the questions. The questions are designed such that each …rm can give multiple answers to each of the questions. Therefore percentage do not add up to 100. The …rst question investigates what are the main supply constraints to the expansion of the company exports. Among current exporters one answer largely dominates. 34% of current exporters cite the lack of …nance as a main obstacle for the expansion of the company production to the larger scale. And 34% of current exporters cite the lack of …nance as a main obstacle for im-proving the quality of the company’s products. Among past exporters–that at the time of the interview had ceased activities–47% cite the lack of …nance as a main obstacle for surviving in the exporting activity. The second question further considers the costs relating to exporting as potential constraints to the company sales expansion abroad. Once more, the answer that dominated among companies operating in agriculture is the costs related to complying with SPS regulation (25% of the respondents). These results highlight the large dependency of …rms on external …nance to support both their working capital and longer term investment needs.
2.2
Standards, Cost of Compliance and Trade Duration
In recent years, developing countries exports in high-value food products to developed-country markets have expanded considerably in response to changing consumer tastes and with the support of advances in production, transport, and other supply chain technologies. Characterized by relatively high income elasticities of demand and lower price volatility than many traditional developing country export commodities, high-value food products have emerged as a potentially major source of export growth for many African countries. Still, trade in such products is governed by a growing array of standards. Not only are food standards stringent, they are increasingly so. Standards relate to the products themselves and to the processes by which they are produced and handled.
To enter foreign markets African agri-food exports have to satisfy both stringent public and private standards. The EU being the main destination for sub-Saharan African agri-cultural exports (see Appendix 8:A), the EU legislation remains of primary importance to these countries. The EU new comprehensive food safety policy (EC R 178/2002) involves the adoption of an integrated approach covering all aspects of the food chain. Traceability implies that EU food companies have to document from/to whom they are buying/selling produce such that products can be traced back to their origin in case of food safety problems. While, they are limited to a “one step forward, one step back”principle within the EU, with no obligations to keep records in third countries, in practise, however, EU buyers are going beyond the strict legal requirements. Complete African …rms.
traceability throughout the chain up to the level of overseas producers forms parts of many private standards, including the GlobalGAP.
As a result, exporting adequate quality products requires producers to invest in produc-tion infrastructure, revise their practises through sta¤ training and implement traceabil-ity systems. A signi…cant body of literature provides evidence that these compliance costs are non trivial and may be su¢ cient to disrupt …rms trade relationships. Maskus et al., (2005) use …rm-level data from 16 developing countries in the World Bank Tech-nical Barriers to Trade (TBT) Survey Database. Their …ndings indicate that standards do increase short-run production costs by requiring additional inputs of labor and cap-ital. They show that a one percent increase in investment to meet compliance costs in importing countries raises variable production costs by between 0.06 and 0.13 percent in the exporting country. Additionally, they …nd that the …xed costs of compliance are signi…cant and amount approximately $425,000 per …rm, or about 4.7 percent of value added on average. Other attempts to quantify the compliance costs include the recent study by UNCTAD (2005). The costs of compliance with SPS for tropical fruits in three sub-Saharan African countries–including United Republic of Tanzania, Mozambique and
Guinea–are estimated using the GlobalGAP protocol as a case study2. Appendix 8:B
reports results for Tanzania. These …ndings illustrate the importance of both recurring operating and …xed investment costs, suggesting that compliance is both a costly and lengthy process. While these costs may be born publicly, in practise, the lack of tech-nical and administrative capacities in developing countries implies that the cost burden fall onto individual …rms. Their ability to secure su¢ cient liquidity to insure ongoing production as well as to make the necessary investments is essential to their pro…tably remaining on the market. In this manner, the relative under-development of …nancial systems in Saharan African countries may constrain …rms access to capital and sub-sequent export survival. The next two sections present our choice of empirical strategy and the data.
3
Empirical Strategy
Our hypothesis is that …nancial development di¤erentially a¤ects the survival of exports across products based on their sensitivity to SPS regulations. A measure of sanitary risk at the product level (Jaud et al., 2009a) serves as a proxy for …nancing needs of agri-food products.
This di¤erential e¤ect calls for a di¤erence-in-di¤erence approach initially proposed by Rajan and Zingales (1998). Their seminal paper emphasizes the bene…cial implica-tions of …nancial development for industries dependent on external …nance. To capture
2The GlobalGAP was designed to accommodate the requirements set out by international standards
as well as EU regulations. For these reasons, it is a good proxy to estimate the necessary costs of complying with standards and providing safe –non rejected –products.
the di¤erential e¤ect of …nancial development across industries, they interact the coun-try level of …nancial development with the induscoun-try level of external …nance dependence and control for industry and country …xed e¤ects. This allows to isolate the impact of …nancial development on industry growth after controlling for cross-country and within-country di¤erences as well as omitted variable bias. Industry-level measures of external capital dependence are based on U.S. …rms …nancial data. The indicator of a sector’s reliance on outside …nance is de…ned as the ratio of capital expenditures minus cash ‡ow from operations to capital expenditures for the median …rm in each industry taking the average across years. Thus, the measure of external …nance dependence captures technological demand for …nancing for each industry and is assumed to be similar across countries.
The paper relies on the Rajan and Zingales estimation strategy to isolate a channel through which …nancial development may promote export survival. We do not build on Rajan and Zingales to compute our risk measure. Crucially, our proxy for …nancing needs of agri-food products is a measure of their sanitary risk. It is an export based rather than a production based measure, computed using rejections of exports at the EU borders. Thus, our proxy captures the need for …nancing associated with exporting to stringent developed countries market. Since our focus is on African …rms ability to sustain in the export markets, capturing the di¤erentiated e¤ect of …nancial development requires an export based measure of …nancing needs.
3.1
The Sanitary Risk Index
This section details the construction of the Sanitary Risk Index, and motivates its use as a measure of …nancing needs at the product level. The risk index is computed using data from the EU Rapid Alert System for Food and Feed (RASFF). The RASFF database reports all agri-food shipments to the EU between 2001 and 2008, that have su¤ered rejection due to food safety reasons. The database provides rejections by product, exporting country, importing country (EU member state) and year. The index is the
coe¢ cient on the product dummy, k in the following regression:
Alertck = f ( ImpShareEUck + Controlsk+ c + k+ "ck) (1)
where "ck is an error term. For a product k and an exporter c, the dependent variable
is the combined count of noti…cations from all EU member states between 2001 and 20083. The unit of observation is an exporter product pair and the regression is
cross-sectional. To avoid picking up on any particularities generated by exporting countries’
3There is indeed, consistent di¤erences in the number of noti…cations among notifying EU states. In
an average year, Germany with 20% of noti…cations is among the top notifying countries, while Ireland only account of 0.21% of noti…cations. Aggregating the number of noti…cations across all importing (notifying) countries and all years, smooths temporal ‡uctuations and reduces the e¤ects of outliers.
exports volume, protectionist agenda or limited competition a set of control variables are included: exporter c share in EU imports of product k in the year 2000 (one year before
the sample start) (Imp_shareEU
ck ), the ad-valorem equivalent of the EU’s MFN tari¤
on product k; (tarif fk)4, a dummy variable indicating whether product k is a¤ected
by a quota during the sample period (quotak), a dummy variable indicating whether
product k has been the object of a dispute at the WTO between the EU and any
other country (disputek). Including a dummy variable indicating whether exporter c
is a¤ected by a ban on product k during the sample period controls for decreases in the incidence of noti…cations resulting from reduced imports rather than reduced risk (banck). The initial value of EU imports of product k in the year 2000 (totimport2000k )is
included, as products imported in large volumes are likely to be inspected–and therefore, fail inspections–more often than others. Finally, the inclusion of a country …xed e¤ect
c;controls for all supplier’s characteristics that may a¤ect the quality of the product–
including overall economic development.5 Because the number of noti…cations is a count,
estimation is by Negative Binomial–alternatively Poisson.6
In this set up, the product dummy captures the share of alerts due to product char-acteristics after controlling for exporters’ charchar-acteristics and other variables that may a¤ect the probability of being rejected. A high risk index re‡ects a high sensitivity to food safety regulations. Since, rejection occurs when a product does not comply with food safety requirements as set in the regulation, the index can be interpreted as the gap between standard and actual product quality. "Risky" products are products far away from the standard. The gap deepens if the regulation is changing and/or if cur-rent production technologies do not allow to reach adequate quality. As a consequence, laying far away from the standard, leaves …rms with two options, either conform or drop the market. As shown in section 2.2, compliance is a lengthy and costly process. Thus, for complying …rms, the risk index captures the need for capital to conform with EU markets food safety requirements, and acts as a proxy for product …nancing needs. In the remainder of the paper we refer to our measure of …nancing needs as the risk index. Here, risk should be understood as the risk of su¤ering alerts.
We now brie‡y discuss some important features of the index. First, to our knowledge, there is no available measure of …nancing needs at the product level7. As explained in
4We take tari¤s data for the year 2005.
5Even though we control for a potential protectionist agenda of the destination markets and for the
exporting country time invariant characteristics, our index may still su¤er from omitted variable bias. The limited time span of our data on alerts does not allow us to estimate the risk index controlling for time invariant sectorial characteristics speci…c to the exporting country.
6A Poisson would give similar results, as the consistency of second-stage estimates does not depend
on the correct speci…cation of the …rst-stage equation. In addition, we have over dispersion and little excess of zeros in the sample. The negative binomial is to a reasonable extent adequate in tackling both problems. However estimation using zero-in‡ated negative binomial could be a good alternative.
7In Bricogne et al. (2010), the authors compute an external …nance dependence measure – akin to
details above, the number of alerts per se, as a measure of …nancing needs, is a very noisy proxy capturing both product and country characteristics. In a similar manner, the occurrence of noti…cations at the product level–count of existing SPS regulations–is poorly informative. It is an ex-ante measure, that does not re‡ect how the regulations are being managed in practise. By contrast, we consider the e¤ective product risk based on real food alerts at the EU border. The risk index measures how food safety regulations translate into inspections and rejections of non compliant shipments and thus how costly it may be to comply. In addition, no data on the costs of compliance at the product level, which would be the best proxy for capital needs, is available (section 2:2). The correlations between our risk index and those alternative measures are reported in Appendix 8:C. All coe¢ cients are below 0.35. The correlation between the number of public SPS noti…cations and the measure of sanitary risk is low. However this may be explained by the fact that the number of noti…cations is taken from Disdier et al., (2008) and is computed at the HS6 level, while our measure of risk is computed at the HS8 level. In addition, a lot of products have at least one noti…cation, while few products have a positive SRI.
Second, it is worth noting that our measure of risk, and therefore the need for …nancing, is time invariant. Most probably this will not be the case in practise. However we verify that the ranking of agri-food sectors based on rejection occurrences is persistent over time8.
Finally, we ask the question whether the risk index computed using the EU market food safety requirements as a benchmark is relevant? The focus of the analysis is on public standards since the food alert database only reports shipments non compliant with the EU food safety regulation, and due to data limitations it was not possible to account for private standards in the empirical analysis. Private protocols play an increasingly important role in the governance of food supply chains. Public standards are becoming more performance and process based, they are developed to correct market failures, and therefore, tend to play a dominant role in preventing fraud and ensuring minimum standards for largely homogenous agricultural products. While, in many cases private standards build on the existing public standard infrastructure to provide an element of competition through quality di¤erentiation, as well as to facilitate e¤ective coordination in supply chains. Thus, a large share of the cost of compliance arise because of public regulations. Our risk measure while not accounting for private standard still captures the need for …nancing to maintain access to developed countries’market. In addition, the EU regulation is in line with requirements set out by international standards as well as other domestic regulations–high income countries mostly. Besides, the EU is a major destination market for our African countries’export. It makes sense to account for requirements in this destination market. All together, this substantially supports our
8Although not optimal, this gives us some insight on how risk may evolve across sectors over time.
claim that the risk index is the best available proxy for …nancing needs at the product level.9
Appendix 8:D provides a list of the CN2 agri-food sector associated with the highest sanitary risk indices, both according to the number of "risky" products–product with a positive Sanitary Risk Index–and the average sanitary risk. The table also gives the total number of alerts for each sector between 2001 and 2005, as well as the most frequent reason for rejection. Not surprisingly, …shery products, spices emerge as the most "risky" sectors, and thus, the sectors that use the most external …nance. All together, 373 CN8 codes out of 2146 have a non zero risk index. In most cases, rejections are due to contamination level above the authorised threshold in inspected products.
3.2
Trade Duration and Di¤erence in Di¤erence Approach
Our empirical strategy consists of incorporating the Rajan and Zingales (1998) method-ology into the survival analysis framework. Our focus is on the long run survival of products in foreign markets. We depart from previous works on …nance and trade, where the focus is on the short-term year-to-year changes in export status of products or …rms (Manova, 2008; Berman and Héricourt forth). Survival analysis is probably the most suitable tool to study the impact of …nancial development on the longer-term exporting status of trade relationships. While our data is initially a four dimensional panel data (we observe export by …rm-destination country-product over time), we re-duce the panel dimensions to three, to study the length of trade relationships. This highly detailed level of information is particularly suitable for survival analysis as aggre-gation may introduce considerable bias, essentially hiding failures. A trade relationship is de…ned as a …rm-product-destination triplet, and the duration of a trade relationship is de…ned as the time (in years) a triplet has been in existence without interruption. Our variable of interest is the survival-time of …rm’s export relationships–the time until a trade relationship ends–across products in …ve African countries. Then, …rms in our sample are already surviving …rms. They already incurred sunk entry costs. As a result, our focus is on the determinants of their ability to continuously remain on and not to enter in the market.
Ordinary Least Squares (OLS) are not suitable for duration data, essentially because survival-times are restricted to be positive, and thus, have a skewed distribution. There-fore, we model the survival of trade relationships using a Cox proportional Hazard Model (CPHM). We assume that the duration of exports of product k from …rm i operating
9Since four of the …ve African countries used in our analysis are also present in the food alert
database, this may introduce an endogeneity bias. All together Ghana, Mali, Malawi and Senegal account for 2.6 percent of the food alerts, when an average exporter su¤ers around 90 alerts and an average African exporter gets rejected 12 times on average. We re-estimated the risk index dropping those four countries from the food alert database. The level of correlation between the actual and newly computed risk index is 0.9.
in country c to destination country j, depends upon a set of variables Xcikj:
Speci…-cally, we model the hazard function of a trade relationship as a multiplicative function between an unspeci…ed time-dependent baseline hazard function, and an exponential function of country and sector …xed e¤ects, an interaction term between our measure of risk with the level of …nancial development, a set of controls and the unobserved e¤ects. In the Cox PH model (Appendix 8:J ), the inclusion of …xed e¤ects, result in a shift of the baseline hazard function. We further allow, for the shape of the baseline hazard function h(t) to vary across products–HS8-digit–by …tting a strati…ed Cox PH model.
Strati…cation according to the product indicator variable k with 698 the number of
agri-food products, adds more ‡exibility to the model and allows to estimate the e¤ect of the Xcikj on the hazard rate within-product.
Thus, the empirical model we estimate is as follows:
h(tjXcikj; k = k) = hk(t) exp[ F Dc sanitary_riskk
+ Controlsckt0+ i+ j+ + t0+"cikjt0] (2)
where F Dc is the level of …nancial development of country c, sanitary_riskk the risk
index of product k, i is a …rm …xed e¤ect, j is a destination country …xed e¤ect,
is an exporter HS2 sector …xed e¤ect10, and "
cikj is an unobserved e¤ect. To
capture the di¤erential e¤ect of …nancial development across products, we interact the country level of …nancial development with the product level of …nancing needs (F Dc
sanitary_riskk)and control for product and country …xed e¤ects. This allows to isolate
the impact of …nancial development on product survival after controlling for omitted variable bias at the country and product level. The level of …nancial development is
taken at the initiation of the sample period for each exporting country11. That is
the year we …rst have export data. All other explanatory variables take value at the initiation of the trade relationship. Our vector of Controls includes various product and …rm characteristics as well as traditional bilateral gravity variables. The product-related variables include the value of export in US dollars in the initial year of the trade relationship in logs, initial_exportcikj. This re‡ects the level of con…dence importers
have in the pro…tability of their trading partner (Rauch and Watson, 2003; Albornoz et al., 2010). Additionally, we include the total number of destination markets served by …rm i in country c with product k in the initial year of the trade relationship, N Destinationscik, in log terms. This allows to control for the experience the …rm has
in supplying the world market with product k. We control for the degree of export
10Sector is de…ned at HS2 level.
11We do this due to the short time span of our sample, and the poor reliability of the data for
African countries. Additionally, we used the average level of …nancial development over the sample period for each country, and …nancial development measured at the beginning of each spell, results remain qualitatively the same.
diversi…cation for a given …rm, incorporating the number of products exported by …rm i to the world market in the initial year of the trade relationship, N P roductsci. Transport
costs are proxied with bilateral distance between origin country c and destination country j in logs, Distancecj.12. We also include a dummy variable that equals one if importing
and exporting countries share a border, Contiguitycj. Bilateral trade can be fostered
by countries’ cultural proximity. Similarity in culture can indeed increase the quality of the match between varieties produced in exporting country and tastes of consumers in the destination country. We control for this proximity by introducing two dummies, respectively equal to one if a language is spoken by at least 9% of the population in both countries, Com_languagecj, or if both partners have had a colonial relationship,
Colonycj. Appendix 8:E provides summary statistics of the main variables used in our
analysis.
Equation (2) is estimated under partial likelihood (Cox, 1972). Since there may be unobserved variation across exporter-sector pairs–to avoid biasing the standard errors downwards–in all tables we report robust standard errors clustered at the exporter-sub-sector (HS4) level. The coe¢ cients can be interpreted as semi-elasticities, as they measure the percentage point change in the hazard rate as a result of a unit change in the right-hand side variables.
A common feature of survival data is censoring. First, we observe ‡ows in the …rst year of our sample but do not know how long they have been in existence. Second, we observe ‡ows in the …nal year of our sample but do no know how long they will continue to exist. The problem of right-censoring is accounted for in the Cox estimation
procedures13. Left-censoring presents a more serious problem. Given the short time
span, our approach is simply to ignore left censoring in our main estimations. As a robustness test, we drop all observations which are left-censored and determine the sensitivity of our results to left-censoring14.
4
Data
4.1
African Firm Data
Our analysis relies on a novel dataset collected within the frame of the Export Survival
Project, implemented by the International Trade Department of the World Bank15.
The dataset combines …rm level export data collected by customs authorities in …ve African reporting countries–Ghana, Mali, Malawi, Senegal and Tanzania. The dataset
12Distances are calculated as the sum of the distances between the biggest cities of both countries,
weighted by the share of the population living in each city.
13Stata incudes a dummy variable taking vaue one if the spell is still existing the last year of the
sample.
14Results not reported, available upon request. 15We thank Denisse Pierola and Paul Brenton.
provides trade ‡ows for more than 5,000 HS 8-digit products16 to 253 countries, between
2000-200817. In the following, we consider only exports of agri-food products excluding
beverages, animal feed and tobacco. This corresponds to chapters 1 to 21 of the HS classi…cation, and restricts our sample to 845 product lines. Exports ‡ows are reported annually in values (US dollars) and quantities (tons). Among reporting …rms almost
50% only appear once in the dataset. That is, they export only one product to one
destination one year. As such observations are likely to be mis-reports, we exclude them from the analysis. Among these observations we …nd a large proportion of individuals, for example, "MR OMART FRANCOIS KOUBLANOU", "MR. JOHN AMEFU", or inconsistent exports such as "AIRLINES GHANA LTD" exporting wood logs. Addi-tionally, we exclude from the analysis exports ‡ows from international organizations and embassies, 3% of the observations, since such exports are not driven by pro…t motives and might bias our results18. Finally, the data show that 3:5% of export ‡ows are
re-alised by trading companies. Since our analysis focuses on agri-food products, for which changing food safety regulation may impose additional production and or transaction costs, we are concerned about producing …rms. In a robustness test we drop observa-tions from trading companies and estimate the sensitivity of our results to the exclusion of these observations.
4.2
Additional Data Sources
The data on …nancial development is taken from the Beck, Demirguc-Kunt, and Levine (2006) database, which contains various indicators of …nancial development across coun-tries and over time. We use the private credit to GDP as a proxy for country’s …nancial depth. The variable ranges from 0:21 for Senegal in 2008 to 0:052 for Malawi in 2004. The annual data for GDP per capita is taken from the World Development Indicator report 2006, and is reported in constant 2000 US dollars. Financial development and GDP per capita are correlated at 78% in our sample.
Additionally, we use the level of outstanding short-term credit (T Cc) and trade credit
insurance (ICc) as reported in the Global Development Finance (GDF) as a share of
GDP, as proxies for trade …nancing. Finally, as an alternative control for the country’s
quality of …nancial systems, we use the Getting Credit Index (EGCc) from the World
Bank Doing Business Survey (WBDBS) data for the year 200419. The index ranks
countries according to the strength of legal rights and the depth of credit information.
16Since HS 8-digit product classi…cations are country speci…c, we …rst had to harmonise the
classi…-cations among all countries. Then we match it with the CN 8-digit Eurostat classi…cation, for which the risk index is computed.
17Senegal reports data from 2000 till 2008; Mali from 2005 to 2008, Malawi and Ghana from 2004
till 2008; and Tanzania from 2003 till 2009.
18Including these exporters, results hold in a similar way. Results are available upon request. 19This is the only available year.
We control for additional country characteristics. We use the Ease of Doing Business
index (EDBc) and the Trading Across Borders index (T ABc) to control for the
qual-ity of the business environment in the exporting country. A country’s ranking on the former is based on the average of ten subindices–including starting a business, dealing with licenses, hiring and …ring workers. More speci…cally, the Trading Across Borders index, captures the complexity of customs procedures faced by exporters. It accounts for the number of documents, the number of signatures and time necessary to export and import. The data for both indices is taken from the WBDBS. We use the Logis-tics Performance Index as a proxy for exporting country’s capacity to e¢ ciently move
goods and connect with international markets (LP Ic). The index is a weighted
aver-age of country scores on six key dimensions–including e¢ ciency of the clearance process, competence and quality of logistics services, ease of arranging competitively priced ship-ments. Additionally, we control for the quality of trade and transport infrastructures using the Infrastructure Index which enters the overall LPI index. The data comes from
the World Bank Logistic Performance Indicator database for the year 200716 .
Product wise, we use a perishability index, to insure that our risk measure is not picking up on other product characteristics that may a¤ect their survival. The index takes value one if the product cannot be stored without refrigerator facilities, zero otherwise. Perishable products typically include, meat, …shery products, fruits and vegetables. Correlation between our risk index and the perishability index is 0:15. Finally, data for the gravity variables come from the CEPII database.
4.3
Descriptive Statistics
Appendix 8:F reports some statistics at the …rm level for each exporting country. "Risky" products account for an important share of …rms total exports in all …ve countries. Additionally, "risky" …rms–exporting at least one "risky" product–represent around half of the total …rm population in all …ve countries. Non "risky" …rms are …rms that export no "risky" products at all. Appendices 8:G and 8:H report some statistics for our survival data. Considering …rms in all countries the average spell duration is about one year and four months and the median duration is only one year. Almost 40% of the spells are right censored, and 17% are left censored. Considering each country individually, Senegal exhibits the highest average spell duration, and Ghana the lowest. A large proportion of spells, 56%, start with trade values lower than 10’000 dollars, 13% are initiated with trade values higher than 100’000 dollars and only 3% start with initial trade values greater than 1’000’000 dollars. Dropping all spells with initial trade value inferior to 10’000 dollars (100’000, or 1’000’000 dollars) increase (even more) the average and median spell duration. The higher the initial trade value the higher the probability to survive. These results are in line with …ndings in previous empirical studies (Besedes and Prusa, 2006a, 2006b).
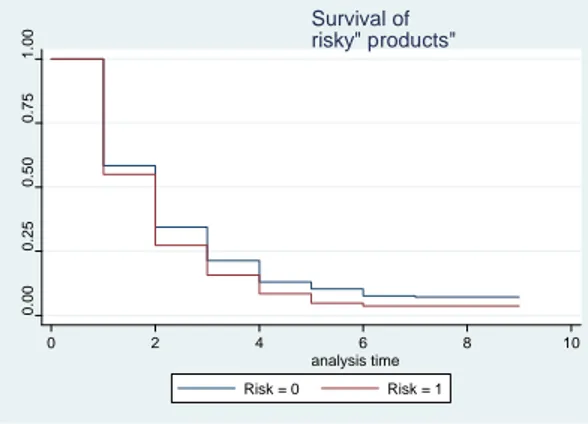
paramet-rically, by estimating the survival function using the Kaplan-Meier estimator (see Ap-pendix 8:I for technical details). We consider all countries and split products into two groups according to their risk: agri-food products in the top 25th percentile of the risk index distribution, the most "risky" products, and the rest of the product, the less "risky" ones20. The survival functions for both products categories are presented in
Figure 1.
Figure 1: Survival of "Risky" versus "non Risky" Products, All Countries.
0.00 0.25 0.50 0.75 1.00 0 2 4 6 8 10 analysis time Risk = 0 Risk = 1 Survival of risky" products"
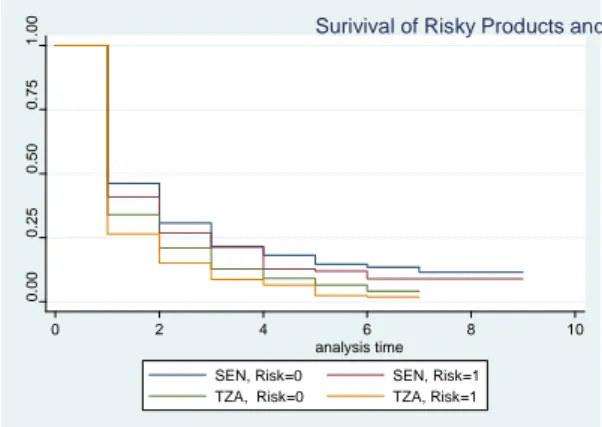
As expected, the less "risky" products (risk=0) survive longer than the riskier ones (risk=1). Tests on the equality of the survival functions reject the null hypothesis at a 1% level of signi…cance (Appendix 8:I). The pattern remains unchanged if we consider each country individually (not reported). Finally, we plot survival functions of each risk category for Senegal and Tanzania, the countries with the highest and lowest level of …nancial development–measured as the ratio of private credit to GDP–in our sample (Figure 2). Results suggest that "risky" products survive longer in Senegal where …nancial markets are relatively better developed, yielding support to our hypothesis.
Figure 2: Survival of "Risky" Products and Financial Development. 0.00 0.25 0.50 0.75 1.00 0 2 4 6 8 10 analysis time SEN, Risk=0 SEN, Risk=1 TZA, Risk=0 TZA, Risk=1
Surivival of Risky Products and Financial Development
5
Empirical Results
5.1
Trade Survival and Financial Development
Table 1 reports the e¤ect of …nancial development on export survival for our baseline speci…cation incorporating various combinations of …xed e¤ects. The dependent variable is the probability of exiting destination country j for product k from …rm i operating in country c. Our main variable of interest is the interaction term between the Sanitary Risk Index and the ratio of bank credits to GDP. The coe¢ cient on the interaction term (F Dc sanitary_riskk)captures the di¤erentiated e¤ect of …nancial development across
products based on their need for external …nance. In column (1) we estimate the direct e¤ect of risk (sanitary_riskk) and …nancial development (F Dc) on the probability to
exit foreign markets. We stratify by HS4 to allow the hazard function to vary across sub-sectors. In addition, we include destination market …xed e¤ects as the ability to survive may vary from one destination market to another. Year …xed e¤ects account for global shocks a¤ecting all trade relationships. We …nd that "risky" products survive signi…cantly less than non "risky" ones. The level of …nancial development in country chas a positive e¤ect on …rms’survival. Both coe¢ cients enter statistically signi…cant at the 1% level.
Table 1: Financial Development and Trade Survival.
The dependent variable is the hazard rate of trade relationships for product k of …rm i operating in country c to destination country j: All regressions are estimated using the Cox Proportional Hazard Model and account for various strati…cation variables and …xed e¤ects. (See details for each column). The main variables of interest are sanitary risk of product k (sanitary_riskk) and its interaction with …nancial development in country c
(FDc*sanitary_riskk). The control variables include …nancial development of country c
(FDc), initial export value (initial_exportickj), number of products exported by …rm i to
the world market (NProductsci), number of destination service by …rm i with product k
(NDestinationscik), gravity variables (Contiguitycj,Com_languagecj,Colonycj, Distancecj).
Robust standard errors clustered at (exporting country) HS4 sector level are in parenthe-ses. *, **, and *** denote statistical signi…cance at the 10%, 5%, and 1% levels, respectively.
(1) (2) (3) (4) FDc x sanitary_riskk -0.141** -0.109* -0.263** -0.458* (0.069) (0.066) (0.107) (0.252) sanitary_riskk 0.018*** 0.015** (0.007) (0.006) FDc -3.557*** (0.726) initial_exportcikj -0.075*** -0.094*** -0.088*** -0.096*** (0.007) (0.006) (0.007) (0.010) NProductsci -0.003*** -0.003 -0.004** -0.009** (0.001) (0.002) (0.002) (0.004) NDestinationscik -0.024*** -0.060*** -0.057*** -0.065*** (0.004) (0.008) (0.009) (0.014) Contiguitycj -0.087 -0.150 -0.190 (0.090) (0.105) (0.251) Com_languagecj -0.249*** -0.126*** -0.123 (0.040) (0.040) (0.101) Colonycj 0.123 -0.086 0.122 (0.089) (0.084) (0.197) Distancecj 0.095** 0.090* 0.319** (0.044) (0.049) (0.147)
…rm fe no yes yes yes
destination fe yes no yes no
destination x exporter fe no yes no no
year fe yes yes yes yes
HS4 fe yes no no no
HS2 x exporting country fe no yes yes yes
HS8 strata no no yes no
Our variable of interest is negative and signi…cant at the 5% level, suggesting that …nan-cial development helps disproportionately more "risky" products to survive. In column (2) we add …rm …xed e¤ects controlling for unobserved time invariant …rm
character-istics. We stratify by HS2 exporter and allow the baseline hazard function to vary
across HS2-exporting country pair (69 pairs). In this way, we control for cross coun-try di¤erences in specialisation patterns. We further control for possible bilateral aid to trade programs that may in‡uence the survival of trade relationships, including
im-porter exporter …xed e¤ects. The e¤ect of …nancial development alone is absorbed.
The coe¢ cient on the risk index remains positive and statistically signi…cant. The co-e¢ cient on the interaction term is negative and signi…cant at the 10%. In column (3) we include a product (HS 8-digit) …xed e¤ect to control for any product time invariant characteristics. The coe¢ cient on risk alone is absorbed. The coe¢ cient on our interac-tion term remains negative and strongly signi…cant. This speci…cainterac-tion is the closest to the original Rajan and Zingales methodology, and therefore, our preferred. We use it for all subsequent robustness checks unless speci…ed otherwise. Finally, in the last column
of Table 1, we estimate an even more rigorous speci…cation, including HS8
destina-tion …xed e¤ects. The inclusion of HS8 x destinadestina-tion e¤ects controls for unobservable protectionist measures that may impact the ability of …rms to survive. Additionally, it controls for the market structure for a given product in a given destination that may in‡uence the survival of risky agri-food products. The coe¢ cient on our main variable is negative and signi…cant at the 10% level.
Moving to our control variables, the value of export (initial_exportcikj), and the total
number of product to all destination markets (N P roductsci) and the total number of
destination served with product k (N Destinationscik), in the initial year of export spell
all decrease the hazard rate. Intuitively, products survive longer on the export market when the importers are willing to accept a higher initial shipment and when the ex-porting company has experience with exex-porting and with placing the products in other markets as well. Distance as a proxy for trade costs increases the hazard rate. While sharing a common border, colonial links and a common language decrease the hazard
rate. All in all, the coe¢ cient on our variable of interest (F Dc sanitary_riskk)
is negative and signi…cant for all speci…cations, suggesting that domestic …nancial de-velopment increases survival of "risky" products in foreign markets. The magnitude and signi…cance on the interaction term is a¤ected by the choice of …xed e¤ects and
strati…cation variable. The coe¢ cient varies from 0:45, when controlling for HS8
destination country …xed e¤ects, to 0:10 when controlling for HS2 origin country
…xed e¤ects. One way to get a sense of the magnitude of the e¤ect is as follows. In 2003, Senegal’s ratio of private credit to GDP is about 0.145%, Tanzania’s ratio of pri-vate credit to GDP is about 0.051%. We consider "Shrimps" with an associated risk index of 2; 97. The coe¢ cient of the interaction term between …nancial development and
our risk index is -0.264 in our preferred speci…cation. Therefore, if Tanzania’s level of …nancial development reached Senegal’s, then the hazard rate of shrimps exports would
decrease by Risk F inDev = 0:264 2:97 (0:145 0:051) 7%.
6
Robustness Checks
6.1
Alternative Measures of Financial Development
In Table 2 we report results using alternative measures of risk (column 2) and …nancial development (column 3 to 5). Column (1) reports our preferred baseline speci…ca-tion for the sake of comparison. In column (2) we use an alternative measure of risk
(alt_sanitary_riskk)–constructed by Jaud and al (2009a) using a Poisson model
in-stead of a Negative Binomial. Results remain qualitatively the same21. Column (3)
and (4) report results using alternative measures of access to …nancing. Local …nancial markets are not the only source of …nance for exporters.
Firms operating in countries with poorly developed …nancial markets may rely on trade …nancing provided by institutions in the destination country. The interaction term between our risk index and the measure of short term credit from the BIS banks (T Cc)
is negative and statistically signi…cant at the 10% level. The coe¢ cient is negative but
not signi…cant when using the ratio of trade insurance to GDP (ICc) interacted with
risk. Column (5) reports results when using the Ease of Getting Credit index (EGCc):
The coe¢ cient on the interaction term with the risk index comes out negative and signi…cant at the 5% level, suggesting that the quality of domestic …nancial institution increases survival of "risky" products in foreign markets.
21Alternatively, we use the count of noti…cations per product at the HS 6-digit level, as a measure of
…nancing needs. The data is taken from Didiers and al. (2008). The correlation between our measure of risk and this alternative measure is 0.05. Coe¢ cients on both the count of noti…cations and its interaction with the level of …nancial development are of expected sign but not signi…cant.
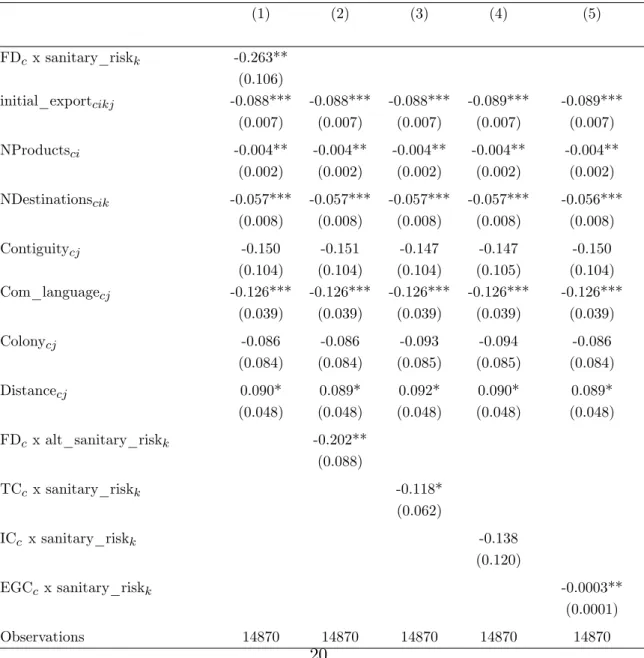
Table 2: Robustness I, Survival and Alternative Measures of Financial Development. The dependent variable is the hazard rate of trade relationships for product k of …rm i operating in country c to destination country j:All regressions are estimated using the Cox Proportional Hazard Model. We control for destination country, year, …rm and exporting country x HS2 …xed e¤ects, and allow the baseline hazard to vary across HS8 product (strata). The variables of interest are de…ned in Table 1. Additional controls include an alternative measure of sanitary risk, the sanitary risk index computed using Poisson regression (alt_sanitary_riskk, see Jaud et al.,2009a). We
use as alternative measures of …nancial development proxied by trade credit over GDP in country c (TCc), by trade credit insurance over GDP in country c (ICc) and by the Ease of Getting Credit
index (EGCc). Robust standard errors clustered at (exporting country) HS4 sector level are
in parentheses. *, **, and *** denote statistical signi…cance at the 10%, 5%, and 1% levels, respectively. (1) (2) (3) (4) (5) FDc x sanitary_riskk -0.263** (0.106) initial_exportcikj -0.088*** -0.088*** -0.088*** -0.089*** -0.089*** (0.007) (0.007) (0.007) (0.007) (0.007) NProductsci -0.004** -0.004** -0.004** -0.004** -0.004** (0.002) (0.002) (0.002) (0.002) (0.002) NDestinationscik -0.057*** -0.057*** -0.057*** -0.057*** -0.056*** (0.008) (0.008) (0.008) (0.008) (0.008) Contiguitycj -0.150 -0.151 -0.147 -0.147 -0.150 (0.104) (0.104) (0.104) (0.105) (0.104) Com_languagecj -0.126*** -0.126*** -0.126*** -0.126*** -0.126*** (0.039) (0.039) (0.039) (0.039) (0.039) Colonycj -0.086 -0.086 -0.093 -0.094 -0.086 (0.084) (0.084) (0.085) (0.085) (0.084) Distancecj 0.090* 0.089* 0.092* 0.090* 0.089* (0.048) (0.048) (0.048) (0.048) (0.048) FDc x alt_sanitary_riskk -0.202** (0.088) TCc x sanitary_riskk -0.118* (0.062) ICc x sanitary_riskk -0.138 (0.120) EGCc x sanitary_riskk -0.0003** (0.0001)
6.2
Controlling for Alternative Channels
As in standard OLS, the identi…cation of our main coe¢ cient relies on the assumption of orthogonality between the interaction term and the residual. We are concerned with vari-able potentially correlated with …nancial development and that may impact the survival of products di¤erentially. Financial development may be correlated with other country characteristics, such as the quality of the infrastructure, the complexity of the customs procedures, the business regulations etc... In order to control for these alternative chan-nels, we interact each of these country variables with the risk index and include them as additional regressors in our baseline speci…cation (column (3) in Table 1). Results are reported in Table 3: The coe¢ cient on our main variable (F Dc sanitary_riskk) has
ex-pected sign and remains signi…cant in all speci…cations. The coe¢ cient of the interaction term between the Sanitary Risk Index and GPD per capita , is positive and signi…cant at the 5% level. This, most probably, signals a colinearity problem between both interac-tion terms (column 1)22. In column (2) we interact the Ease of Doing Business index with
the risk index (EDBc sanitary_riskk), controling for favourable business conditions
in the exporting country that may positively in‡uence exports survival. The coe¢ cient is positive but not signi…cant. Column (3), (4) and (5) report results when controlling
for respectively, Logistic Performance Index (LP Ic sanitary_riskk), the quality of
the trading infrastructure (Inf rustructurec sanitary_riskk), and the complexity of
trading procedures in the exporting country (T ABc sanitary_riskk):Coe¢ cients on
all three interaction terms have expected signs but fail to be statistically signi…cant,
while the coe¢ cient on the interaction of F Cc with sanitary_riskk remains negative
and signi…cant23. All in all, after controlling for overall economic development, quality of the business and trading environment, the positive e¤ect of access to …nance on …rms exports survival remains. These …ndings yield further support to our hypothesis.
22We run a regression with the interaction term of GDP per capita with risk alone. The coe¢ cient is
negative and signi…cant at the 5% level. This suggests that the overall level of economic development act in a similar way as …nancial development.
23Running separate regressions with the interaction term of each of these variables with risk alone,
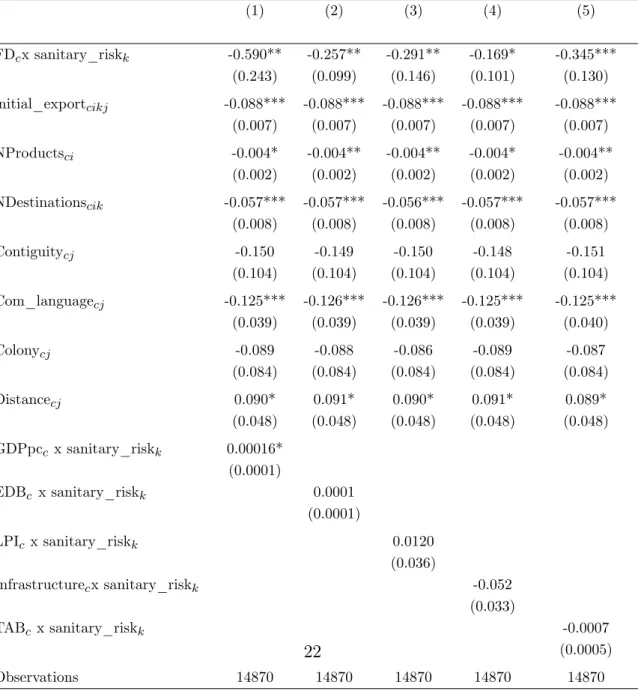
Table 3: Robustness II, Survival and Institutional Development.
The dependent variable is the hazard rate of trade relationships for product k of …rm i operating in country c to destination country j: All regressions are estimated using the Cox Proportional Hazard Model. We control for destination country, year, …rm and exporting country x HS2 …xed e¤ects, and allow the baseline hazard to vary across HS8 product (strata). The variables of interest are de…ned in Table 1. Additional controls include the interaction between the sanitary risk and : country c overall economic development (GDPpcc x sanitary_riskc), country c Ease
of Doing Business index (EDBcx sanitary_riskc ), country c Logistic Performance index (LPIcx
sanitary_riskc), country c level of infrastructure (Infrustructurecx sanitary_riskc), and country
c level of trade related infrustructure (TABcx sanitary_riskc). Robust standard errors clustered
at (exporting country) HS4 sector level are in parentheses. *, **, and *** denote statistical signi…cance at the 10%, 5%, and 1% levels, respectively.
(1) (2) (3) (4) (5) FDcx sanitary_riskk -0.590** -0.257** -0.291** -0.169* -0.345*** (0.243) (0.099) (0.146) (0.101) (0.130) initial_exportcikj -0.088*** -0.088*** -0.088*** -0.088*** -0.088*** (0.007) (0.007) (0.007) (0.007) (0.007) NProductsci -0.004* -0.004** -0.004** -0.004* -0.004** (0.002) (0.002) (0.002) (0.002) (0.002) NDestinationscik -0.057*** -0.057*** -0.056*** -0.057*** -0.057*** (0.008) (0.008) (0.008) (0.008) (0.008) Contiguitycj -0.150 -0.149 -0.150 -0.148 -0.151 (0.104) (0.104) (0.104) (0.104) (0.104) Com_languagecj -0.125*** -0.126*** -0.126*** -0.125*** -0.125*** (0.039) (0.039) (0.039) (0.039) (0.040) Colonycj -0.089 -0.088 -0.086 -0.089 -0.087 (0.084) (0.084) (0.084) (0.084) (0.084) Distancecj 0.090* 0.091* 0.090* 0.091* 0.089* (0.048) (0.048) (0.048) (0.048) (0.048) GDPpcc x sanitary_riskk 0.00016* (0.0001) EDBc x sanitary_riskk 0.0001 (0.0001) LPIc x sanitary_riskk 0.0120 (0.036) Infrastructurecx sanitary_riskk -0.052 (0.033) TABc x sanitary_riskk -0.0007 (0.0005) 22
6.3
Destination Markets Demand for Quality
In this section we provide evidence that the risk index, while computed using the EU food safety regulations as a benchmark, does not capture speci…cities of the EU market only (Table 4). Columns with odd numbers report results when controlling for …rm destination and year …xed e¤ects and stratifying across HS4. This allows us to recover the main e¤ect of the risk index. Columns with even numbers report results under our preferred speci…cation (column (3) in Table 1). Destination markets are: non European countries only (column 1-2), high income countries only (column 3-4), low income coun-tries only (column 5-6), and …nally African councoun-tries only (column 7-8). First, results indicate that the risk index is not speci…c to the EU market. The coe¢ cient on our in-teraction term (F Dc sanitary_riskk) is negative and signi…cant at the 1% level when
excluding EU countries from the sample (column 1-2). Second, the coe¢ cients on risk and its interaction with …nancial development are not signi…cant when considering low income or African countries only as destination markets. Suggesting that food safety matters solely for developed countries, restricting the role of …nancial development for those markets only. Precisely, it re‡ects the stronger concerns of developed economies for human health and food safety issues. Such results …nd support in the trade and qual-ity literature. Hallak (2006) …nds some evidence that richer countries have relatively greater demand for high quality goods–quality being measured by unit values.
6.4
Survival and Firms’Type
Among exporting …rms 17% export to African markets only. Obviously, such …rms face very di¤erent food safety requirements in comparison to …rms servicing developed countries. We re-estimate our main speci…cation considering …rms that export only to Africa. The level of …nancial development does not seem to matter for …rms that only export to the African region (column 1 in Table 5). Yet, it does for …rms that export to other regions. In column (2) we rerun estimation dropping …rms that export only to Africa from the total …rms sample. The coe¢ cient on our interaction term after dropping the "only-Africa" exporters increases nearly twofold in magnitude (from to 0:26to 0:46). Additionally, there is evidence of capital ‡ows from multinational …rm to a¢ liates as potential channels to overcome imperfections in local capital markets (Desai, Folay and Hines, 2009).
Yet, our index does not account for trade …nancing associated with intra-…rm trade by multinational corporations or trade related to foreign direct investment. Additionally, large trading companies may enjoy facilitated access to trade credit. To insure our results are not driven by multinationals or large trading companies24, we alternatively drop them from our sample and re-estimate our preferred speci…cation. Results are reported in column (3) and (4) and show that this is not the case. Finally, …rms exhibiting multiple-spell trade relationships25 may spread the investment and operating costs, to come to compliance with food safety requirements, over di¤erent spells. We drop observations corresponding to higher order spells from our sample. Column (5) show that our results remain the same.
6.5
Perishable versus "Risky" Products
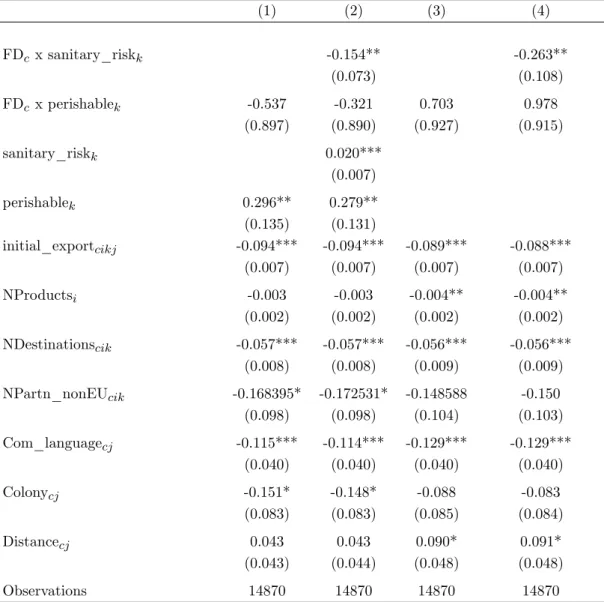
Lastly, to insure that the risk index is not picking up on other product characteristics that may a¤ect their survival, we include as a control variable, a perishability index (perishablek). We expect perishable products–that cannot be stored without refrigerator facilities–to survive less. We interact …nancial development with the perishability index
(F Dc perishablek) and include it in place of our main interaction term. Column (1)
and (2) in Table 6, report results controlling for …rm destination and year …xed e¤ects and stratifying across HS4. In column (3) and (4) we stratify across HS8. Perishable products survive less (column 1). However, the level of …nancial development does not seem to matter. After controlling for the perishable nature of product, the coe¢ cients on risk and risk interacted with …nancial development remain signi…cant and of expected signs26.
24We identify multinational companies based on their names; for example "NESTLE", or
"COL-GATE" are identi…ed as multinationals. Trading companies are identi…ed using search for keywords in the …rm names; for example "EXPORT TRADING CO. LTD."
25If a …rm x destination x product triplet enters more than once in the dataset, we say it exhibits
multiple spells of service.
T a b le 4 : R o b u st n es s II I, S u rv iv a l a n d D es ti n a ti o n M a rk et s. The de p en den t v ari ab le is th e h a zar d rate of trade re latio n sh ip s for pro d uct k of … rm i op er ating in coun tr y c to de sti n at ion coun tr y j : Al l regress ion s are esti m a te d u sing the Co x Prop or tional Hazar d Mo de l. W e con tro l for des tin a tion coun try , y ear, … rm and exp ort ing cou n try x HS 2 … x ed e¤ ects, an d al lo w the b a seli n e haz a rd to v ar y ac ross H S 4 subs ectors (o d d n u m b er ed col u mns ) an d across HS 8 pr o d uct (ev en n um b er ed co lum ns). The v ar iables o f in teres t a re d e… ned in T able 1. Sample des cri p tion: Destination mar k et s co n side re d are: non EU coun tr ies (column s 1 -2 ), h igh inc o m e coun tries (columns 3-4), lo w in come coun tr ies (column s 5 -6 ), and Af rican coun tries (column s 7-8). Robu st stand a rd er ror s cl u stered at (exp or ting coun tr y) HS4 se ctor lev el ar e in p ar en the ses . *, ** , an d *** d enote sta tistical signi… ca n ce at th e 10%, 5%, and 1% lev els, res p ectiv ely . (1) (2) (3) (4 ) (5 ) (6) (7) (8) non EU non EU H igh Inc High In c Lo w In c Lo w In c AF A F cou n tri es cou n tr ies coun tr ies coun tr ies coun tr ies coun tr ies coun tr ies coun tr ies FD c x sanitar y_r isk k -0.104 -0.267 ** -0.29 4* -0.38 1** 0.021 0.026 0.01 7 0.003 (0. 076) (0. 116) (0 .174) (0 .167) (0.098) (0.130) (0.092 ) (0. 117) san itar y_r isk k 0.0 12* 0.0 39** -0.000 1 0.001 (0. 007) (0 .019) (0.009) (0.008 ) initi al_ ex p o rtcik j -0.086 *** -0.08 4*** -0.09 8*** -0.0 92*** -0.0 90*** -0. 099*** -0. 084*** -0.08 7*** (0. 007) (0. 007) (0 .009) (0 .011) (0.011) (0.011) (0.009 ) (0. 010) NPro d ucts ci -0.002 -0.00 2 -0.010 *** -0.011 *** 0 .006** * 0.007* ** 0.00 2 0 .004* (0. 002) (0. 002) (0 .003) (0 .003) (0.002) (0.002) (0.002 ) (0. 002) NDestinati on scik -0.049 *** -0.04 7*** -0.05 1*** -0.0 55*** -0.0 38*** -0. 033*** -0. 039*** -0.03 1*** (0. 008) (0. 009) (0 .007) (0 .010) (0.008) (0.010) (0.007 ) (0. 009) Con tiguit ycj -0.120 -0.11 3 -0.1 92 -0. 163 -0. 095 -0.09 7 (0. 100) (0. 108) (0.127) (0.133) (0.108 ) (0 .119) Com_l an g u age cj -0.096 ** -0.10 5* -0.0 44 -0. 065 -0.2 18*** -0.2 84*** -0. 200*** -0.23 6*** (0. 048) (0. 054) (0 .062) (0 .063) (0.052) (0.058) (0.048 ) (0. 053) Colo n ycj -0.18 4** -0.1 58* (0. 090) (0. 094) Di st an cecj 0.0 88* 0.1 16** 0.2 12*** 0. 233** 0. 019 0 .070 0 .097* 0. 122* (0. 048) (0. 056) (0 .075) (0 .095) (0.066) (0.067) (0.055 ) (0. 064) Obse rv ations 783 1 78 31 10 220 10 220 3 010 3010 3690 36 90
Table 5: Robustness IV, Survival and Firms’Type.
The dependent variable is the hazard rate of trade relationships for product k of …rm i operating in country c to destination country j: All regressions are estimated using the Cox Proportional Hazard Model. We control for destination country, year, …rm and exporting country x HS2 …xed e¤ects, and allow the baseline hazard to vary across HS8. Sample description: …rms only exporting to African countries (column 1), total sample excuding …rms only exporting to African countries (column 2), total sample excuding trading and international companies (columns 3-4), and total sample excuding higher order spells (column 7). Robust standard errors clustered at (exporting country) HS4 sector level are in parentheses. *, **, and *** denote statistical signi…cance at the 10%, 5%, and 1% levels, respectively.
(1) (2) (3) (4) (5)
Firms Firms No No …rst
exporting to exporting to international trading spell Africa only di¤erent regions companies companies only FDc x sanitary_riskk 0.018 -0.461*** -0.243** -0.235** -0.237** (0.142) (0.151) (0.108) (0.107) (0.118) initial_exportcikj -0.087*** -0.094*** -0.089*** -0.089*** -0.093*** (0.015) (0.008) (0.007) (0.008) (0.007) NProductsci 0.010*** -0.016*** -0.004 -0.002 -0.006** (0.003) (0.003) (0.003) (0.003) (0.003) NDestinationscik -0.033*** -0.046*** -0.057*** -0.060*** -0.055*** (0.010) (0.010) (0.010) (0.009) (0.010) Contiguitycj -0.085 -0.204 -0.086 -0.152 -0.110 (0.155) (0.170) (0.125) (0.109) (0.102) Com_languagecj -0.225*** -0.074 -0.072 -0.124*** -0.113*** (0.065) (0.048) (0.045) (0.044) (0.043) Colonycj -0.123 -0.166** -0.076 -0.103 (0.088) (0.083) (0.085) (0.104) Distancecj 0.109 0.066 0.141*** 0.085* 0.121*** (0.084) (0.064) (0.052) (0.050) (0.047) Observations 2494 12376 14163 13522 13191
Table 6: Robustness V, Survival Sanitary Risk and Product Perishability. The dependent variable is the hazard rate of trade relationships for product k of …rm i operating in country c to destination country j:All regressions are estimated using the Cox Proportional Hazard Model. We control for destination country, year, …rm and exporting country x HS2 …xed e¤ects, and allow the baseline hazard to vary across HS4 (columns 1-2) and across HS8 (columns 3-4). We control for alternative product characteristics, their per-ishability (perper-ishabilityk). We interact the level of …nancial development in country c with
tthe perishability index (FDc perishabilityk). In addition we include number of non EU
partners to control for altrenative markets where exporters can sell their products. Robust standard errors clustered at (exporting country) HS4 sector level are in parentheses. *, **, and *** denote statistical signi…cance at the 10%, 5%, and 1% levels, respectively.
(1) (2) (3) (4) FDc x sanitary_riskk -0.154** -0.263** (0.073) (0.108) FDc x perishablek -0.537 -0.321 0.703 0.978 (0.897) (0.890) (0.927) (0.915) sanitary_riskk 0.020*** (0.007) perishablek 0.296** 0.279** (0.135) (0.131) initial_exportcikj -0.094*** -0.094*** -0.089*** -0.088*** (0.007) (0.007) (0.007) (0.007) NProductsi -0.003 -0.003 -0.004** -0.004** (0.002) (0.002) (0.002) (0.002) NDestinationscik -0.057*** -0.057*** -0.056*** -0.056*** (0.008) (0.008) (0.009) (0.009) NPartn_nonEUcik -0.168395* -0.172531* -0.148588 -0.150 (0.098) (0.098) (0.104) (0.103) Com_languagecj -0.115*** -0.114*** -0.129*** -0.129*** (0.040) (0.040) (0.040) (0.040) Colonycj -0.151* -0.148* -0.088 -0.083 (0.083) (0.083) (0.085) (0.084) Distancecj 0.043 0.043 0.090* 0.091* (0.043) (0.044) (0.048) (0.048) Observations 14870 14870 14870 14870