HAL Id: hal-02918450
https://hal.archives-ouvertes.fr/hal-02918450
Submitted on 23 Sep 2020HAL is a multi-disciplinary open access archive for the deposit and dissemination of sci-entific research documents, whether they are
pub-L’archive ouverte pluridisciplinaire HAL, est destinée au dépôt et à la diffusion de documents scientifiques de niveau recherche, publiés ou non,
Photophysical Investigation of Iron(II) Complexes
Bearing Bidentate Annulated Isomeric Pyridine-NHC
Ligands
Kevin Magra, Mohamed Darari, Edoardo Domenichini, Antonio
Francés-Monerris, Cristina Cebrian, Marc Beley, Mariachiara Pastore,
Antonio Monari, Xavier Assfeld, Stefan Haacke, et al.
To cite this version:
Kevin Magra, Mohamed Darari, Edoardo Domenichini, Antonio Francés-Monerris, Cristina Cebrian, et al.. Photophysical Investigation of Iron(II) Complexes Bearing Bidentate Annulated Isomeric Pyridine-NHC Ligands. Journal of Physical Chemistry C, American Chemical Society, In press, 124 (34), pp.18379-18389. �10.1021/acs.jpcc.0c03638�. �hal-02918450�
Photophysical Investigation of Iron(II) Complexes
bearing Bidentate Annulated Isomeric
Pyridine-NHC Ligands
Kevin Magra,a Mohamed Darari,b Edoardo Domenichini,c Antonio Francés-Monerris,d,e
Cristina Cebrián,a Marc Beley, b Mariachiara Pastore,d Antonio Monari,d Xavier Assfeld,d Stefan
Haackec and Philippe C. Gros*,b
a Université de Lorraine, CNRS, L2CM, F-57000 Metz, France
b Université de Lorraine, CNRS, L2CM, F-54000 Nancy, France
c Université de Strasbourg, CNRS, IPCMS, F-67000 Strasbourg, France
d Université de Lorraine, CNRS, LPCT, F-54000 Nancy, France
e Departamento de Química Física, Universitat de València, 46100 Burjassot, Spain
AUTHOR INFORMATION
Corresponding Author
*Philippe C. Gros: philippe.gros@univ-lorraine.fr
KEYWORDS. iron complexes, fused NHC, photophysics, TD-DFT, Minimum Energy Path, decay process
ABSTRACT
The possibility of achieving luminescent and photophysically active metal-organic compounds relies on the stabilization of charge transfer states and kinetically and thermodynamically blocking non-radiative dissipative channels. In this contribution we explore the behavior of bidentate iron complexes bearing N-heterocyclic carbene ligands with extended conjugation systems by a multidisciplinary approach combining chemical synthesis, ultrafast time-resolved spectroscopy, and molecular modeling. Lifetimes of the metal-to-ligand charge transfer and metal-centered states reaching up to ≈20 picoseconds are evidenced, while complex decay mechanisms are pointed out, together with a possible influence of the facial and meridional isomerism. The structural degrees of freedom driving the non-radiative processes are highlighted and their rigidification is suggested as an effective way to further increase the lifetimes.
INTRODUCTION
N-heterocyclic carbenes (NHCs) are highly popular ligands in catalysis due to their strong σ-donating properties and low dissociation rates.1–6 Recently, these ligands have allowed to strongly
improve the photophysical properties of iron(II) complexes making them appealing for optically active devices or as cheaper and non-toxic alternative to ruthenium-based sensitizers in solar energy applications.7–14 However, controlling the photophysics of first-row transition metal
complexes is challenging compared with heavier elements. For example, while ruthenium(II) polypyridyl complexes exhibit long-lived metal-to-ligand (MLCT) triplet states,15 ultrafast
analogues.16–19 However, the combination of the -deficiency of pyridine and the -donation of
NHC in pyridyl-NHC iron(II) complexes is effective in altering the energy order of the excited state manifold. Thus, important breakthroughs in increasing the MLCT lifetime have been achieved,8,20–25 from tens of picoseconds for azinyl-NHC iron(II) complexes with tridentate
C^N^C26–30 and bidentate C^N ligands31,32 to the nanosecond domain for scorpionate-like C^C^C
ligands, this latter even showing luminescent properties.33
We have recently shown that for C^N^C ligands, framing the carbene moiety with extended -conjugated systems notably stabilizes the MLCT excited state, and prevents spin crossover into the MC quintuplet 5MC, by enhancing the -back donation from the iron center to the ligand, hence
leading to prolonged excited state lifetimes.28,30 Bidentate C^N ligands also brought an
improvement by reducing the angular strain around the metal center upon coordination approaching a more ideal octahedral geometry and with a concomitant increase of the ligand field splitting.32 Thus, these findings prompted us to investigate the design of -conjugated C^N ligands
with the aim to exploit the combination of both geometric and electronic beneficial effects. Nevertheless, bidentate complexes come in a mixture of fac and mer isomers, which may complicate the analysis of their spectroscopic and electrochemical properties. The effect of such isomerism has been studied in recent publications dedicated to the excited state dynamics of the parent C0 complex (Figure 1) featuring less than 10% fac configuration,31,34 and a 100% fac form
of C0 obtained by a tripodal interconnection of the three ligands.31,32 Irrespective of the ligand
arrangement, two excited states T1 and T2 are populated after intersystem crossing from the
optically active 1MLCT manifold. The computational analysis revealed that their character is still
MLCT at the beginning of the excited-state relaxation pathway. However, the triplet manifold evolves elongating a Fe-N bond gradually and adiabatically increasing the MC character of the
states, reaching spin-crossover regions and farther singlet-triplet crossings that mediate the ground state recovery. In addition, femtosecond spectroscopy showed that the two T1 and T2 states differ
in their recovery times, which are in the 2-3 and ≈15 ps range, respectively, regardless of the isomer considered. The isomerism solely modulates the relative population of these two excited-state deactivation channels, the mer form exhibiting a globally faster decay.
Herein we report the synthesis and the characterization of the mostly mer iron(II) complexes C1,
C2 and C3, with pyridyl-NHC bidentate ligands containing benzimidazole (BIm) and
imidazo[1,5-a]pyridine-based (ImP) conjugated carbene moieties (Figure 1). The photophysical properties of the complexes have been investigated by ultrafast time-resolved spectroscopy and TD-DFT calculations. Unlike previous tridentate complexes studied by our group,28,30 and despite
significant modifications of the ground state absorption spectra, it turns out that the substitutions of imidazole by BIm or ImP do not have a significant effect on the excited state electronic structure and relaxation dynamics. The strategy based on altering the relative positions of the MC and MLCT energy levels by acting on the ligand field splitting at various levels has been instrumental in allowing the breakthrough of avoiding the spin-crossover transition and leading to the increase of the MLCT lifetimes from the sub-picosecond regime to tens of picoseconds.8,21,28–30,33 However,
it appears that, for complexes with 3 or 4 carbene bonds, this strategy is reaching its limit, as also shown by the present results. To further increase the lifetimes, a kinetic blocking of the geometrical degrees of freedom leading to the deactivation should be effective, as confirmed by the general better performance of the more rigid tridentate complexes. Indeed, iron compounds showing lifetimes at the nanosecond scale present multiple -stacking interactions participating to the rigidification of the coordination sphere.22 The results presented in the present article allow for a
provide supplementary evidences for a likely needed change in the paradigm guiding the rational and efficient design of photoactive iron compounds.
N N N N N N N N N Fe2+ N N N N N N N N N Fe2+ N N N N N N N N N Fe2+ R R R C2, R =H C3, R =Me C1 C0
Figure1. Complexes studied in this work. Counter ion is PF6- in every case
MATERIALS AND METHODS
Solvents and commercially available reagents were used as received. Monomode microwave irradiations were conducted using an Anton Paar Monowave 450 equipped with a noninvasive IR sensor. Thin layer chromatography (TLC) was performed by using silica gel 60 F-254 (Merck) plates and visualized under UV light. Chromatographic purification was performed by using silica gel 60 (0.063–0.2 mm/70–230 mesh). 1H (400 MHz) and 13C NMR (100 MHz) spectra were taken
on an AC Bruker spectrometer at ambient temperature. The chemical shifts (δ), were calibrated by using either tetramethylsilane (TMS) or signals from the residual protons of the deuterated solvents and are reported in parts per million (ppm) from low to high field. High-resolution mass spectrometry (HRMS) data was obtained by using Bruker micrOTOF-Q spectrometer. UV-vis spectra were recorded in a 1 cm path length quartz cell on a Varian Cary 50 spectrophotometer. Cyclic voltammetry was performed on a Radiometer PST006 potentiostat using a conventional
three-electrode cell. The saturated calomel electrode (SCE) was separated from the test compartment using a bridge tube. The solutions of studied complexes (0.2 mM) were purged with argon before each measurement. The test solution was acetonitrile containing 0.1 M Bu4NPF6 as
supporting electrolyte. The working electrode was a vitreous carbon rod (1cm2) wire and the counter-electrode was a 1 cm2 Pt disc. After the measurement, ferrocene was added as the internal
reference for calibration. All potentials were quoted versus SCE. In these conditions the redox potential of the couple Fc+/Fc was found at 0.39V. In all the experiments the scan rate was 100mV/s.
Synthesis of ligands
L1.35 2-Pyridylbenzimidazole (400 mg, 2.05 mmol) and iodomethane (2.20 mL, 20.51 mmol)
were heated for 1h in 4 mL of acetonitrile at 100°C under microwave irradiation (60W). After evaporation of solvent, the resulting mixture was dissolved in water. Then, the metathesis was made by addition of saturated solution of KPF6. The solid was filtered, washed twice with Et2O,
and dried under vacuum to give a yellow powder (469 mg, 66%). 1H NMR (400 MHz, DMSO-d 6)
: δ = 10.40 (s, 1H), 8.77 (ddd, J = 0.80, 1.80, 4.80 Hz, 1H), 8.48 - 8.43 (m, 1H), 8.27 (dt, J = 8.10, 2.00 Hz, 1 H), 8.15 - 8.10 (m, 1 H), 8.01 (td, J = 8.300, 1.04 Hz, 1H), 7.82 - 7.75 (m, 2H), 7.71 (ddd, J = 7.48, 4.78, 1.04 Hz, 1H), 4.18 (s, 3H) ppm. 13C NMR (100 MHz, ACN-d3) : δ = 149.5,
147.2, 142.5, 140.6, 132.2, 129.3, 127.3, 127.1, 125.0, 116.8, 115.6, 113.8, 33.7 ppm.
L2.36 2-aminopyridine (400 mg, 4.25 mmol and paraformaldehyde (192 mg, 6.38 mmol) were
and heated for 1h at 100°C under microwave irradiation (60W). After evaporation of solvent, the resulting mixture was dissolved in water. Then, the metathesis was made by addition of saturated solution of KPF6. The solid was filtered, washed twice with Et2O, and dried under vacuum to give
yellow powder (1.43 g, 98%). 1H NMR (400 MHz, DMSO-d6) : δ = 10.57 (s, 1 H), 8.99 (s, 1 H),
8.74 (ddd, J = 4.80, 1.80, 0.80 Hz, 1 H), 8.60 (dd, J = 7.18, 0.88 Hz, 1 H), 8.29 (td, J = 7.50, 1.80 Hz, 1 H), 8.21 (d, J = 8.10 Hz, 1 H), 7.93 (d, J = 9.32 Hz, 1 H), 7.73 (ddd, J = 7.43, 4.78, 0.88 Hz, 1 H), 7.34 (ddd, J = 9.30, 2.30, 0.80 Hz, 1 H), 7.28 (td, J = 6.80, 1.30 Hz, 1 H) ppm.
L3.36 2-aminopyridine (400 mg, 4.25 mmol and paraformaldehyde (192 mg, 6.38 mmol) were
heated for 30 min in 4 mL of acetonitrile at 80°C under microwave irradiation (60W). Then 2-acetylpyridine (0.48 mL, 4.25 mmol) and a solution of HCl 3M in acetonitrile (2 mL) were added and heated for 1h at 100°C under microwave irradiation (60W). After evaporation of solvent, the resulting mixture was dissolved in water. Then, the metathesis was made by addition of saturated solution of KPF6. The solid was filtered, washed twice with Et2O, and dried under vacuum to give
yellow powder (1 g, 67%). 1H NMR (400 MHz, DMSO-d6) : δ = 10.16 (s, 1H), 8.90 - 8.74(m, 1H),
8.60 - 8.45 (m, 1H), 8.29 (dt, J = 7.81, 1.76 Hz, 1H), 8.03 (d, J = 8.56 Hz, 1H), 7.99–7.93 (m, 1H), 7.80 (ddd, J = 7.55, 4.78, 1.01 Hz, 1H), 7.32–7.19 (m, 2H), 2.71 (s, 3H) ppm.
Synthesis of complexes
C1. Using Schlenk techniques, ligand L1 (200 mg, 0.56 mmol) and FeCl2 (24 mg, 0.19 mmol)
were dissolved in 2 mL of DMF. Potassium tert-butoxide (70 mg, 0.62 mmol) was then added. The dark red solution was stirred at room temperature (rt) for 10 min. After evaporation of DMF, the residue was purified by column chromatography using water/acetone/KNO3 (10/2/1) as eluent.
was filtered, washed twice with Et2O, and dried under vacuum to give a non-separable mixture of
both fac- and mer-C1 in 1:6 ratio (60 mg, 33%) as an orange solid. 1H NMR (400 MHz, ACN-d 3) : δ = 8.51 (d, J = 8.31 Hz, 1 H), 8.44 (d, J = 8.30 Hz, 1 H), 8.32 (d, J = 7.81 Hz, 1 H), 8.11–8.28 (m, 7 H), 8.08 (d, J = 4.78 Hz, 1 H), 7.91–8.00 (m, 2 H), 7.43 - 7.68 (m, 13 H), 7.21–7.29 (m, 2 H), 7.10 (d, J = 5.30 Hz, 1 H), 6.88–7.00 (m, 3 H), 3.41 (s, 3 H), 3.19 (s, 9 H), 2.94 (s, 3 H), 2.89 (s, 3 H) ppm. 13C NMR (100 MHz, ACN-d 3) : δ = 218.2, 218.2, 215.7, 215.7, 157.4, 156.9, 156.3, 155.9, 155.8, 155.0, 152.4, 150.8, 142.2, 141.5, 141.1, 140.0, 140.0, 139.7, 139.6, 139.2, 132.9, 132.5, 132.5, 132.4, 125.9, 125.9, 125.7, 125.7, 125.6, 125.5, 125.3, 124.9, 124.6, 124.0, 123.4, 122.8, 114.7, 114.4, 113.9, 133.5, 113.2, 113.1, 112.5, 122.4, 112.3, 111.9, 111.7, 111.2, 34.3, 34.0, 32.5, 32.4 ppm. HRMS calcd for C39H33FeN9P2F12 m/z : 341.6099 [M – 2PF6]2+. Found
341.6104.
C2. The procedure was the same as for C1 using L2 (600 mg, 1.76 mmol), FeCl2 (74 mg, 0.58
mmol) and potassium tert-butoxide (217 mg, 1.94 mmol) in 6 mL of DMF. The column chromatography was performed with water/acetone/KNO3 (9/2/1) as eluent. A non-separable
mixture of both fac- and mer-C2 in 1:3 ratio (220 mg, 38%) was obtained as an orange solid. 1H
NMR (400 MHz, ACN-d3) : δ = 8.65 (s, 1 H), 8.55 (s, 1 H), 8.52 (s, 1 H), 8.46 (s, 1 H), 8.12–8.31 (m, 5 H), 7.94–8.04 (m, 4 H), 7.82 (dd, J=5.80, 0.80 Hz, 1 H), 7.57 (td, J = 9.30, 1.30 Hz, 2 H), 7.47 (d, J = 9.30 Hz, 2 H), 7.29–7.37 (m, 3 H), 7.14 (d, 1 H), 6.99–7.10 (m, 3 H), 6.78–6.94 (m, 4 H), 6.32 (m, 4 H), 5.99 (dd, J = 7.30, 1.00 Hz, 1 H), 5.70 (dd, J = 7.50, 1.00 Hz, 1 H), 5.62 (dd, J = 7.30, 1.00 Hz, 1 H) ppm. 13C NMR (100 MHz, ACN-d 3) : δ = 200.2, 198.4, 195.7, 195.0, 194.1, 157.6, 156.6, 156.4, 155.9, 155.5, 154.6, 153.1, 151.6, 142.1, 141.3, 141.1, 140.1, 136.5, 136.4, 136.3, 136.2, 126.0, 125.9, 125.6, 125.3, 125.2, 125,0, 125.0, 124.9, 124.8, 124.8, 124.7, 124.1,
120.6, 120.5, 120.5, 120.5, 116.9, 116.7, 116.2, 115.9, 114.9, 114.4, 114.4, 113.9, 110.6, 109.6, 109.5 ppm. HRMS calcd for C36H27FeN9P2F12 m/z : 320.5864 [M – 2PF6]2+. Found 320.5856.
C3. The procedure was the same as for C1 using L3 (600 mg, 1.69 mmol), FeCl2 (70 mg, 0.56
mmol) and potassium tert-butoxide (209 mg, 1.86 mmol) in 6 mL of DMF. The column chromatography was performed with water/acetone/KNO3 (9/2/1) as eluent. A non-separable
mixture of both fac- and mer-C3 in 1:4 ratio (153 mg, 27%) as an orange solid was obtained. 1H
NMR (400 MHz, ACN-d3) : δ = 8.42 (d, J = 8.55 Hz, 1H), 8.31 (d, J = 8.55 Hz, 1H), 8.18–8.06 (m, 4H), 7.94–7.87 (m, 2H), 7.83 (dd, J = 5.54, 1.76 Hz, 1H), 7.46–7.39 (m, 3H), 7.35 (s, 1H), 7.33 (s, 1H), 7.29–7.24 (m, 2H), 7.15 (dd, J = 5.55, 1.46 Hz, 1H), 7.11 (dd, J = 6.05, 1.08 Hz, 1H), 7.02 (t, J = 6.54 Hz, 1H), 6.96 (t, J = 6.51 Hz, 1H), 6.77–6.62 (m, 4H), 6.28 (t, J = 6.24 Hz, 1H), 6.22 - 6.07 (m, 4H), 5.85 (d, J = 7.46 Hz, 1H), 5.55 (d, J = 7.46 Hz, 1H), 5.51 (d, J = 7.46 Hz, 1H), 3.02 (s, 3H), 2.92 (s, 6H), 2.86 (s, 3H) ppm. 13C NMR (100 MHz, ACN-d 3) : δ = 200.2, 198.5, 197.6, 195.8, 194.1, 157.9, 157.8, 156.8, 157,0 156.7, 155.8, 153.3, 151.8, 141.5, 140.8, 140.5, 139.4, 133.2, 133.2, 133.0, 132.9, 125.6, 125.5, 125.0, 125.0, 124.7, 142.7, 124.4, 123.7, 122.9, 122.8, 122.8, 122.7, 122.4, 122.3, 121.4, 121.2, 119.8, 119.7, 119.7, 116.7, 116.6, 116.6, 116.1, 116.0, 116.0, 115.7, 115.4, 12.3, 12.1, 12.1, 12.0 ppm. HRMS calcd for C39H33FeN9P2F12 m/z :
341.6102 [M – 2PF6]2+. Found 341.6099.
Computational details
The Franck-Condon geometries (S0 min) of the fac and mer isomers of C1 and C2 have been
optimized using the DFT/B3LYP functional in combination with the 6-31+G(d,p), as implemented in the GAUSSIAN 09 (D.01 revision) software package.37 This computational protocol has been
ligands.23,28,30–32,34 Note that only C1 and C2 complexes have been considered in the computational
analysis since no significant differences, from a qualitative point of view, have been found in the photophysical properties of C2 and C3, given the similarities in the chemical structure.
Vertical absorption energies at the Franck-Condon region have been computed through the TD-DFT method employing the Tamm-Dancoff approximation.38 The exchange correlation functional
HCTH407 (hereafter, TD-HCTH)39 have been used given the good description of the excited states
provided by this method in similar Fe-NHC systems as documented in previous works.8,28,31,27,40
The theoretical spectra reported in ESI have been obtained by sampling the nuclear density of the Franck-Condon region by means of a semiclassical Wigner distribution of 20 structures.
Right after, the excitation energies have been convoluted with Gaussian functions with a full width at half-length of 0.3 eV. A total number of 30 singlet-singlet electronic transitions have been computed for each geometry.
Note that the states displayed in Figure 7 are labelled according to the multiplicity of the state and the adiabatic energetic ordering without considering the nature of them. The nature of the excitations progressively evolves along the potential energy surfaces31 (see Figures S28-S30) and
the nature of the excitations have been determined by computing the NTOs,41,42 via
post-processing of their density matrices obtained with the TD-HCTH method, using the NANCY_EX code.42,43 For the readers’ convenience, we remind that NTOs may be considered as the best
orbitals to describe a given electronic transition, and in contrast to the Kohn-Sham representation, often one or two couples of occupied/virtual orbitals are sufficient to fully describe the electronic density rearrangement in the excited state.
The S1 min geometries have been computed using the TD-DFT/HCTH method, whereas the T1
symmetry or geometrical constrains have been imposed in the optimizations or single-point calculations.
Femtosecond transient absorption spectroscopy
In the transient absorption setup, an amplified 5kHz Ti: sapphire laser generates 30 fs 0.5 mJ pulses to pump a commercial optical parametric amplifier (TOPAS: Light Conversion), from which 50-60 fs pulses are derived to excite the samples: 370 nm for C1, and 470 nm for C2 and C3. A white light continuum is generated in a 2 mm thick CaF2 crystal, mounted
on an oscillating loudspeaker to reduce photo-damage. The white light is optimised for minimised fluctuations (rms < 0.4% at 220 Hz). The beam is split in two: the probe that is sent through the sample, and a reference beam is used for measuring and compensating the white-light intensity fluctuations. The polarization of the probe beam is set at magic angle (54.7°) with respect to the pump.
A 1 mm path length cuvette in fused silica contains the complexes dissolved in CH3CN.
Time-resolved spectra I() are acquired in the range ≈300 nm wide window with an adjustable central wavelength as a function of pump-probe delay, by a combination of 25 cm focal length spectrometer (resolution 2 nm) and a Peltier-cooled CCD with 220 Hz acquisition rate. A second chopper blocks the pump beam at 110 Hz and a home-made software computes and displays the differential spectra ∆𝐴 𝑙𝑜𝑔 . A solvent-only sample is measured, and the data are processed to (i) remove the background at negative delay times, (ii) the solvent Raman signal and the coherent interactions of the pump and probe in the cell, (iii) to correct for the group velocity dispersion of the probe beam, characterized in the solvent-only data set. The temporal resolution is characterized
by the 50±5 fs FWHM of the solvent Raman response. For more details see Ref 44. The multi-exponential fit procedure is described in the SI.
RESULTS AND DISCUSSION
Synthesis
The ligand precursors L1, L2 and L3 required for the preparation of the target complexes have been prepared according to scheme 1. L1 was obtained in good yield by an amination-quaternarization sequence from 2-fluoropyridine. For the synthesis of L2 and L3 a construction of the imidazo[1,5-a]pyridine core was performed.45 An efficient cyclizing condensation involving
2-aminopyridine and 2-formyl or 2-acetyl pyridine afforded respectively L2 and L3 in good yields. The three target complexes C1–C3 were obtained in moderate yields by first reacting the ligand precursors with FeCl2, followed by addition of t-BuOK as the base for generation of the carbenes.
The parent compound C0 was also synthesised for the sake of comparison following our previously reported procedure.32
N NH2 1) Paraformaldehyde CH3CN, MW (60W) 80°, 30 min 2) HCl 3M in CH3CN CH3CN, MW (60W) 80°C, 40min N O R N N N N N N N N N Fe2+ N N+ N R R R R N F N N H K2CO3, 205°C, 16h 2) 1,5 eq CH3I CH3CN, MW (60W) 100°C, 1h 3) sat. KPF6 N N N+ N N N N N N N N N Fe2+ 1) FeCl2, t-BuOK DMF, rt, 10min 2) sat.KPF6 1) C1, 33% (fac:mer =1:6) L1, 66% L2, R=H, 98% L3, R=Me, 62% C2, R=H, 38%, (fac:mer = 1:3) C3, R=Me, 27% (fac:mer = 1:4)
Scheme 1. Synthesis of ligands L1, L2 and L3 and the corresponding complexes C1, C2 and C3.
Counter ion is PF6- in every case.
Electronic and electrochemical properties
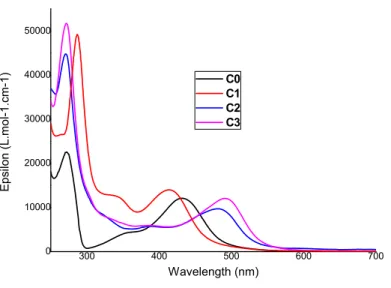
The electronic and optical properties of the C0–C3 complexes were investigated by means of steady-state UV-vis spectroscopy (Figure 2) and cyclic voltammetry (Table 1).
300 400 500 600 700 0 10000 20000 30000 40000 50000 E p silo n (L .m ol -1. cm-1 ) Wavelength (nm) C0 C1 C2 C3
Figure 2. UV-Vis spectra of C0–C3 in acetonitrile. Only the 250–700 nm window is shown.
The UV/Vis spectra of all the complexes present three evident absorption bands. The bands in the UV region, below 300 nm, correspond to * transitions localized on the ligands, and are particularly intense. Two distinct broader and less intense bands are found at longer wavelengths, corresponding to MLCT transitions, with significant shifts of the absorption maximum (max) as a
function of the specific ligand. The weaker bands peaking in the 320–420 nm range are assigned to carbene-Fe MLCT transitions,27,28 while the bands with max in the 430–600 nm area are due to
the pyridine-Fe MLCT’s. Comparison of the C0 and C1 absorption spectra shows that both MLCT bands are markedly blue-shifted when switching from the imidazolylidene (Im) to BIm due to the increased -back donation induced by the annulation of the carbene moiety.28,32 On the contrary,
the inclusion of ImP significantly red-shifts both the carbene-Fe (30–35 nm) and the pyridine-Fe (50–60 nm) absorption as compared to C0 and C1. Interestingly, the methyl substitution on ImP
The TD-DFT electronic spectra for C1 and C2 are shown in Figure S27 and are in reasonably good agreement with the experimental measurements. Computational results also allow the disentanglement of the different contributions of the fac and mer isomers: for C1, absorption of mer isomer is slightly red-shifted with respect to the fac analogue, whereas C2 exhibits an opposite trend. Indeed, the 1MLCT band of fac-C2 is red-shifted ca. 100 nm. This effect is masked in the
experimental data by the fac:mer ratio of 1:3 and, as a matter of fact, absorption of mer isomer peaking at ~500 nm dominates the spectrum of the C2 mixture. Natural transition orbitals (NTOs) confirm the 1MLCT nature of the bright states responsible for the absorptions, as displayed in
Figure S28 of the Supporting Information.
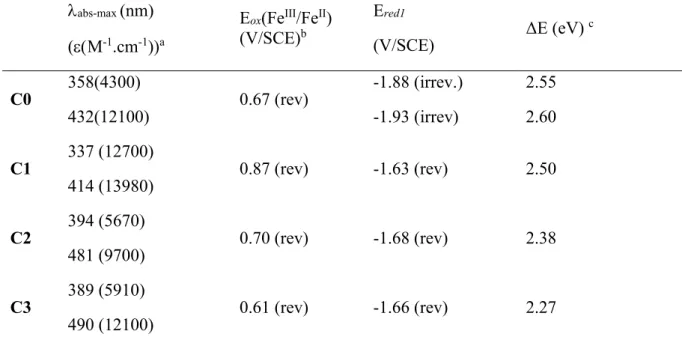
The cyclic voltammetry data (Table 1 and Figure S12–S14) globally confirm the trends underlined by the absorption spectra with a decrease of the electrochemical gap going from C0 to
C2 and C3 in agreement with the observed redshifts. The positive domain corresponds to the
reversible electron transfer of one electron per complex leading to the oxidation of Fe(II) to Fe(III). The oxidation potential is only slightly affected by switching from Im to ImP, while the further inclusion of a methyl group (C3) induces a decrease of the oxidation potential consistently with the observed redshift. On the contrary, the BIm unit results in an increase of the oxidation potential of C1 compared to C0, C2, and C3. Extending the conjugation upon annulation has been reported to increase the accepting character of BIm46 and ImP47 due to the delocalisation of the lone pairs
of the nitrogen atoms, reducing the occupation of the p carbene orbital and allowing for an
increased back-donation from the metal. However, these results highlight the remarkable differences in back-donation between both isomeric carbenes as evidenced by the distinct stabilization of the lower occupied iron orbitals (commonly referred to t2g for complexes with Oh symmetry), with BIm being the best -acceptor.
In the negative domain, two separate irreversible mono-electronic transfers are present for C0 while for C1, C2 and C3 the two waves coalesce into a bielectronic reversible process. It can be assumed that the LUMO levels are stabilized by about 0.25 eV by comparison with C0, suggesting that each electron is mainly injected into ImP or BIm moiety instead than pyridine as for C0. The increased conjugation of ImP and BIm would nicely justify the effective stabilisation of the LUMO levels in comparison to that associated to the pyridine moiety.
Table 1. Optical and electrochemical properties of the studied complexes
abs-max (nm)
(M-1.cm-1))a
Eox(FeIII/FeII)
(V/SCE)b
Ered1
(V/SCE) ΔE (eV)
c C0 358(4300) 432(12100) 0.67 (rev) -1.88 (irrev.) -1.93 (irrev) 2.55 2.60 C1 337 (12700) 414 (13980) 0.87 (rev) -1.63 (rev) 2.50 C2 394 (5670) 481 (9700) 0.70 (rev) -1.68 (rev) 2.38 C3 389 (5910) 490 (12100) 0.61 (rev) -1.66 (rev) 2.27
a Measured in CH3CN at 25 °C. bFirst oxidation potential. Potentials are quoted vs SCE. Under
these conditions, E1/2 (Fc+/Fc) = 0.39V/S.C.E. Recorded in CH3CN using Bu4N+PF6- (0.1M) as
supporting electrolyte at 100 mV. s-1. c Electrochemical band gap (E =Eox –Ered1)
Time-resolved spectroscopy
a fac-only version of it,31,32 these experiments were expected to reveal an extension of the excited
state lifetime due to the fusion of a phenyl group to the imidazole part of the ligands, as observed for tridentates. Two main questions arise: How do these modified ligands change the excited state relaxation? Is the scenario of parallel population and decay of two excited states reported for C0 and fac-only C0 also valid for C1–C3?
Transient absorption measures the photo-induced changes of the optical density or absorbance A and can be expressed by:
Δ𝐴 𝜆, 𝑡 𝑑 ∑ 𝜖 𝜆, 𝑡 Δ𝑐 𝑡 (1)
with d being the sample thickness. The sum runs over all molecular electronic states i whose population is changed by the laser excitation at t=0, and the subsequent photoreactions and their kinetics, as expressed by the molar concentration change ci(t). The latter is positive for excited
state population, leading to positive excited state absorption (ESA), and negative for the ground state population, c0(t=0)<0, due to the partial depletion of the ground state by the laser excitation
leading to ground state bleach (GSB) signals.
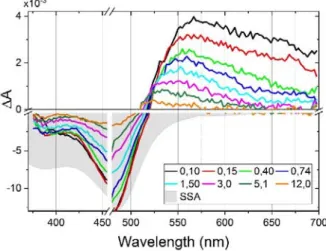
As an example, Figure 3 displays the transient absorption spectra of C2 for time delays covering the first 12 ps after excitation with a 40 fs pulse at 470 nm. A 20 nm spectral range around this wavelength is dominated by scattered pump laser light, and therefore not displayed. A broad ESA band dominates the signal for>520 nm, while GSB is dominant for shorter wavelengths, leading to A<0. The grey area is the inverted ground state absorption spectrum (SSA), normalised such as to fit the GSB amplitude at 485 nm. The neg. A portion is spectrally significantly sharper than the SSA, indicating, according to eq. (1), the contribution of ESA components, as is clearly visible for>520 nm, but hidden for shorter wavelengths where GSB dominates. Such an overlap of
excited state and ground state signals is a general limitation of TAS, leading to uncertainties as will be discussed below.
The time-dependent A spectra of C3 are like the one of C2 (Fig. S15). For C1, the ESA/GSB pattern is obviously blue-shifted according to the SSA (Fig. 2). The dynamic changes of the ESA spectra are more pronounced than for C2 and C3, and resemble the evolution of C0.31
Figure 3. Transition absorption spectra of complex C2 during the first 12 ps. Shaded area is the
inverted steady-state absorption spectrum (SSA) scaled to match the GSB max. Note the break in the y-axis, and the different scales for the positive and negative signals. The 460–480 nm range is disregarded due to excessive pump light scattering. The progressive change in the spectral shape of the positive ESA is discussed in terms of the superposition and population of two excited states T1 and T2. The signal decays dominantly on a ≈3 ps time scale.
A detailed inspection of the spectral features of C2 reveals important information about the excited state evolution. We see that ESA and GSB decay on three different time scales. The ESA amplitude decays by half already in the first 0.4 ps, and the spectral width reduces since the decay is most prominent for >600nm. The negative A part decreases by not more than 10% during
spectrum slightly blue shifts, as can also be seen by the ESA–GSB crossover point (A=0) shifting by 5 nm to the blue. A third stage of A decay proceeds on a slower time scale of ≈10 ps, with the ESA further evolving in shape and energy. Qualitatively, the same behaviour is observed for C1 and C3 (Fig. S15).
Figure 4 depicts kinetic traces for all four complexes C0–C3 at selected wavelengths. A quick glance shows that the BIm and ImP moieties have only minor effects on the excited state kinetics. In particular, the kinetic traces in the top and bottom panels highlighting dominant excited state decay (ESA) and ground state repopulation (GSB) almost overlay. The middle panel shows the GSB/ESA crossover region, highlighting the above described spectral blue shift. On a timescale of 2–3 ps, the positive ESA contribution rises turning the signal from dominant GSB (A<0) to dominant ESA (A>0).
Figure 4. Comparison of kinetic traces for complexes C0–C3 at selected wavelengths (C0-black;
C1-red; C2-blue; C3-green). Top: early-delay ESA maximum, middle: GSB-ESA crossover
region, bottom: long-wavelength GSB tail.
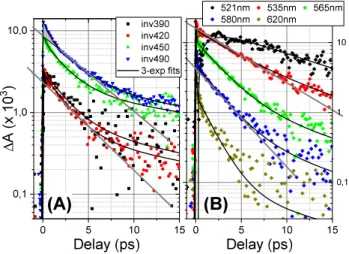
The kinetic transients of C2 are reported in Figure 5 together with 3-exponential fits, convoluted by the instrument response function (50 fs FWHM, see SI for details). Plotted on a semi-log scale, the relative contributions of the three different time scales are particularly apparent for the GSB plotted with an inverse sign for the logarithmic intensity scale (Fig. 5A). A straight line is plotted as a guide-to-the eye, the slope of which corresponds to a ≈3 ps decay time, but a faster sub-picosecond decay and a slower >10 ps decay time are clearly visible. For the dominant ESA wavelengths (Fig. 5B), the guide-to-the-eye indicates that the decay is wavelength dependent, with faster decays observed for longer wavelengths, consistent with the qualitative inspection of the time-resolved spectra (Fig. 3).
Figure 5. Kinetic transients for C2 and 3-exponential fits in the GSB (A) and dominant ESA(B)
regions, plotted on logarithmic intensity scale, highlighting the multi-exponential decay. (A): Selected traces of the GSB region, plotted with inverted sign. Lines correspond to a 3.0 ps decay.
All kinetic traces can be well fitted by a sum of three exponentials with wavelength-dependent amplitudes and decay constants, ∑ 𝐴 𝜆 𝑒 ⁄ , convoluted with a Gaussian instrument response function (width 50 fs). The results of these fits are plotted in Figure 6A, and detailed plots of the fit curves and their residuals can be found in the SI, for C1 and C3 (Fig. S16 and S17). Since the spectral and kinetic evolution is very similar among the complexes, we discuss the fit results only for C2. The shortest decay time 1 is found in the 0.1–0.2 ps range and shows slightly larger
values (0.4 ps) only for the range of maximum negative A (450–500 nm), where the signal-to-noise ratio is highest. The amplitudes of 1 are not displayed since their values are strongly
wavelength-dependent and no clear interpretation can be given. For almost all wavelengths, 2 is
the dominant decay component (A2 > 3xA3). Its value is slightly wavelength-dependent, with an
average value of 2 = 2.5±0.3 ps, and dropping from 2.5 to 1.5 ps in the red. In the crossover
region (520–540nm), the fitted times are the results of compensating rising and decaying exponentials and thus fluctuate strongly, without any significance for the actual excited state lifetimes.
Figure 6. Results of 3-exponential fittings for C2. A-Top: Values of the 3 wavelength-dependent
time constants. The symbol size indicates typical fit error bars. 3 is kept fixed at 12 ps for ≥ 580
nm. A-Bottom: Decay amplitudes A2 and A3. B: Decay-associated difference spectra (DADS)
obtained with a global fit approximation. The inverted and scaled ground state absorption spectra (SSA/invGSA) are indicated for comparison.
The spectral shape of A2 is in good agreement with the time-resolved spectra, displaying a
dominant ESA for >520 nm. For 3, the fits give values of 20–30 ps in the GSB region (<500
nm), and around 10 ps in the 520–550 nm ESA region, where the amplitude is large enough to determine this component reliably. The spectral distribution of A3 agrees with the long-delay A
spectra, for t > 10 ps (Fig. 3), with a maximum signal at 520–525 nm. Since the spectral shifts and the wavelength-dependence of the lifetimes are relatively small, we have performed a global analysis assuming wavelength-independent average lifetimes, using the shareware software OPTIMUS.48 The validity of wavelength-independent average lifetimes is assessed in detail in the
SI. It is found that the fit quality is very high except for the wavelengths of ESA/GSB crossover, displaying a dynamically shifting point of A =0. The results are displayed in Fig. 6B and show that the shape and positions of the maxima of the decay-associated difference spectra (DADS) agree with the A2 and A3 distributions obtained by individual wavelength fits (Fig. 6A). For all the
complexes C1 to C3, the average lifetimes given in Table 2 are derived from such a global fit approach.
Table 2. Values of the three decay times and the A2/A3 ratio at the wavelength of maximum GSB for the four complexes C0–C3. Values extracted from global fits for C1–C3 (cf. SI).
Complex 1 (ps) 2(ps) 3 (ps) A2/A3
C1 0.6±0.1 3.1±0.5 15±3 1.3
C2 0.4±0.1 2.5±0.5 19±3 4.0
C3 0.3±0.1 1.8±0.5 24±3 2.3
a Taken from ref. 32.
The critical point is now to build a reaction scheme involving the three lifetimes. The sub-picosecond 1 is usually assigned to the transition from the optically excited 1MLCT to 3MLCT
and vibrational relaxation of the latter, reflected in the ultrafast decay of ESA for the longest wavelengths. In C0, this phase of relaxation leads to a rise of the ESA signal at shorter wavelengths31 and a similar behaviour is pronounced in C1, here in the 500–550 nm range (Fig.
6B, and fits in Figs. S24 and S25), indicating that a sequential scheme is appropriate.
Since the ratio of amplitudes A2/A3 corresponds approximately to the mer-to-fac isomer ratio (see experimental section), one is tempted to attribute the faster 2 to mer and 3 to the fac isomer.
However, as we have shown in our previous publication on the pure fac- and a dominant mer-forms of C0, both decay components are present no matter what isomer content.31 Hence,
interpretation of 2 and 3 and their related amplitude spectra requires a more careful inspection
since, in the past, we have given different interpretations for seemingly similar spectral evolutions. Indeed, while in our recent work on tridentate complexes with pyrazine ligands we derived a scenario based on a single triplet excited state, with 3 being its lifetime and 2 representing slow
picosecond structural relaxation,30 the bidentate data for C0 and its fac-only version revealed the
population of two triplet states with 2 and 3 being their respective lifetimes.32 Both scenarios
differ, however, in two major points. For instance, for the former mono-state scenario: a) the amplitude of 3 is largely dominant, and b) the amplitude of 2 is close to zero or even positive in
the short wavelength part of the GSB (< 400 nm).30 On the contrary, for the bidentate complexes
under study, we observe A2>A3 and 3 showing up as an additional excited-to-ground state
relaxation process since the amplitude of A3 is significant for all wavelengths below 450 nm. Note
also that A3 follows the profile of the inverse SSA spectrum (Fig. 6).
In summary, as for C0 and its fac-only version, the TAS data are consistent with the existence of two excited triplet states, T1 and T2, populated via relaxation from 1MLCT and subsequent
vibrational cooling during 1, and decaying in parallel back to the ground state S0, according to the
following scheme:
𝑀𝐿𝐶𝑇 ⎯⎯ 𝑀𝐿𝐶𝑇
𝑀𝐿𝐶𝑇 →
𝑇 → 𝑆
𝑇 → 𝑆 (Scheme 2)
Here, the “+” index denotes vibrationally excited electronic states, inevitably present in the first hundred of femtoseconds after laser excitation. In our previous paper,31 we assigned the A2/A3
ratio at the GSB maximum to the ratio of populations of T2 / T1. However, due to the overlap of
ESA and GSB and since the ESA absorption coefficients of T1 and T2 are unknown, an accurate
determination of the excited state branching ratio is not possible.
The nature of the states T1 and T2, namely MLCT vs. MC character, and the impact of isomerism,
namely fac vs. mer, is rationalized in the following section via molecular modelling of the excited-state topology and relaxation pathways.
Since the global fitting procedure can be applied to a good approximation, we performed simulations of a purely sequential relaxation scenario. An analysis of the species-associated difference spectra (SADS) reveals, under this assumption and after subtraction of the GSB component, that the absorption spectrum decaying with 3 is actually very close to the GSA,
us to suggest a second alternative reaction scenario, with one excited state T1, decaying within 2
= 2–3 ps, and the longer-lived species actually being assigned to an unrelaxed ground state, S0+.
The 3 component would then be related to vibrational and dielectric relaxation of the molecules
in the ground state. Such a scenario is commonly observed for ultrafast excited state reactions, where a large excited state excess energy (> 1eV) is almost impulsively released into the ground state, leading to a non-equilibrated ground state population, which decays within several picoseconds.49,50 This is the most plausible interpretation, but not a definitive proof the nature of
S0+. Scheme 3 summarises this alternative purely sequential scheme.
𝑀𝐿𝐶𝑇 ⎯⎯ 𝑀𝐿𝐶𝑇 ⎯⎯⎯⎯ 𝑇 ⎯⎯⎯ 𝑆 ⎯⎯⎯⎯⎯⎯⎯ 𝑆 (Scheme 3)
Molecular modeling of the excited-state decay
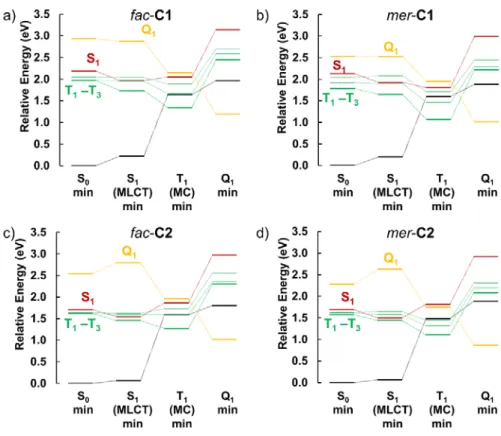
Analysis of the excited state reveals that, as for C0,31,32,34 the lowest-lying triplet states of C1
and C2 have 3MLCT character at regions close to the Franck-Condon as well as to S1 min area,
whereas further relaxation of the triplet manifold is driven by the elongation of a single Fe-N bond up to distances larger than 3.2 Å leading to spin-crossover regions with the ground state S0, with
dominant 3MC character for the triplet states. This is illustrated in Figures 7 & 8, and in the SI
Figure 7. Relative energies of the most relevant electronic states at different equilibrium
Figure 8. S1 min and T1 min optimized structures of the complexes. Red dashed lines highlight
the Fe-N elongated bonds (> 3.2 Å) in the triplet state.
These data reveal an adiabatic progression from 3MLCT to 3MC evidencing T1/S0 and T2/S0
non-radiative decay to the ground state. The spin-crossover character of these T1 min regions and the
energy splitting between the T1 and T2 states (see Fig. 7) suggest an excited-state decay scenario
very similar to the C0 prototype, for which the triplet potential energy surfaces and the minimum energy paths were determined in much detail. 31,32,34 Therefore, we can safely identify two main
deactivation channels, namely a fast T2 pathway (few picoseconds) and a slower T1 channel (tens
of picoseconds), the longer trapping of the excited state in the T1 channel is ascribed to the larger
spin-crossover regions as discussed in detail elsewhere.32
The energy diagrams shown in Figure 7 also allow to compare the profiles for the different isomers of C1 and C2. For fac-C1 (Fig. 7a), the T1 state at the corresponding T1 equilibrium
geometry lies at a relative energy of 1.34 eV, whereas in mer-C1 (Fig. 7b) this energy is lower, 1.06 eV. The same trend is observed for C2 (Fig. 7b and c) (1.28 eV for fac-C2 vs. 1.11 eV for mer-C2). This finding suggests that, assuming very similar potential energy surfaces as those of
C0,31,32 mer isomers will decay preferentially via T
2, since the triplet profiles are steeper and the
corresponding 3MC minima lie at lower energies. In addition, the T
1-T2 splitting is larger for the
mer isomers (see Fig 7): this is especially relevant at the FC and S1 (1MLCT) min regions since
the T1/T2 branching ratio is determined at these areas, as previously discussed for C0.32
Regarding the possible role of quintet states, the energy diagrams displayed in Figure 7 evidence a profile similar to that of C0, in which a significant participation of the Q1 state was discarded on
the basis of the energy barriers found to access the triplet-quintet crossing points along the potential energy surfaces. Thus, an analogous situation is expected for the current C1 and C2 complexes as also confirmed by TAS analysis discussed above.
CONCLUSION
The present paper reports our recent results on the synthesis of novel complexes of Fe(II) with two types of pyridyl-NHC bidentate ligands. The prototypical imidazolylidene carbene moieties are substituted by benzimidazolylidene (BIm) and imidazo[1,5-a]pyridine-3-ylidene (ImP) units, providing dominantly mer isomers. The combined experimental and computational study focusses on the effect of these substitutions on the spectroscopic properties and on the excited state lifetimes (ESL) and relaxation pathways, since the aim of these substitutions is to extend the ESL in the context of designing photo-sensitizing and photo-functional complexes with earth-abundant metals.
While the substitutions have significant effects on the energies of the frontier orbitals, as measured by cyclic voltammetry, and on the absorption properties, the excited state lifetimes and photoresponse are only marginally affected. As for the previously published dominantly fac and mer isomers of [Fe(PyIm)3]2+, the experimental transient absorption data are best described by a
parallel population and decay of two excited states T2 and T1, decaying with 2–3 and 15–18 ps lifetimes, respectively, according to the excited and ground state energetics found by TD-DFT calculations. The latter lifetime appears with smaller amplitude in the A signal, which may reflect a smaller population in T1 as compared to T2. But it may also be due to the increased overlap and
thus compensation of GSB and ESA in the case of T1 (cf. Fig. S20).
The present study teaches us an important lesson, since the BIm substitution, which almost doubled the ESL for tridentate Fe(II) complexes with four carbenes,27,28,30 turns out to be ineffective for the
is validated by electrochemistry, consistent with shifts of the ground state absorption spectra, but it is not operational in extending the ESL. This conclusion holds whatever photoresponse scheme (2 or 3) is actually at work for these homoleptic bidentate complexes. One realizes that the molecular parameters such as enhanced ligand field splitting and stabilization of the MLCT energies, which were considered to be critical for the initial work fueling the development of NHC ligands for Fe(II), 8,21,28–30,33 are not relevant any more in the present complexes with 3 or 4
Fe-carbene bonds. So, which parameter rules the excited state relaxation, and the ESL, i.e. the time it takes to reach the 3MC-S0 spin crossover region?
It is clear from previous computational work and ours that, in the presence of a pyridine ligand, the elongation of the Fe-N bond is the key degree of freedom.31 In other words, an increased
stiffness is likely to create an excited state barrier leading to an increased ESL. This was realized already by the latest work of the McCusker group,51,52 and it explains the difference between our
bidentate and tridentate complexes. As in the former, the Fe-N bond is more flexible, there is less energetic penalty for reaching the 3MC-S0 crossing, and the effect of ligand substitutions does play
a minor role for extending the ESL. Restricting the Fe-N motion via - stacking with another pyridine, was also operational for increasing the ESL in a heteroleptic Fe(II) complex, designed by the Wärnmark group, with one bipyridine and two bis(triazole-phenyl) ligands,14,33 and claimed
to be important for a recently designed panchromatic Fe complex.12 It is unclear how far one can
get, in terms of ESL, with an increasingly hindered Fe-N elongation, but this can be a future direction of improvement.
From a purely computational and spectroscopic point of view, comparing homoleptic tri- and bidentate complexes with 427,28,30 and respectively 331,32 carbene bonds, it is remarkable to observe
triplet state, while the latter display a parallel population of two excited triplet states. Since this seems to be a general observation for the numerous complexes with tri- and bidentate ligands investigated, further work is needed to understand the origin of this effect and how these transitions reflect the dynamically changing 3MC or 3MLCT character of the excited states. Note that the
heteroleptic complex with tridentate ligands and three Fe-carbene bonds studied by Zimmer et al.,24 displays yet another scheme, namely a sequential excited state relaxation:
𝑀𝐿𝐶𝑇 → 𝑀𝐶 → 𝑆 . However, for a detailed and accurate study of the excited state relaxation scenario (parallel, sequential, with or without branching), transient absorption spectroscopy is not enough discriminating as we demonstrated with the validity of both Schemes 2 and 3. Hence, additional ultrafast spectroscopic and structural methods,14,53 in combination with dynamic
simulations, are expected to play an increasing role in the near future.
ASSOCIATED CONTENT
Electronic Supplementary Information (ESI) available: [NMR, spectroscopic and electrochemical data for complexes, and additional computational and photophysical details]. See DOI: 10xxxxx
Conflicts of interest
There are no conflicts to declare.
Author Contributions
The manuscript was written through contributions of all authors. All authors have given approval to the final version of the manuscript.
The project is funded by the French Agence Nationale de Recherche (ANR-16-CE07-0013-02). The L2CM laboratory is grateful to F. Lachaud and F. Dupire for mass spectrometry, Ulises Carrillo for some sample preparation, Véronique Vaillant and Sandrine Rupp (LCPA2MC) for NMR experiments, IPCMS to O. Crégut for expert lab assistance and B. Marekha for help with the target analysis. The Strasbourg group acknowledges financial support through the Labex NIE. A.F.-M. acknowledges the Generalitat Valenciana and the European Social Fund (APOSTD/2019/149) and the Ministerio de Ciencia e Innovación (project CTQ2017-87054-C2-2-P) for the financial support. All calculations have been done using the local computing resources of the LPCT laboratory.
REFERENCES
(1) Scholl, M.; Ding, S.; Lee, C. W.; Grubbs, R. H. Synthesis and Activity of a New Generation of Ruthenium-Based Olefin Metathesis Catalysts Coordinated with 1,3-Dimesityl-4,5-Dihydroimidazol-2-Ylidene Ligands §. Org. Lett. 1999, 1, 953–956.
(2) Kantchev, E. A. B.; O’Brien, C. J.; Organ, M. G. Palladium Complexes of N-Heterocyclic Carbenes as Catalysts for Cross-Coupling Reactions—A Synthetic Chemist’s Perspective. Angew. Chem. Int. Ed. 2007, 46, 2768–2813.
(3) Hopkinson, M. N.; Richter, C.; Schedler, M.; Glorius, F. An Overview of N-Heterocyclic Carbenes. Nature 2014, 510, 485–496.
(4) Fortman, G. C.; Nolan, S. P. N-Heterocyclic Carbene (NHC) Ligands and Palladium in Homogeneous Cross-Coupling Catalysis: A Perfect Union. Chem. Soc. Rev. 2011, 40 (10), 5151-5169.
(5) Díez-González, S.; Marion, N.; Nolan, S. P. N-Heterocyclic Carbenes in Late Transition Metal Catalysis. Chem. Rev. 2009, 109, 3612–3676.
(6) Crabtree, R. H. Organometallic Alkane CH Activation. J. Organomet. Chem. 2004, 689, 4083–4091.
(7) Ponseca, C. S.; Chábera, P.; Uhlig, J.; Persson, P.; Sundström, V. Ultrafast Electron Dynamics in Solar Energy Conversion. Chem. Rev. 2017, 117, 10940–11024.
(8) Duchanois, T.; Liu, L.; Pastore, M.; Monari, A.; Cebrián, C.; Trolez, Y.; Darari, M.; Magra, K.; Francés-Monerris, A.; Domenichini, E.; Beley, M.; Assfeld, X.; Haacke, S.; Gros, P. NHC-Based Iron Sensitizers for DSSCs. Inorganics 2018, 6, 63.
(9) Lindh, L.; Chábera, P.; Rosemann, N. W.; Uhlig, J.; Wärnmark, K.; Yartsev, A.; Sundström, V.; Persson, P. Photophysics and Photochemistry of Iron Carbene Complexes for Solar Energy Conversion and Photocatalysis. Catalysts 2020, 10, 315.
(10) Wenger, O. S. Photoactive Complexes with Earth-Abundant Metals. J. Am. Chem. Soc.
2018, 140, 13522–13533.
(11) McCusker, J. K. Electronic Structure in the Transition Metal Block and Its Implications for Light Harvesting. Science 2019, 363, 484–488.
(12) Braun, J. D.; Lozada, I. B.; Kolodziej, C.; Burda, C.; Newman, K. M. E.; van Lierop, J.; Davis, R. L.; Herbert, D. E. Iron(Ii) Coordination Complexes with Panchromatic Absorption and Nanosecond Charge-Transfer Excited State Lifetimes. Nat. Chem. 2019, 11, 1144– 1150.
(13) Marchini, E.; Darari, M.; Lazzarin, L.; Boaretto, R.; Argazzi, R.; Bignozzi, C. A.; Gros, P. C.; Caramori, S. Recombination and Regeneration Dynamics in FeNHC (II)-Sensitized
Solar Cells. Chem. Commun. 2020, 56, 543–546.
(14) Tatsuno, H.; Kjær, K. S.; Kunnus, K.; Harlang, T. C. B.; Timm, C.; Guo, M.; Chàbera, P.; Fredin, L. A.; Hartsock, R. W.; Reinhard, M. E. et al. Hot Branching Dynamics in a Light‐ Harvesting Iron Carbene Complex Revealed by Ultrafast X‐ray Emission Spectroscopy. Angew. Chem. Int. Ed. 2020, 59, 364–372.
(15) Clark, C. D.; Hoffman, M. Z.; Paul Rillema, D.; Mulazzani, Q. G. Photophysics of Ruthenium(II) Complexes with 2-(2′-Pyridyl) Pyrimidine and 2,2′-Bipyridine Ligands in Fluid Solution. J. Photochem. Photobiol. Chem. 1997, 110, 285–290.
(16) Consani, C.; Prémont-Schwarz, M.; ElNahhas, A.; Bressler, C.; van Mourik, F.; Cannizzo, A.; Chergui, M. Vibrational Coherences and Relaxation in the High-Spin State of Aqueous [Fe II (Bpy) 3 ] 2+. Angew. Chem. Int. Ed. 2009, 48, 7184–7187.
(17) Cannizzo, A.; van Mourik, F.; Gawelda, W.; Zgrablic, G.; Bressler, C.; Chergui, M. Broadband Femtosecond Fluorescence Spectroscopy of [Ru(Bpy)3]2+. Angew. Chem. Int. Ed. 2006, 45, 3174–3176.
(18) McCusker, J. K.; Walda, K. N.; Dunn, R. C.; Simon, J. D.; Magde, D.; Hendrickson, D. N. Subpicosecond 1MLCT .Fwdarw. 5T2 Intersystem Crossing of Low-Spin Polypyridyl Ferrous Complexes. J. Am. Chem. Soc. 1993, 115, 298–307.
(19) Monat, J. E.; McCusker, J. K. Femtosecond Excited-State Dynamics of an Iron(II) Polypyridyl Solar Cell Sensitizer Model. J. Am. Chem. Soc. 2000, 122, 4092–4097. (20) Liu, Y.; Persson, P.; Sundström, V.; Wärnmark, K. Fe N -Heterocyclic Carbene Complexes
as Promising Photosensitizers. Acc. Chem. Res. 2016, 49, 1477–1485.
(21) Kaufhold, S.; Wärnmark, K. Design and Synthesis of Photoactive Iron N-Heterocyclic Carbene Complexes. Catalysts 2020, 10, 132.
(22) Chábera, P.; Kjaer, K. S.; Prakash, O.; Honarfar, A.; Liu, Y.; Fredin, L. A.; Harlang, T. C. B.; Lidin, S.; Uhlig, J.; Sundström, V. et al. Fe II Hexa N -Heterocyclic Carbene Complex
with a 528 Ps Metal-to-Ligand Charge-Transfer Excited-State Lifetime. J. Phys. Chem. Lett.
2018, 9, 459–463.
(23) Francés-Monerris, A.; Gros, P. C.; Pastore, M.; Assfeld, X.; Monari, A. Photophysical Properties of Bichromophoric Fe(II) Complexes Bearing an Aromatic Electron Acceptor. Theor. Chem. Acc. 2019, 138, 86.
(24) Zimmer, P.; Burkhardt, L.; Friedrich, A.; Steube, J.; Neuba, A.; Schepper, R.; Müller, P.; Flörke, U.; Huber, M.; Lochbrunner, S.; Bauer, M. The Connection between NHC Ligand Count and Photophysical Properties in Fe(II) Photosensitizers: An Experimental Study. Inorg. Chem. 2018, 57, 360–373.
(25) Steube, J.; Burkhardt, L.; Päpcke, A.; Moll, J.; Zimmer, P.; Schoch, R.; Wölper, C.; Heinze, K.; Lochbrunner, S.; Bauer, M. Excited‐State Kinetics of an Air‐Stable Cyclometalated Iron(II) Complex. Chem. – Eur. J. 2019, 25, 11826–11830.
(26) Liu, Y.; Harlang, T.; Canton, S. E.; Chábera, P.; Suárez-Alcántara, K.; Fleckhaus, A.; Vithanage, D. A.; Göransson, E.; Corani, A.; Lomoth, R. et al. Towards Longer-Lived Metal-to-Ligand Charge Transfer States of Iron(Ii) Complexes: An N-Heterocyclic Carbene Approach. Chem. Commun. 2013, 49, 6412–6414.
(27) Duchanois, T.; Etienne, T.; Cebrián, C.; Liu, L.; Monari, A.; Beley, M.; Assfeld, X.; Haacke, S.; Gros, P. C. An Iron-Based Photosensitizer with Extended Excited-State Lifetime: Photophysical and Photovoltaic Properties: An Iron-Based Photosensitizer with Extended Excited-State Lifetime. Eur. J. Inorg. Chem. 2015, 2015, 2469–2477.
(28) Liu, L.; Duchanois, T.; Etienne, T.; Monari, A.; Beley, M.; Assfeld, X.; Haacke, S.; Gros, P. C. A New Record Excited State 3 MLCT Lifetime for Metalorganic Iron( II ) Complexes.
Phys Chem Chem Phys 2016, 18, 12550–12556.
(29) Pastore, M.; Duchanois, T.; Liu, L.; Monari, A.; Assfeld, X.; Haacke, S.; Gros, P. C. Interfacial Charge Separation and Photovoltaic Efficiency in Fe( II )–Carbene Sensitized
Solar Cells. Phys Chem Chem Phys 2016, 18, 28069–28081.
(30) Darari, M.; Domenichini, E.; Francés-Monerris, A.; Cebrián, C.; Magra, K.; Beley, M.; Pastore, M.; Monari, A.; Assfeld, X.; Haacke, S. et al. Iron( II ) Complexes with
Diazinyl-NHC Ligands: Impact of π-Deficiency of the Azine Core on Photophysical Properties. Dalton Trans. 2019, 48 (29), 10915–10926.
(31) Francés-Monerris, A.; Magra, K.; Darari, M.; Cebrián, C.; Beley, M.; Domenichini, E.; Haacke, S.; Pastore, M.; Assfeld, X.; Gros, P. C.; Monari, A. Synthesis and Computational Study of a Pyridylcarbene Fe(II) Complex: Unexpected Effects of Fac / Mer Isomerism in Metal-to-Ligand Triplet Potential Energy Surfaces. Inorg. Chem. 2018, 57, 10431–10441. (32) Magra, K.; Domenichini, E.; Francés-Monerris, A.; Cebrián, C.; Beley, M.; Darari, M.; Pastore, M.; Monari, A.; Assfeld, X.; Haacke, S. et al. Impact of the Fac / Mer Isomerism on the Excited-State Dynamics of Pyridyl-Carbene Fe(II) Complexes. Inorg. Chem. 2019, 58, 5069–5081.
(33) Kjær, K. S.; Kaul, N.; Prakash, O.; Chábera, P.; Rosemann, N. W.; Honarfar, A.; Gordivska, O.; Fredin, L. A.; Bergquist, K.-E.; Häggström, L. et al. Luminescence and Reactivity of a Charge-Transfer Excited Iron Complex with Nanosecond Lifetime. Science 2019, 363, 249– 253.
(34) Francés‐Monerris, A.; Gros, P. C.; Assfeld, X.; Monari, A.; Pastore, M. Toward Luminescent Iron Complexes: Unravelling the Photophysics by Computing Potential Energy Surfaces. ChemPhotoChem 2019, 3, 666–683.
(35) Stanton, C. J.; Vandezande, J. E.; Majetich, G. F.; Schaefer, H. F.; Agarwal, J. Mn-NHC Electrocatalysts: Increasing π Acidity Lowers the Reduction Potential and Increases the Turnover Frequency for CO 2 Reduction. Inorg. Chem. 2016, 55, 9509–9512.
(36) Samanta, T.; Kumar Rana, B.; Roymahapatra, G.; Giri, S.; Mitra, P.; Pallepogu, R.; Kumar Chattaraj, P.; Dinda, J. Synthesis, Structure and Theoretical Studies of Hg(II)–NH Carbene Complex of Annulated Ligand Pyridinyl[1,2-a]{2-Pyridylimidazol}-3-Ylidene Hexaflurophosphate. Inorganica Chim. Acta 2011, 375, 271–279.
(37) Frisch, M. J.; Trucks, G. W.; Schlegel, H. B.; Scuseria, G. E.; Robb, M. A.; Cheeseman, J. R.; Scalmani, G.; Barone, V.; Mennucci, B.; Petersson, G. A. et al. Gaussian09. Revis. D01
(38) Hirata, S.; Head-Gordon, M. Time-Dependent Density Functional Theory within the Tamm–Dancoff Approximation. Chem. Phys. Lett. 1999, 314, 291–299.
(39) Boese, A. D.; Handy, N. C. A New Parametrization of Exchange–Correlation Generalized Gradient Approximation Functionals. J. Chem. Phys. 2001, 114, 5497–5503.
(40) Duchanois, T.; Etienne, T.; Beley, M.; Assfeld, X.; Perpète, E. A.; Monari, A.; Gros, P. C. Heteroleptic Pyridyl-Carbene Iron Complexes with Tuneable Electronic Properties. Eur. J. Inorg. Chem. 2014, 2014, 3747–3753.
(41) Martin, R. L. Natural Transition Orbitals. J. Chem. Phys. 2003, 118, 4775–4777.
(42) Etienne, T.; Assfeld, X.; Monari, A. Toward a Quantitative Assessment of Electronic Transitions’ Charge-Transfer Character. J. Chem. Theory Comput. 2014, 10, 3896–3905. (43) Etienne, T.; Assfeld, X.; Monari, A. New Insight into the Topology of Excited States
through Detachment/Attachment Density Matrices-Based Centroids of Charge. J. Chem. Theory Comput. 2014, 10, 3906–3914.
(44) Roland, T.; Léonard, J.; Hernandez Ramirez, G.; Méry, S.; Yurchenko, O.; Ludwigs, S.; Haacke, S. Sub-100 Fs Charge Transfer in a Novel Donor–Acceptor–Donor Triad Organized in a Smectic Film. Phys Chem Chem Phys 2012, 14, 273–279.
(45) Hutt, J. T.; Aron, Z. D. Efficient, SingleStep Access to Imidazo[1,5 a ]Pyridine N -Heterocyclic Carbene Precursors. Org. Lett. 2011, 13, 5256–5259.
(46) Huynh, H. V. Electronic Properties of N-Heterocyclic Carbenes and Their Experimental Determination. Chem. Rev. 2018, 118, 9457–9492.
(47) Koto, Y.; Shibahara, F.; Murai, T. Imidazo[1,5-a]Pyridin-3-Ylidenes as π-Accepting Carbene Ligands: Substituent Effects on Properties of N-Heterocyclic Carbenes. Org. Biomol. Chem. 2017, 15, 1810–1820.
(48) Slavov, C.; Hartmann, H.; Wachtveitl, J. Implementation and Evaluation of Data Analysis Strategies for Time-Resolved Optical Spectroscopy. Anal. Chem. 2015, 87, 2328–2336. (49) Gueye, M.; Manathunga, M.; Agathangelou, D.; Orozco, Y.; Paolino, M.; Fusi, S.; Haacke,
S.; Olivucci, M.; Léonard, J. Engineering the Vibrational Coherence of Vision into a Synthetic Molecular Device. Nat. Commun. 2018, 9, 313.
(50) Cheminal, A.; Léonard, J.; Kim, S.-Y.; Jung, K.-H.; Kandori, H.; Haacke, S. 100 Fs Photo-Isomerization with Vibrational Coherences but Low Quantum Yield in Anabaena Sensory Rhodopsin. Phys. Chem. Chem. Phys. 2015, 17, 25429–25439.
(51) Britz, A.; Gawelda, W.; Assefa, T. A.; Jamula, L. L.; Yarranton, J. T.; Galler, A.; Khakhulin, D.; Diez, M.; Harder, M.; Doumy, G. et al. Using Ultrafast X-Ray Spectroscopy To Address Questions in Ligand-Field Theory: The Excited State Spin and Structure of [Fe(Dcpp) 2 ] 2+. Inorg. Chem. 2019, 58, 9341–9350.
(52) Paulus, B. C.; Adelman, S. L.; Jamula, L. L.; McCusker, J. K. Leveraging Excited-State Coherence for Synthetic Control of Ultrafast Dynamics. Nature 2020, 582, 214–218. (53) Kjær, K. S.; Zhang, W.; Alonso-Mori, R.; Bergmann, U.; Chollet, M.; Hadt, R. G.; Hartsock,
R. W.; Harlang, T.; Kroll, T.; Kubiček, K. et al. Ligand Manipulation of Charge Transfer Excited State Relaxation and Spin Crossover in [Fe(2,2′-Bipyridine) 2 (CN) 2 ]. Struct. Dyn.