HAL Id: inserm-02443968
https://www.hal.inserm.fr/inserm-02443968
Submitted on 17 Jan 2020
HAL is a multi-disciplinary open access
archive for the deposit and dissemination of
sci-entific research documents, whether they are
pub-lished or not. The documents may come from
teaching and research institutions in France or
abroad, or from public or private research centers.
L’archive ouverte pluridisciplinaire HAL, est
destinée au dépôt et à la diffusion de documents
scientifiques de niveau recherche, publiés ou non,
émanant des établissements d’enseignement et de
recherche français ou étrangers, des laboratoires
publics ou privés.
Robert Reed, Andrei Morgan, Jennifer Zeitlin, Pierre-Henri Jarreau, Héloise
Torchin, Véronique Pierrat, Pierre-Yves Ancel, Babak Khoshnood
To cite this version:
Robert Reed, Andrei Morgan, Jennifer Zeitlin, Pierre-Henri Jarreau, Héloise Torchin, et al.. Assessing
the risk of early unplanned rehospitalisation in preterm babies: EPIPAGE 2 study. BMC Pediatrics,
BioMed Central, 2019, 19 (1), pp.451. �10.1186/s12887-019-1827-6�. �inserm-02443968�
R E S E A R C H A R T I C L E
Open Access
Assessing the risk of early unplanned
rehospitalisation in preterm babies:
EPIPAGE 2 study
Robert Anthony Reed
1, Andrei Scott Morgan
1,2,3*, Jennifer Zeitlin
1, Pierre-Henri Jarreau
1,4, Héloïse Torchin
1,4,
Véronique Pierrat
1,5, Pierre-Yves Ancel
1,6and Babak Khoshnood
1Abstract
Background: Gaining a better understanding of the probability, timing and prediction of rehospitalisation amongst preterm babies could help improve outcomes. There is limited research addressing these topics amongst extremely and very preterm babies. In this context, unplanned rehospitalisations constitute an important, potentially
modifiable adverse event. We aimed to establish the probability, time-distribution and predictability of unplanned rehospitalisation within 30 days of discharge in a population of French preterm babies.
Methods: This study used data from EPIPAGE 2, a population-based prospective study of French preterm babies. Only those babies discharged home alive and whose parents responded to the one-year survey were eligible for inclusion in our study. For Kaplan-Meier analysis, the outcome was unplanned rehospitalisation censored at 30 days. For predictive modelling, the outcome was binary, recording unplanned rehospitalisation within 30 days of
discharge. Predictors included routine clinical variables selected based on expert opinion.
Results: Of 3841 eligible babies, 350 (9.1, 95% CI 8.2–10.1) experienced an unplanned rehospitalisation within 30 days. The probability of rehospitalisation progressed at a consistent rate over the 30 days. There were significant differences in rehospitalisation probability by gestational age. The cross-validated performance of a ten predictor model demonstrated low discrimination and calibration. The area under the receiver operating characteristic curve was 0.62 (95% CI 0.59–0.65). Conclusions: Unplanned rehospitalisation within 30 days of discharge was infrequent and the probability of
rehospitalisation progressed at a consistent rate. Lower gestational age increased the probability of rehospitalisation. Predictive models comprised of clinically important variables had limited predictive ability.
Keywords: Prematurity, Newborn, Neonatology, Rehospitalisation, Discharge, Prediction, Survival analysis, Epidemiology, Cohort study
Background
Preterm births affect approximately 9% of live births in Europe [1], and have substantial repercussions for a new-borns’ short and long term health outcomes, as well as for health systems and wider society [2–4]. In this context, un-planned rehospitalisations can be useful markers for ser-ious pathologies, and also represent potentially modifiable adverse events. Preventing unplanned, and in some cases
avoidable, rehospitalisations can potentially reduce costs, the risk of iatrogenic effects and wider burdens on babies and their families. A better understanding of rehospitalisa-tion rates, timing and predictive models aiming to provide objective estimates of a preterm baby’s risk could poten-tially complement clinical judgment and inform decision making [5–9].
Limiting rehospitalisations is a key challenge facing health systems as they are associated with large costs and inconvenience to patients and providers [10–12]. Thirty-day rehospitalisations are a particular focus for health pro-viders [13–15]. Rehospitalisation rates amongst preterms have been found to be significantly higher than those of © The Author(s). 2019 Open Access This article is distributed under the terms of the Creative Commons Attribution 4.0
International License (http://creativecommons.org/licenses/by/4.0/), which permits unrestricted use, distribution, and reproduction in any medium, provided you give appropriate credit to the original author(s) and the source, provide a link to the Creative Commons license, and indicate if changes were made. The Creative Commons Public Domain Dedication waiver (http://creativecommons.org/publicdomain/zero/1.0/) applies to the data made available in this article, unless otherwise stated.
* Correspondence:andrei.morgan@inserm.fr
1Université de Paris, Epidemiology and Statistics Research Center/CRESS,
INSERM, INRA, F-75004 Paris, France
2Elizabeth Garrett Anderson Institute for Womens’ Health, UCL, London, UK
full-term infants [16–18]. Factors previously found to be associated with rehospitalisation are male sex [19–22], lower gestational age [23–25], low birth weight or being small for gestational age (SGA) [26], feeding problems [27–30], bronchopulmonary dysplasia (BPD) [31,32] and lower socioeconomic status [21,27,33,34]. To the best of our knowledge, the literature on the early rehospitalisation of preterms discussed explanatory models only and not validated predictive models. As explanatory models often do not provide optimal predictions, the literature cannot directly address one of our aims of predicting rehospitalisations [35–37].
In this study, using data from a large, prospective, population-based cohort study of newborns of 22–34 weeks gestation (EPIPAGE 2) [38] we examined early (≤30 days) unplanned rehospitalisations following initial discharge. Our first objective was to look at the probabil-ity and timing of unplanned rehospitalisations during the 30-day period following initial discharge. Our second objective was to assess the ability of a set of important clinically relevant variables to predict unplanned rehos-pitalisation within 30 days of discharge.
Methods
Study design and population
This study used data from the EPIPAGE 2 cohort, a French national prospective study. The eligible popula-tion of EPIPAGE 2 included all babies born at 22–34
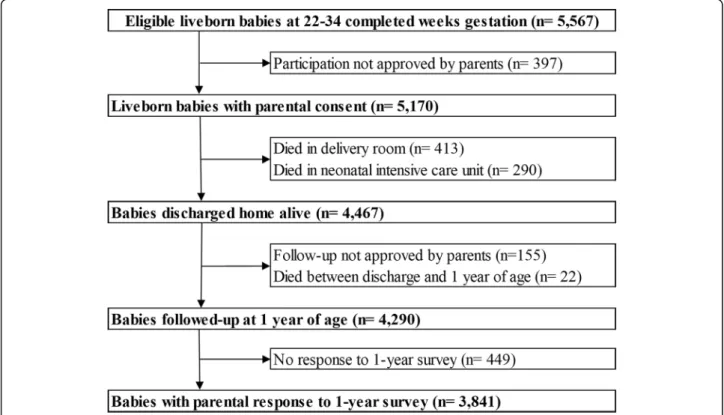
weeks gestation in all maternity units in 25 regions of France. The study began on March 28, 2011, and ended on December 31, 2011 and recruited from all maternity units in participating regions. The one region that did not participate in the study accounted for just over 18, 000 births in 2011, around 2% of all births in France. Ba-bies with a gestational age of 22–26, 27–31 and 32–34 weeks had recruitment periods of 8 months, 6 months and 5 weeks respectively [38]. All babies discharged home alive following birth hospitalisation and whose parents completed the one-year survey were eligible for inclusion in our study. Babies who died during the initial birth hospitalisation or between discharge and one-year follow-up were excluded. Babies of parents that either did not consent to, or failed to complete, the one-year follow-up survey were also excluded. A flow chart of the selection of the study population can be seen in Fig.1.
The EPIPAGE 2 study collected data at birth and at follow-up at one, two and 5.5 years corrected age. We used data collected at birth and the one-year follow-up. Birth data were collected during the neonatal period in maternity and neonatal units using medical records and questionnaires for obstetric and neonatal teams. Neo-natal data collection addressed the baby’s birth condi-tion, disease status and treatments received. Interviews and self-administered questionnaires were used in the neonatal unit to obtain information on a mother’s socio-economic status, health and the care her baby received
prior to discharge. The one-year follow-up survey com-prised a questionnaire sent to the parents to collect details of post-neonatal care, hospitalisations, growth, sequela, treatments, maternal health, and socioeconomic details. Outcome
We looked at both the overall probability of early (≤30 days) unplanned rehospitalisations and the timing of unplanned rehospitalisations during the 30 days fol-lowing initial discharge of newborns from the hos-pital. Unplanned rehospitalisation status (URH) was defined according to the recorded cause of rehospita-lisation. This information was collected from parents via the one-year follow-up survey requesting the date and cause of their baby’s three longest rehospitalisations. For cause, parents could select from bronchiolitis or asth-matic bronchitis, gastroenteritis, diarrhoea or dehydration, poor weight gain, convulsion, injury, malaise, surgery or other (‘vaccination’ or ‘for observation’ for example). Rehos-pitalisations for surgery and vaccinations were classified as planned, all other causes were considered unplanned. Any baby with both an unplanned cause (e.g. gastroenteritis) and planned cause (e.g. surgery) of rehospitalisation was classified as having a URH. The number of days be-tween initial discharge and the first URH was used to determine whether a baby had an URH within 30 days of initial discharge (URH30). In cases where a baby had multiple URH30 the earliest of these was selected and used in analysis.
Predictor variables
A model containing the predictor gestational age alone was constructed initially to provide a performance base-line. Following a review of the literature and discussion with expert clinicians, 48 predictors (Additional file 1) were then considered for inclusion in a ten predictor and 20 predictor model. Selection was informed by ex-ploratory analysis, cross tabulation, consideration of a variable’s reliable availability and further discussion with clinicians. For the ten predictor model, emphasis was placed on selecting a parsimonious model, potentially practical for clinical use. The ten predictor model con-tained: sex (binary), gestational age in weeks (categorical; 22–26, 27–31 and 32–34), SGA status (binary; weight below the 10th percentile for gestational age), exposure to nitric oxide (binary), surfactant (binary), bronchopul-monary dysplasia (BPD) (categorical; none, mild (≥28 days oxygen and breathing room air to week 36), moder-ate (≥28 days oxygen and mechanical ventilation or con-tinuous airway pressure/ FiO2> 21% at week 36) or
severe (≥28 days oxygen and mechanical ventilation or continuous airway pressure/ FiO2> 30% at week 36)),
early onset neonatal infection (binary; no infection or ei-ther a probable infection with antibiotics started before
72 h of life and duration≥5 day or certain infection with positive blood or cerebrospinal fluid culture before 72 h of life), post-menstrual age at discharge (PMA) in weeks (four categories of approximately equal size; <36, 36- < 37, 37- < 38 and≥ 38), discharge weight in grams (four categories of approximately equal size; ≤2200, 2201-2600, 2601–3000 and > 3000) and breastfeeding status at discharge (categorical; recording whether baby was re-ceiving either no breast milk, mixed feeding or exclusive breastfeeding at discharge).
To investigate the impact of model complexity and the influence of wider clinical, maternal and socioeconomic factors on prediction, a 20 variable model comprised of all predictors from the ten predictor model plus an add-itional ten was developed. The addadd-itional predictors were: multiple pregnancy (binary), level of birth unit (categorical; 1, 2a, 2b or 3), congenital abnormalities (binary), late onset neonatal infection after >72 h of life (binary), necrotising enterocolitis (binary), intraventricu-lar hemorrhage (IVH) (Stage 3 IVH or intraparenchymal hemorrhage) (binary), mother’s age in years (continu-ous), mother born outside France (binary), family socio-economic status (categorical; professional, intermediate, administrative/public service, self-employed/students, shop assistants, service workers, manual workers or no profession) and smoking during pregnancy (binary). Statistical analysis
We compared the characteristics of babies with URH30 to those without, using the Kruskal-Wallis test for con-tinuous variables and chi-squared test or Fisher’s exact test for categorical variables.
To investigate the timing and proportion of babies with URH over the first 30 days we produced Kaplan-Meier curves for URH status censored at 30 days alone and also according to gestational age category. Ninety-five percent confidence intervals and the log-rank test were used to establish whether there were any differ-ences between Kaplan-Meier curves.
Ap value of <0.05 was considered statistically significant. All analysis was conducted using R version 3.4.2 [39]. Predictive model building and validation
Three predictive models for URH30 were constructed using complete-cases (babies with no missing values for the outcome or exposure). The first model contained the gestational age predictor alone, the second contained ten predictors and the third model contained 20. Multivari-ate logistic regression analysis was used to construct the models. The performance of each model was validated with 10-fold cross-validation [40,41]. This involved div-iding the complete-cases into ten equally sized subsets. Each time, nine of the subsets were used to train an in-dependent regression model. The coefficients derived
from the training stage were then used to predict URH30 on the one remaining test subset. This was repeated ten times until each subset had been used as the test once. Coefficients for the model were derived by training the model on the entire data set as the performance measured with the cross-validation subsets is assumed to be an ap-proximation of the performance of the model trained on all samples [42]. Model performance was assessed using measures of discrimination and calibration. Discrimin-ation was measured using area under the receiver operat-ing characteristic curve (AUROC) with 95% confidence interval, sensitivity, specificity and Tjur’s coefficient of determination [43]. Calibration was assessed via the Hosmer-Lemeshow goodness-of-fit test and correspond-ing calibration curve. The classification threshold for pre-dictive modelling was adjusted to optimise the false positive and true positive rates [44–46]. The impact of the categorisation of continuous variables such as gestational age and birth weight on prediction was assessed through a sensitivity analysis for the predictive models.
Missing data
To establish the impact of missing data upon prediction we used multiple imputation and rebuilt the predictive models using the imputed data [47]. Imputation was con-ducted using 20 imputations and 100 iterations. The full list of variables used as predictors during imputation and their rate of missingness can be seen in Additional file2. Pooled model coefficients were derived using Rubin’s rule [48] and performance measures presented using the me-dian and inter-quartile range [49–51].
Results
There were 5567 live born babies eligible for inclusion in the EPIPAGE 2 study; 703 died during the initial hos-pitalisation and 4467 were discharged home alive, of these, 3841 babies (86% of those babies discharged home alive) had parents that completed the one-year follow-up survey (Fig.1). Compared to the 3841 babies included in our eligible population, those that were excluded due to their parents not completing the one-year follow-up sur-vey (449 babies) had significantly higher median birth weight (1410 g v 1350 g, p = 0.040) and levels of mater-nal unemployment (9.6% v 2.3%,p < 0.001). Median ma-ternal age was also lower compared to the eligible population (28 years v 30 years, p < 0.001), and there were lower levels of exclusive breastfeeding amongst ba-bies excluded for lack of survey completion (18.4% v 28.2%, p < 0.001). Babies that died between discharge and the one-year follow-up, and were therefore excluded from the analysis, had lower levels of exclusive breast-feeding compared to the eligible population (9.0% v 28.2%, p = 0.047). They also had higher rates of severe BPD (18.0% v 6.0%,p = 0.017).
There were 399 30-day rehospitalisations for any cause in our sample, a rate of 10.4% (95% CI 9.4–11.4). Three hundred and fifty (9.1% (95% CI 8.2–10.1)) newborns in the study population experienced an unplanned rehospita-lisation within 30 days of index discharge. A proportion of these URH30 were due to specific diagnoses such as bronchiolitis (26.6%), gastroenteritis (5.7%), poor weight gain (2.3%). The remainder of the URH30 were due to broader causes such as malaise, convulsions, accidents and unspecified illnesses or events (64.9%).
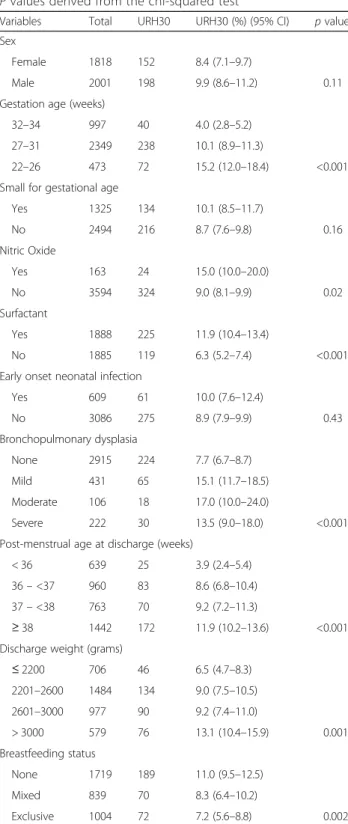
Table 1shows the distribution of the ten primary pre-dictors amongst the eligible population of 3841 babies by URH30 status. The rate of URH30 was greater in ba-bies of 22–26 weeks gestation, with 72 (15.2%) compared to 238 (10.1%) in 27–31 weeks and 40 (4.0%) in 32–34 week babies (p < 0.001). The rate was also higher for those in receipt of nitric oxide (p = 0.02) or surfactant (p < 0.001), diagnosed with BPD (p < 0.001). There were also more URH30 with increasing PMA at discharge (p < 0.001), increased discharge weight (p = 0.001) and lower levels of breastfeeding (p = 0.002). Of the ten add-itional clinical, mother and socioeconomic predictors, level of birth unit as well as rates of late onset infection and smoking were significantly different according to URH30 status. The cross-tabulation for all additional variables can be seen in Additional file3.
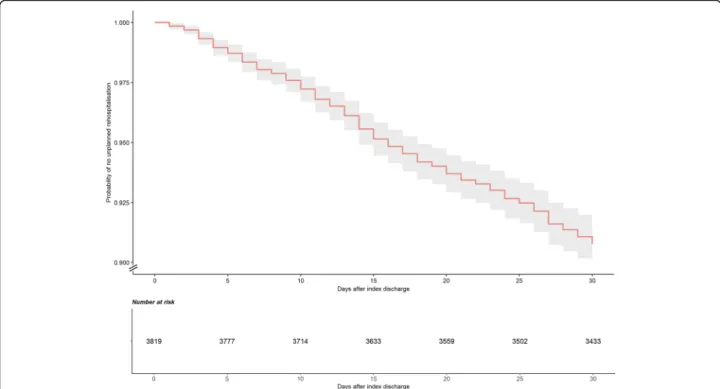
Timing of unplanned rehospitalisation over the first 30 days The cumulative probability of URH progressed at a rela-tively consistent rate over the first 30 days following dis-charge (Fig. 2 and Additional file 4). The probability of URH was 2.8% (95% CI 2.3–3.3) at day 10, 6.3% (95% CI 5.5–7.1) at day 20 and 9.2% (95% CI 8.3–10.1) by day 30. In the three gestational age categories, the probability of URH remained similar initially and began to diverge around day 10. By day 30, the URH probabilities for ba-bies of 22–26, 27–31 and 32–34 weeks gestation were 15.4% (95% CI 12.0–18.6), 10.2% (95% CI 9.0–11.4) and 4.0% (95% CI 2.8–5.2) respectively (Fig. 3 and Add-itional file5). Differences between the three Kaplan-Meier curves for the gestational age groups were significant (log-rank test, p < 0.001).
Predictive model performance
Complete-cases were used for the logistic regression model building. Of the 3841 eligible babies, 2707 (70.5%) were complete-cases.
Univariate regression analysis of the ten primary pre-dictor variables shown in Table 2 show gestational age less than 32 weeks, nitric oxide, surfactant, BPD, PMA of 36 weeks or more, discharge weight greater than 3000 g and breastfeeding status were all independently associ-ated with URH30. After adjustment in the multivariate regression predictive model, two variables were found to
be significant risk factors (Table2). These were gestational ages of 22–26 weeks (aOR 1.44 (95% CI 1.18–1.77) and 27–31 weeks (aOR 1.47 (95% CI 1.17–1.84)) compared to
32–34 week babies, and PMA of both 36 to less than 37 weeks (aOR 1.34 (95% CI 1.06–1.70) and 37 to less than 38 weeks (aOR 1.32 (95% CI 1.05–1.65) com-pared to less than 36 weeks. Results of regression ana-lysis for the 20 predictor model are shown in Additional file 6.
Discrimination
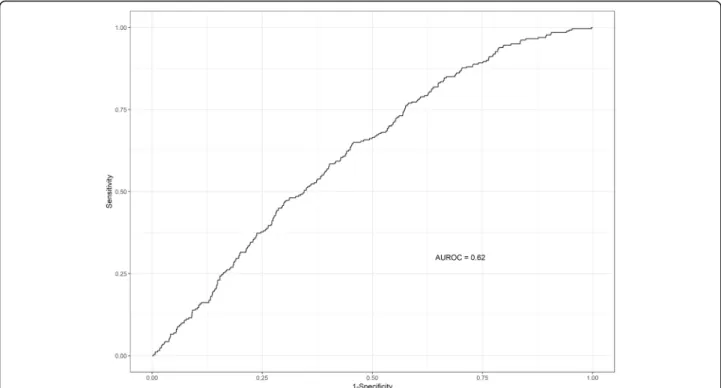
The discriminatory performance of all three models was similar. The model containing gestational age alone gave an AUROC of 0.60 (95% CI 0.57–0.62). For the ten predictor model, the AUROC across the ten cross-validated sets was 0.62 (95% CI 0.59–0.65). Figure 4 shows the cross-validated ROC resulting from the predictions on the ten test sets. At a classi-fication threshold of 0.08, sensitivity and specificity for the ten predictor model were 0.77 and 0.42 re-spectively. Tjur’s coefficient was 0.019.
A more complex model, containing twenty predic-tors gave an AUROC of 0.62 (95% CI 0.58–0.72). Full discrimination performance results for each of the three predictive models can be seen in Table 3. The inclusion of continuous versions of variables such as gestational age and birth weight (in place of their categorised equivalents) did not improve the predict-ive power of the models.
Calibration
Figure 5 and Table 3 show the calibration curve and p value derived from the Hosmer-Lemeshow test for the ten predictor model. The test offered sufficient evidence to reject the null hypothesis that, across risk deciles, actual and observed URH30 event counts were similar to predicted counts. Full discrimination per-formance results for each of the three predictive models can be seen in Table3.
Sensitivity to missing data
A total of 1134 (29.5%) had missing data on explana-tory variables. Rates of missingness by variable are shown in Additional file 2. The ten predictor model built with multiply imputed data gave a median AUROC of 0.63 (IQR 0.004), sensitivity of 0.75 (IQR 0.01), specificity of 0.45 (IQR 0.01) and a Tjur’s statistic of 0.019 (IQR 0.001) (Table3).
Discussion
Using data from a prospective, population-based co-hort study of 3841 newborns of 22–34 weeks gestation (EPIPAGE 2), we found that the overall risk of early unplanned rehospitalisation within 30 days of dis-charge was approximately 9%. The timing of rehospi-talisations during the 30-day period had a fairly uniform distribution with an approximately linear Table 1 Distribution of ten primary characteristics of 3841
eligible babies in the EPIPAGE 2 cohort by 30-day unplanned rehospitalisation (URH30) status. Including missing values. P values derived from the chi-squared test
Variables Total URH30 URH30 (%) (95% CI) p value Sex
Female 1818 152 8.4 (7.1–9.7)
Male 2001 198 9.9 (8.6–11.2) 0.11 Gestation age (weeks)
32–34 997 40 4.0 (2.8–5.2) 27–31 2349 238 10.1 (8.9–11.3)
22–26 473 72 15.2 (12.0–18.4) <0.001 Small for gestational age
Yes 1325 134 10.1 (8.5–11.7) No 2494 216 8.7 (7.6–9.8) 0.16 Nitric Oxide Yes 163 24 15.0 (10.0–20.0) No 3594 324 9.0 (8.1–9.9) 0.02 Surfactant Yes 1888 225 11.9 (10.4–13.4) No 1885 119 6.3 (5.2–7.4) <0.001 Early onset neonatal infection
Yes 609 61 10.0 (7.6–12.4) No 3086 275 8.9 (7.9–9.9) 0.43 Bronchopulmonary dysplasia None 2915 224 7.7 (6.7–8.7) Mild 431 65 15.1 (11.7–18.5) Moderate 106 18 17.0 (10.0–24.0) Severe 222 30 13.5 (9.0–18.0) <0.001 Post-menstrual age at discharge (weeks)
< 36 639 25 3.9 (2.4–5.4) 36– <37 960 83 8.6 (6.8–10.4) 37– <38 763 70 9.2 (7.2–11.3)
≥ 38 1442 172 11.9 (10.2–13.6) <0.001 Discharge weight (grams)
≤ 2200 706 46 6.5 (4.7–8.3) 2201–2600 1484 134 9.0 (7.5–10.5) 2601–3000 977 90 9.2 (7.4–11.0) > 3000 579 76 13.1 (10.4–15.9) 0.001 Breastfeeding status None 1719 189 11.0 (9.5–12.5) Mixed 839 70 8.3 (6.4–10.2) Exclusive 1004 72 7.2 (5.6–8.8) 0.002
Fig. 2 Kaplan-Meier curve with shaded 95% confidence interval and risk table for unplanned rehospitalisation over the first 30 days amongst 3841 eligible babies in the EPIPAGE 2 cohort
Fig. 3 Kaplan-Meier curves with shaded 95% confidence interval and risk table for unplanned rehospitalisation over the first 30 days amongst 3841 eligible babies in the EPIPAGE 2 cohort, by gestational age of babies.P value relates to log-rank test, with a null hypothesis that the survival curves are the same
progression of rehospitalisation risk during the period. Compared to babies of 32–34 weeks gestation, those of 22–26 and 27–31 weeks gestation had a statistically important increased probability of URH within 30 days. Lower gestational age and increased PMA at discharge were associated with URH30 in the ten pre-dictor model. The association with increased PMA at discharge might reflect difficulties at home, leading to delayed discharge and a subsequent increased risk of rehospitalisation when a baby is finally discharged. A predictive model based on ten clinically important variables chosen after a review of the literature and input from expert clinicians, as well as models con-taining a more extensive set of predictors, showed relatively poor discrimination and low indices of pre-dictive ability. Moreover, the added value of other variables compared to a predictive model based on gestational age alone was quite limited. Given the key role gestational age plays in determining physiological immaturity, and that lower gestational age is a recog-nised risk factor for rehospitalisation, this finding was not unexpected [23, 24, 52]. The limited predictive
ability of our models is in line with the literature on predictive models for rehospitalisation in adults, in which a majority fail to achieve clinically useful per-formance [53].
Strengths and limitations
Using data from a large population-based study these re-sults provide useful insight into the probability and tim-ing of early unplanned rehospitalisation in preterms, especially amongst less extensively studied extremely and very preterm babies. This study is, to the best of our knowledge, the first validated predictive model for early rehospitalisation in preterm babies. The range of infor-mation collected meant that established risk factors, and more unique variables, were available for analysis and consideration in predictive modelling. The wide range of available variables and subsequent selection in consult-ation with clinical experts increased the likelihood that clinically relevant predictors were included in the models. Our choice of a 30-day follow-up period for our outcome was based on its established use in the litera-ture and as a quality measure in health systems such as Table 2 Unadjusted (uOR) and adjusted odds ratios (aOR) for the ten predictors in the primary predictive logistic regression model for unplanned rehospitalisation within 30 days (URH30) amongst 2707 eligible, complete-case babies in the EPIPAGE 2 cohort
Variable uOR 95% CI p value aOR 95% CI p value Female 0.84 0.65–1.08 0.176 0.92 0.81–1.05 0.22 Gestational age (weeks) (ref. 32–34)
27–31 2.83 1.82–4.42 <0.001 1.47 1.17–1.84 0.001 22–26 4.88 2.95–8.08 <0.001 1.44 1.18–1.77 <0.001 Small for gestational age 1.11 0.85–1.45 0.440 1.12 0.96–1.30 0.16 Nitric oxide 1.71 1.01–2.92 0.047 1.03 0.92–1.16 0.58 Surfactant 2.10 1.60–2.75 <0.001 1.16 0.99–1.36 0.07 Early onset neonatal infection 1.18 0.85–1.64 0.313 0.99 0.88–1.13 0.91 Bronchopulmonary dysplasia (ref. none)
Mild 2.26 1.62–3.14 <0.001 1.12 0.98–1.27 0.09 Moderate 2.32 1.30–4.13 0.004 1.05 0.93–1.17 0.45 Severe 1.78 1.12–2.84 0.015 0.98 0.85–1.12 0.73 Post-menstrual age at discharge (weeks) (ref. <36)
36 - <37 2.22 1.29–3.80 0.004 1.34 1.06–1.70 0.02 37 - <38 2.48 1.43–4.30 0.001 1.32 1.05–1.65 0.02 ≥ 38 3.04 1.83–5.05 <0.001 1.29 0.97–1.72 0.08 Discharge weight (grams) (ref. 2,201–2600)
≤2200 0.79 0.53–1.19 0.260 0.91 0.77–1.08 0.28 2601 - 3000 1.22 0.89–1.69 0.220 1.02 0.88–1.19 0.79 > 3000 1.60 1.13–2.28 0.008 1.05 0.90–1.23 0.52 Breastfeeding status (ref. none)
Mixed 0.79 0.57–1.10 0.160 0.95 0.82–1.09 0.47 Exclusive 0.69 0.50–0.94 0.019 0.88 0.76–1.02 0.10
the UK National Health Service [54] and Medicare and Medicaid Services in the United States [55]. The period is considered appropriate as it is short enough to limit the influence of factors outside the immediate control of clinicians, thus potentially making such rehospitalisa-tions more amenable to preventive adjustments in treat-ment or discharge decisions for example.
We chose to focus on unplanned rehospitalisation as planned causes are less likely to be preventable. We acknowledge the decision to classify all surgical rehospitalisations as planned may have led to the ex-clusion of surgical interventions that were unplanned. The construction of our outcome also relied upon mothers recalling the date and cause of their baby’s three longest rehospitalisations. Though bias was minimised through verification using the child’s hand-held record, some errors still persist. It is also
possible that shorter rehospitalisation for transient ill-nesses may be under represented in our sample. It is difficult to say whether these limitations might have impacted the predictive power of our models. Fur-thermore, we excluded 22 babies who died between discharge and one-year follow-up. It was not possible to establish the exact dates of these deaths and whether they occurred within 30 days of discharge. However, although only a very small proportion of the babies discharged home alive died (0.5%), exclud-ing them might have introduced bias: babies that died were more likely to have severe illness, and thus more likely to have been rehospitalised within 30 days of discharge.
Unplanned rehospitalisation within 30 days in this study was relatively infrequent and is in line with much of the literature on early rehospitalisations in preterm
Fig. 4 Receiver operating characteristic curve (ROC) of cross-validated predictions and corresponding area under the curve (AUROC) for the ten predictor model for unplanned rehospitalisation within 30 days developed on 2707 eligible, complete-case babies in the EPIPAGE 2 cohort
Table 3 Predictive performance measures for logistic regression models constructed on 2707 eligible, complete-case babies in the EPIPAGE 2 cohort and validated using 10-fold cross-validation
Model AUROC 95% CI Sensitivity Specificity Tjur’s Coefficient Hosmer-Lemeshow One predictor 0.60 0.57–0.62 0.91 0.23 0.015 0.003
Ten predictor 0.62 0.59–0.65 0.77 0.42 0.019 <0.001 20 predictor 0.62 0.58–0.72 0.72 0.46 0.020 <0.001 Ten predictor (imputed data)a 0.63 (IQR 0.004) – 0.75 (IQR 0.01) 0.45 (IQR 0.01) 0.019 (IQR 0.001) <0.001
a
babies [19, 33,56]. Building predictive models on infre-quent outcomes presents difficulties for classification and the default 0.50 classification threshold can be inappropriate [44,57]. Regression models built using in-frequent event data can produce negatively biased inter-cepts with underestimated predicted probabilities in the direction of the majority outcome [58–60]. To address this, we used a prevalence dependent threshold of 0.08 to optimise the false positive and true positive rates, as recommended [44–46].
We acknowledge that performance measures de-rived through cross-validation are inferior to those derived from external validation methods using inde-pendent data. However, obtaining external data can often be challenging and cross-validation represents a powerful alternative, especially compared to tech-niques such as split-sampling which can significantly reduce the size of the training and test samples. Fu-ture model building might require the identification of a wider range of predictors. Alternative machine learning techniques, for example penalised regression or random forest analysis, would allow for the con-sideration of many more variables whilst limiting over-fitting.
Conclusion
We conclude that early, unplanned rehospitalisations of very preterm babies affect approximately 9% of our population. Over the 30 days following initial dis-charge there was a generally linear progression of rehospitalisation risk. Ultimately, predicting unplanned
rehospitalisation with a range of clinical, maternal, and socioeconomic predictors proved challenging in our study. Given the cost and burden associated with rehospitalisations, it remains important that we main-tain efforts to better understand and predict such outcomes. This may in turn facilitate the implementa-tion of strategies to prevent unplanned rehospitalisa-tions in preterm babies.
Supplementary information
Supplementary information accompanies this paper athttps://doi.org/10. 1186/s12887-019-1827-6.
Additional file 1. Forty-eight potential predictors of unplanned rehospi-talisation in preterm babies considered for inclusion in predictive models in consultation with field experts. All predictors were derived from the EPIPAGE 2 study.
Additional file 2. Thirty variables included as predictors in multivariate imputation by chained equations for missing data amongst 3841 eligible babies in the EPIPAGE 2 cohort.
Additional file 3. Distribution of ten additional predictor variables amongst 3841 eligible babies in the EPIPAGE 2 cohort by 30-day un-planned rehospitalisation (URH30) status. Including missing values. P-values derived from the chi-squared test for categorical variables and Kruskal-Wallis test for continuous.
Additional file 4. Cumulative probability of no unplanned
rehospitalisation (URH) (and the inverse) over the first 30 days following discharge from birth hospitalisation, amongst 3841 eligible babies in the EPIPAGE 2 cohort. Derived via Kaplan-Meier analysis.
Additional file 5. Cumulative probability of no unplanned
rehospitalisation (URH) (and the inverse) over the first 30-days following discharge from birth hospitalisation by gestational age (GA) category, amongst 3841 eligible babies in the EPIPAGE 2 cohort. Derived via Kaplan-Meier analysis.
Fig. 5 Calibration curve for the cross-validated ten predictor model comparing the observed probability of unplanned rehospitalisation within 30 days with predicted probability across risk deciles developed on 2707 eligible, complete-case babies in the EPIPAGE 2 cohort. Hosmer-Lemeshow testp < 0.001
Additional file 6. Unadjusted (uOR) and adjusted odds ratios (aOR) for the 20 predictor predictive logistic regression model for unplanned rehospitalisation within 30-days (URH30), amongst 2707 eligible complete-case babies in the EPIPAGE 2 cohort.
Abbreviations
aOR:Adjusted odds ratio; AUROC: Area under the receiver-operating charac-teristic curve; BPD: Bronchopulmonary dysplasia; CI: Confidence interval; EPIPAGE 2: Etude épidémiologique sur les petits âges gestationnels /Epidemiological study on small gestational ages; IQR: Interquartile range; IVH: Intraventricular haemorrhage; PMA: Post-menstrual age at discharge; ROC: Receiver-operating characteristic curve; SGA: Small for gestational age; uOR: Unadjusted odds ratio; URH: Unplanned rehospitalisation after index discharge from birth hospitalisation; URH30: Unplanned rehospitalisation within 30 days of index discharge from birth hospitalisation
Acknowledgments
We are grateful for the participation of all families of preterm infants in the EPIPAGE 2 cohort study and for the cooperation of all maternity and neonatal units in France. We thank the EPIPAGE 2 Study Group for its substantial contribution to the conception, design, and acquisition of data and to the revision of the manuscript.
EPIPAGE 2 study group.
Alsace: D Astruc, P Kuhn, B Langer, J Matis (Strasbourg), C Ramousset; Aquitaine: X Hernandorena (Bayonne), P Chabanier, L Joly-Pedespan (Bordeaux), MJ Costedoat, A Leguen; Auvergne: B Lecomte, D Lemery, F Vendittelli (Clermont-Ferrand); Basse-Normandie: G Beucher, M Dreyfus, B Guillois (Caen), Y Toure; Bourgogne: A Burguet, S Couvreur, JB Gouyon, P Sagot (Dijon), N Colas; Bretagne: J Sizun (Brest), A Beuchée, P Pladys, F Rouget (Rennes), RP Dupuy (St-Brieuc), D Soupre (Vannes), F Charlot, S Roudaut; Centre: A Favreau, E Saliba (Tours), L Reboul; Champagne-Ardenne: N Bednarek, P Morville (Reims), V Verrière; Franche-Comté: G Thiriez (Besan-çon), C Balamou; Haute-Normandie: L Marpeau, S Marret (Rouen), C Barbier; Ile-de-France: G Kayem (Colombes), X Durrmeyer (Créteil), M Granier (Evry), M Ayoubi, A Baud, B Carbonne, L Foix L’Hélias, F Goffinet, PH Jarreau, D Mitanchez (Paris), P Boileau (Poissy), L Cornu, R Moras; Languedoc-Roussillon: P Boulot, G Cambonie, H Daudé (Montpellier), A Badessi, N Tsaoussis; Limousin: A Bédu, F Mons (Limoges), C Bahans; Lorraine: MH Binet, J Fresson, JM Hascoët, A Milton, O Morel, R Vieux (Nancy), L Hilpert; Midi-Pyrénées: C Alberge, C Arnaud, C Vayssière (Toulouse), M Baron; Nord-Pas-de-Calais: ML Charkaluk, V Pierrat, D Subtil, P Truffert (Lille), S Akowanou, D Roche; PACA et Corse: C D’Ercole, C Gire, U Simeoni (Marseille), A Bongain (Nice), M Deschamps; Pays de Loire: B Branger (FFRSP), JC Rozé, N Winer (Nantes), V Rouger, C Dupont; Picardie: J Gondry, G Krim (Amiens), B Baby; Rhône-Alpes: M Debeir (Chambéry), O Claris, JC Picaud, S Rubio-Gurung (Lyon), C Cans, A Ego, T Debillon (Grenoble), H Patural (Saint-Etienne), A Rannaud; Guadeloupe: E Janky, A Poulichet, JM Rosenthal (Point à Pitre), E Coliné; Guyane: A Favre (Cayenne), N Joly; Martinique: S Châlons (Fort de France), V Lochelongue; La Réunion: PY Robillard (Saint-Pierre), S Samperiz, D Ramful (Saint-Denis). Inserm UMR 1153: PY Ancel, V Benhammou, B Blondel, M Bonet, A Brinis, ML Charkaluk, A Coquelin, M Durox, L Foix-L’Hélias, F Goffinet, M Kaminski, G Kayem, B Khoshnood, C Lebeaux, L Marchand-Martin, AS Morgan, V Pierrat, J Rousseau, MJ Saurel-Cubizolles, D Sylla, D Tran, L Vasante-Annamale, J Zeitlin.
Authors’ contributions
RAR conceptualised the study, carried out the analyses and drafted the initial manuscript. BK and ASM conceptualised the study, supervised the analyses, and reviewed and revised the manuscript. PYA conceptualised the study, supervised the analyses, reviewed and revised the manuscript and is responsible for the overall funding and project administration of the EPIPAGE 2 cohort study. JZ, VP, HT and PHJ conceptualised the study and reviewed the manuscript. All authors were involved in manuscript review and read and approved the final manuscript.
Funding
The EPIPAGE 2 Study was supported by the French Institute of Public Health Research/Institute of Public Health and its partners the French Health Ministry, the National Institutes of Health and Medical Research, the National Institute of Cancer, and the National Solidarity Fund for Autonomy; grant ANR-11-EQPX-0038 from the National Research Agency through the French
Equipex Program of Investments in the Future; the PremUp Foundation, and the Fondation de France. Robert A. Reed has received funding from the European Union’s Horizon 2020 research and innovation programme under the Marie Skłodowska-Curie grant agreement No 665850. Andrei S. Morgan is funded by Fondation pour la Recherche Médicale (reference
SPF20160936356). The funders had no role in the study design, data collection and analysis, decision to publish or preparation of the manuscript.
Availability of data and materials
Data used in the current study are not publicly available as they contain confidential information but are available from the Scientific Group of the EPIPAGE 2 study for researchers who meet the criteria for access to confidential data on reasonable request.
Ethics approval and consent to participate
Recruitment and data collection occurred only after families had received information and agreed to participate in the EPIPAGE 2 study. The EPIPAGE 2 study was approved by the National Data Protection Authority (CNIL no. 911009) and by the appropriate national ethics committees (Consultative Committee on the Treatment of Data on Personal Health for Research Purposes– reference: 10.626, Committee for the Protection of People Participating in Biomedical Research– reference: CPP SC-2873). Consent for publication
Not applicable.
Competing interests
The authors declare that they have no competing interests.
Author details
1Université de Paris, Epidemiology and Statistics Research Center/CRESS,
INSERM, INRA, F-75004 Paris, France.2Elizabeth Garrett Anderson Institute for
Womens’ Health, UCL, London, UK.3SAMU 93, SMUR Pédiatrique, CHI André
Gregoire, Groupe Hospitalier Universitaire Paris Seine-Saint-Denis, Assistance Publique des Hôpitaux de Paris, Paris, France.4APHP.5, Service de Médecine
et Réanimation Néonatales de Port-Royal, Paris, France.5Department of
Neonatal Medicine, CHU Lille, Jeanne de Flandre, Lille, France.6Clinical
Research Unit, Center for Clinical Investigation P1419, APHP.5, F-75014 Paris, France.
Received: 4 October 2019 Accepted: 8 November 2019
References
1. Chawanpaiboon S, Vogel JP, Moller A-B, Lumbiganon P, Petzold M, Hogan D, et al. Global, regional, and national estimates of levels of preterm birth in 2014: a systematic review and modelling analysis. Lancet Glob Health. 2019; 7(1):e37–46.
2. Moyer LB, Goyal NK, Meinzen-Derr J, Ward LP, Rust CL, Wexelblatt SL, et al. Factors associated with readmission in late-preterm infants: a matched case-control study. Hosp Pediatr. 2014;4(5):298–304.
3. March of Dimes, PMNCH, Save the children, WHO. In: Howson C, Kinney M, Lawn J, editors. Born Too Soon: The Global action report on preterm Birth. Geneva: World Health Organization; 2012.
4. Platt MJ. Outcomes in preterm infants. Public Health. 2014;128(5):399–403. 5. Pavlou M, Ambler G, Seaman SR, Guttmann O, Elliott P, King M, et al. How
to develop a more accurate risk prediction model when there are few events. BMJ. 2015;351:h3868.
6. Moons KGM, Altman DG, Vergouwe Y, Royston P. Prognosis and prognostic research: application and impact of prognostic models in clinical practice. BMJ. 2009;338:b606.
7. Moons KGM, Royston P, Vergouwe Y, Grobbee DE, Altman DG. Prognosis and prognostic research: what, why, and how? BMJ. 2009;338:b375. 8. O’Mahony C, Jichi F, Pavlou M, Monserrat L, Anastasakis A, Rapezzi C,
et al. A novel clinical risk prediction model for sudden cardiac death in hypertrophic cardiomyopathy (HCM risk-SCD). Eur Heart J. 2014;35(30): 2010–20.
9. Maier RF, Blondel B, Piedvache A, Misselwitz B, Petrou S, Van Reempts P, et al. Duration and time trends in hospital stay for very preterm infants differ across European regions*. Pediatr Crit Care Med. 2018;19(12):1153–61.
10. Toomey SL, Peltz A, Loren S, Tracy M, Williams K, Pengeroth L, et al. Potentially Preventable 30-Day Hospital Readmissions at a Children’s Hospital. Pediatrics. 2016;138(2):e20154182.
11. Kripalani S, Theobald CN, Anctil B, Vasilevskis EE. Reducing hospital readmission rates: current strategies and future directions. Annu Rev Med. 2014;65:471–85. 12. Payne NR, Flood A. Preventing pediatric readmissions: which ones and
how? J Pediatr. 2015;166(3):519–20.
13. Kmietowicz Z. Hospitals will be fined for emergency readmissions, says Lansley. BMJ. 2010;340:c3079.
14. Centers for Medicare and Medicaid Services (CMS), HHS. Medicare program; hospital inpatient prospective payment systems for acute care hospitals and the long-term care hospital prospective payment system and Fiscal Year 2014 rates; quality reporting requirements for specific providers; hospital conditions of participation; payment policies related to patient status. Final Rules Fed Regist. 2013;78(160):50495–1040.
15. Brittan M, Shah SS, Auger KA. Preventing pediatric readmissions: how does the hospital fit in? Pediatrics. 2016;138(2):e20161643.
16. Shapiro-Mendoza CK, Tomashek KM, Kotelchuck M, Barfield W, Weiss J, Evans S. Risk factors for neonatal morbidity and mortality among‘healthy,’ late preterm newborns. Semin Perinatol. 2006;30(2):54–60.
17. Mally PV, Bailey S, Hendricks-Muñoz KD. Clinical issues in the Management of Late Preterm Infants. Curr Probl Pediatr Adolesc Health Care. 2010;40(9):218–33. 18. McLaurin KK, Hall CB, Jackson EA, Owens OV, Mahadevia PJ. Persistence of
morbidity and cost differences between late-preterm and term infants during the first year of life. Pediatrics. 2009;123(2):653–9.
19. Regenbogen E, Zhang S, Yang J, Shroyer A, Zhu C, DeCristofaro J. Epidemiological trends among preterm infants with apnea. A twelve-year database review. Int J Pediatr Otorhinolaryngol. 2018;107:86–92. 20. Ambalavanan N, Carlo WA, McDonald SA, Yao Q, Das A, Higgins RD.
Identification of extremely premature infants at high risk of Rehospitalization. Pediatrics. 2011;128(5):e1216–25.
21. Laugier O, Garcia P, Boucékine M, Daguzan A, Tardieu S, Sambuc R, et al. Influence of Socioeconomic Context on the Rehospitalization Rates of Infants Born Preterm. J Pediatr. 2017;190:174–179.e1.
22. Mourani PM, Kinsella JP, Clermont G, Kong L, Perkins AM, Weissfeld L, et al. Intensive care unit readmission during childhood after preterm birth with respiratory failure. J Pediatr. 2014;164(4):749–755.e3.
23. Brissaud O, Babre F, Pedespan L, Feghali H, Esquerré F, Sarlangue J. Rehospitalization of very preterm infants in the first year of life. Comparison of 2 groups: 1997 and 2002. Arch Pediatr Organe Off Soc Francaise Pediatr. 2005;12(10):1462–70. 24. Lee JH, Chang YS. Use of medical resources by preterm infants born at less
than 33 weeks’ gestation following discharge from the neonatal intensive care unit in Korea. J Korean Med Sci. 2015;30(Suppl 1):S95–103. 25. Seki K, Iwasaki S, An H, Horiguchi H, Mori M, Nishimaki S, et al. Early
discharge from a neonatal intensive care unit and rates of readmission. Pediatr Int Off J Jpn Pediatr Soc. 2011;53(1):7–12.
26. Donohue PK, Hussey-Gardner B, Sulpar LJ, Fox R, Aucott SW. Convalescent care of infants in the neonatal intensive care unit in community hospitals: risk or benefit? Pediatrics. 2009;124(1):105–11.
27. Schell S, Kase JS, Parvez B, Shah SI, Meng H, Grzybowski M, et al.
Maturational, comorbid, maternal and discharge domain impact on preterm rehospitalizations: a comparison of planned and unplanned
rehospitalizations. J Perinatol Off J Calif Perinat Assoc. 2016;36(4):317–24. 28. Tomashek KM, Shapiro-Mendoza CK, Weiss J, Kotelchuck M, Barfield W,
Evans S, et al. Early discharge among late preterm and term newborns and risk of neonatal morbidity. Semin Perinatol. 2006;30(2):61–8.
29. Jain S, Cheng J. Emergency department visits and rehospitalizations in late preterm infants. Clin Perinatol. 2006;33(4):935–45 abstract xi.
30. Klein MI, Bergel E, Gibbons L, Coviello S, Bauer G, Benitez A, et al. Differential gender response to respiratory infections and to the protective effect of breast milk in preterm infants. Pediatrics. 2008;121(6):e1510–6. 31. Jeng S-F, Hsu C-H, Tsao P-N, Chou H-C, Lee W-T, Kao H-A, et al.
Bronchopulmonary dysplasia predicts adverse developmental and clinical outcomes in very-low-birthweight infants. Dev Med Child Neurol. 2008;50(1):51–7. 32. Vohr B, McGowan E, Keszler L, Alksninis B, O’Donnell M, Hawes K, et al.
Impact of a Transition Home Program on Rehospitalization Rates of Preterm Infants. J Pediatr. 2017;181:86–92.e1.
33. Barradas DT, Wasserman MP, Daniel-Robinson L, Bruce MA, DiSantis KI, Navarro FH, et al. Hospital utilization and costs among preterm infants by payer: Nationwide inpatient sample, 2009. Matern Child Health J. 2016 Apr; 20(4):808–18.
34. Oncel MY, Arayici S, Simsek GK, Calisici E, Erdeve O, Uras N, et al. Risk factors for hospitalization due to lower respiratory tract infection in preterm infants on Palivizumab prophylaxis. Iran J Pediatr. 2013;23(6):693–700.
35. Lo A, Chernoff H, Zheng T, Lo S-H. Why significant variables aren’t automatically good predictors. Proc Natl Acad Sci. 2015;112(45):13892–7. 36. Feng Z. Classification versus association models: Should the same methods
apply? Scand J Clin Lab Invest. 2010;70(sup242):53–8.
37. Shmueli G, Koppius OR. Predictive analytics in information systems research. MIS Q. 2011;35:553–72.
38. Ancel P-Y, Goffinet F. EPIPAGE 2 writing group. EPIPAGE 2: a preterm birth cohort in France in 2011. BMC Pediatr. 2014;14:97.
39. R Core Team. R: a language and environment for statistical computing. Vienna: R Foundation for statistical Computing; 2013. Available from:http:// www.R-project.org/
40. Altman DG, Royston P. What do we mean by validating a prognostic model? Stat Med. 2000;19(4):453–73.
41. Kattan MW, Gönen M. The prediction philosophy in statistics. Urol Oncol. 2008;26(3):316–9.
42. Beleites C, Neugebauer U, Bocklitz T, Krafft C, Popp J. Sample size planning for classification models. Anal Chim Acta. 2013;760:25–33.
43. Tjur T. Coefficients of determination in logistic regression models—a new proposal: the coefficient of discrimination. Am Stat. 2009;63(4):366–72. 44. Freeman EA, Moisen GG. A comparison of the performance of threshold
criteria for binary classification in terms of predicted prevalence and kappa. Ecol Model. 2008;217(1–2):48–58.
45. Jiménez-Valverde A, Lobo JM. Threshold criteria for conversion of probability of species presence to either–or presence–absence. Acta Oecol. 2007;31(3):361–9.
46. Real R, Barbosa AM, Vargas JM. Obtaining environmental Favourability functions from logistic regression. Environ Ecol Stat. 2006;13(2):237–45. 47. Buuren S. Van, Groothuis-Oudshoorn K. mice: multivariate imputation by
chained equations in R. J Stat Softw. 2011;45(1):1–67.
48. Rubin DB. Multiple Imputation for Nonresponse in Surveys: Wiley; 2008. [Cited 2019 Mar 7]. Available from:https://onlinelibrary.wiley.com/doi/abs/1 0.1002/9780470316696.ch6
49. Clark TG, Altman DG. Developing a prognostic model in the presence of missing data: an ovarian cancer case study. J Clin Epidemiol. 2003;56(1):28–37. 50. Marshall A, Altman DG, Holder RL, Royston P. Combining estimates of
interest in prognostic modelling studies after multiple imputation: current practice and guidelines. BMC Med Res Methodol. 2009;9(1):57.
51. Shouval R, Ruggeri A, Labopin M, Mohty M, Sanz G, Michel G, et al. An integrative scoring system for survival prediction following umbilical cord blood transplantation in acute leukemia. Clin Cancer Res Off J Am Assoc Cancer Res. 2017;23(21):6478–86.
52. Lacaze-Masmonteil T, Truffert P, Pinquier D, Daoud P, Goldfarb G, Vicaut E, et al. Lower respiratory tract illness and RSV prophylaxis in very premature infants. Arch Dis Child. 2004;89(6):562–7.
53. Artetxe A, Beristain A, Graña M. Predictive models for hospital readmission risk: a systematic review of methods. Comput Methods Prog Biomed. 2018;164:49–64. 54. Friebel R, Hauck K, Aylin P, Steventon A. National trends in emergency
readmission rates: a longitudinal analysis of administrative data for England between 2006 and 2016. BMJ Open. 2018;8(3):e020325.
55. Angraal S, Khera R, Zhou S, Wang Y, Lin Z, Dharmarajan K, et al. Trends in 30-Day Readmission Rates for Medicare and Non-Medicare Patients in the Era of the Affordable Care Act. Am J Med. 2018;131(11):1324–1331.e14. 56. Harron K, Gilbert R, Cromwell D, Oddie S, van der Meulen J. Newborn
length of stay and risk of readmission. Paediatr Perinat Epidemiol. 2017; 31(3):221–32.
57. Calabrese R. Optimal cut-off for rare events and unbalanced misclassification costs. J Appl Stat. 2014;41(8):1678–93.
58. Hosmer DW, Lemesbow S. Goodness of fit tests for the multiple logistic regression model. Commun Stat - Theory Methods. 1980;9(10):1043–69. 59. Cramer JS. Predictive performance of the binary Logit model in unbalanced
samples. J R Stat Soc Ser Stat. 1999;48(1):85–94.
60. King G, Zeng L. Logistic regression in rare events data. Polit Anal. 2001;9: 137–63.
Publisher’s Note
Springer Nature remains neutral with regard to jurisdictional claims in published maps and institutional affiliations.