HAL Id: inserm-00664039
https://www.hal.inserm.fr/inserm-00664039
Submitted on 30 Jan 2012HAL is a multi-disciplinary open access archive for the deposit and dissemination of sci-entific research documents, whether they are pub-lished or not. The documents may come from teaching and research institutions in France or abroad, or from public or private research centers.
L’archive ouverte pluridisciplinaire HAL, est destinée au dépôt et à la diffusion de documents scientifiques de niveau recherche, publiés ou non, émanant des établissements d’enseignement et de recherche français ou étrangers, des laboratoires publics ou privés.
Preliminary MRI quality assessment and device
acceptance guidelines for a multicenter bioclinical study:
the GO Glioblastoma Project.
Sylvain Ollivro, Pierre-Antoine Eliat, Eric Hitti, Loan Tran, Jacques de
Certaines, Hervé Saint-Jalmes
To cite this version:
Sylvain Ollivro, Pierre-Antoine Eliat, Eric Hitti, Loan Tran, Jacques de Certaines, et al.. Preliminary MRI quality assessment and device acceptance guidelines for a multicenter bioclinical study: the GO Glioblastoma Project.. Journal of Neuroimaging, Wiley, 2012, 22 (4), pp.336-42. �10.1111/j.1552-6569.2011.00638.x�. �inserm-00664039�
Preliminary MRI Quality Assessment and device
acceptance guidelines for a Multicentre Bio-clinical Study:
the GO Glioblastoma Project.
Sylvain Ollivro • Pierre-Antoine Eliat • Eric Hitti • Loan Tran • Jacques D. de Certaines • Hervé Saint-Jalmes
S. Ollivro • P.A. Eliat • E. Hitti • L. Tran • J.D. de Certaines • H. Saint-Jalmes (✉)
PRISM, Université Rennes 1, IFR 140/Biogenouest, 2 Avenue du Professeur Léon Bernard, Rennes, France
E-mail: herve.saint-jalmes@univ-rennes1.fr - phone: (33) 2 23 23 48 49 S. Ollivro • L. Tran • H. Saint-Jalmes
Cancéropôle Grand Ouest, Rennes, France
P.A. Eliat
IFR 140 (Institut Fédératif de Recherche 140 Génétique Fonctionnelle Agronomie et Santé), Université Rennes 1, Rennes, France
S. Ollivro • E. Hitti • H. Saint-Jalmes
INSERM, Université Rennes 1, U642, Laboratoire Traitement du Signal et de l’Image, Rennes, France
J.D. de Certaines • H. Saint-Jalmes
CRLCC, Centre Eugene Marquis, Rennes, France
S. Ollivro • P.A. Eliat • E. Hitti • L. Tran • J.D. de Certaines • H. Saint-Jalmes
Abstract
It is a major challenge to guarantee homogeneous acquisition during a prospective multicentre
MRI study which makes use of different devices. The goal of the multicentre Grand Ouest
Glioblastoma Project was to correlate MRI quantitative parameters with biological markers
extracted from image-guided biopsies. Therefore, it was essential to ensure spatial coherence
of the parameters as well as the signal intensity and homogeneity. The project included the
same MRI protocol implemented on six devices from different manufacturers. The key point
was the initial acceptance of the imaging devices and protocol sequences. For this purpose,
and to allow comparison of quantitative patient data, we propose a specific method for quality
assessment. A common quality control based on 10 parameters was established. Three pulse
sequences of the clinical project protocol were applied using three objects. A fourth
test-object was used to assess T1 accuracy. Although geometry-related parameters,
Signal-to-Noise Ratio, uniformity and T1 measurements varied slightly depending on the different
devices, they nevertheless remained within the recommendations and expectations of the
multicentre project. This kind of quality control procedure should be undertaken as a
prerequisite to any multicentre clinical project involving quantitative MRI and comparison of
data acquisitions with quantitative biological image-guided biopsies.
Keywords
Introduction
Quality-assessment (QA) protocols are now routinely applied to clinical Magnetic Resonance
Imaging (MRI) devices. There are usually two main issues involved in QA: checking
installation of the new device and longitudinal follow up of MRI system performances. In
most cases, these QA procedures are manufacturer-specific, so they cannot be used for
multicentre projects involving multiple MRI systems from different manufacturers and
operated on different sites. To harmonize test methods, several groups (AAPM, NEMA and
COMAC-BME) [1-9] have proposed QA protocols for MRI. The purpose of these
longitudinal QA protocols is to monitor the performances of the MRI device [10-14]. Stable
technical parameter values lying within the tolerance limits ensure that high-quality
reproducible images can be obtained.
The goal of the multicentre Grand Ouest Glioblastoma Project (GOGP) [15] was to
correlate MRI quantitative parameters with biological markers extracted from stereotactic
image-guided biopsies. Glioblastoma multiforme, the most frequent primary tumour of the
central nervous system, remains one of the most lethal human cancers despite intensive
research. Analysis of glioblastoma intra-tumour heterogeneity is an original approach since
this aspect could provide a key to understanding the origin and recurrence of glioblastoma.
The project aims to utilize existing methods such as Dynamic Contrast Enhancement MRI
(DCE-MRI) or Texture Analysis, which are able to delimit the boundaries of four different
sectors (the necrosis, the tumour, the interface between tumour and parenchyma, isolated
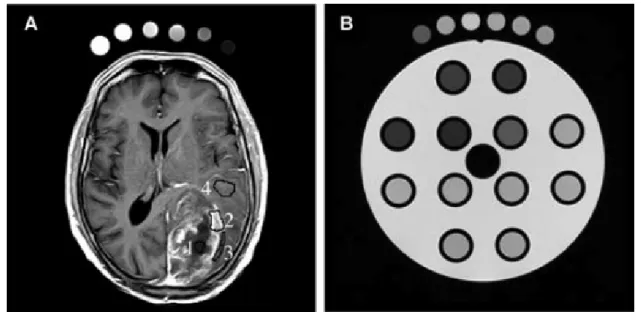
infiltrated cells in normal parenchyma) (see Fig. 1). These methods were used in a specific
and comparative study of glioblastoma cells belonging to these four sectors in the same
patients, using global as well as more specialized approaches (for instance, apoptosis and
glioma metabolism) based on the competences of the research consortium involved. The
contributions to understanding the growth and recurrence of the tumour. The project was
organized into four inter-related Work Packages (WP): WP1: Tumour heterogeneity and
margin by quantitative MRI, WP2: Isolation of the different cell populations by primocultures
from peroperative computer-guided biopsies, WP3: Genomic and proteomic comparative
studies of the four cell populations extracted from four sectors of the glioblastoma, WP4:
Comparative biological studies of the cell populations.
For The WP1 of the GOGP including a common MRI protocol implemented on six
different MRI devices, a key point is the initial acceptance of imaging devices and sequences.
For this purpose, and to allow comparison of quantitative patient data [14], we employed a
specific common protocol for device acceptance based on MRI quality assessment. We
included 6 different MRI devices located at 6 hospital units up to 300 km apart. The aim of
this WP was to find new imaging parameters obtained with non-invasive methods to highlight
the heterogeneity of the glioblastoma and enhance the prognostic grading. Several groups
have attempted to characterize intracranial tumour tissue with various MRI-MRS parameters
such as relaxation time [16, 17], Contrast-Enhanced Dynamic MR Imaging [18], diffusion
MRI [19, 20] and in vivo MRS [21,22]. These previous approaches were usually seldom
coordinated in multicentre studies to establish correlations between parameters extracted from
imaging and data from mechanistic, genomic and proteomic analyses. In the present WP, the
imaging biomarkers need to be correlated with biological biomarkers extracted from biopsies.
Such a programme involves a common acquisition and image processing protocol, which
makes it possible to compare images obtained at the different sites and extract quantitative
parameters. Moreover, it remains to be established whether these parameters and
image-guided biopsy samples refer to the same spatial coordinates. Then, we require quality
assessment of the MRI systems to check that the instruments have homogenous and stable
Materials and methods
MR Imaging systems
Our study included six different 1.5T MRI devices from three manufacturers (Siemens
Medical Solutions, Erlangen, Germany; Philips Medical Systems, Best, Netherlands; General
Electric, Milwaukee, USA). These MRI devices were located at six different centres, which
needed to participate in data collection over a period of two years. Different radiofrequency
head coils were used according to the site. In the following, we refer to the imagers using
letters from A to G. Imagers A, E and G were made by the same manufacturer as C, D and F.
During the GOGP test period, because of obsolescence, device E was replaced by device F on
one site. To allow acceptance of MRI devices in the multicentre project, a QA was performed
on each site. A second QA for verification was carried out on some sites. There were two
controls on imagers A, B, D and G, and one control on imagers C, E and F.
MR Imaging sequences
The GOGP protocol includes routine imaging sequences as well as specific sequences. Using
this protocol, we selected the sequences needed for the quantification of tumour
heterogeneity: i) T1W (SE for GE, Philips and Siemens); ii) T2W (Fast Spin Echo for General
Electric and Turbo Spin Echo for Philips and Siemens) contrast spin echo sequences acquired
for texture analysis purposes [23], which can provide new information not detectable by the
radiologist; iii) T1 contrast gradient echo (Spoiled Gradient echo for General Electric, Fast
Field Echo-T1 for Philips and FLASH for Siemens) with a 90° flip angle (DYN90) as used
for DCE-MRI. This technique allows the calculation and parametric mapping [22] of the
fractional vascular, interstitial and cellular volumes of glioblastomas and iv) another set of T1
contrast spin echo sequences with multiple repetition times (T1SE-Multi TR) was included in
data. Other imaging parameters are listed in Table 1. All user accessible filters except for the
uniformity one were disabled. For these acceptance tests, all acquisitions were performed in
the axial-transverse direction, as this is the slice orientation mainly used for the GOGP
protocol. For the image-guided biopsy, two different software applications were used:
Brainlab (Feldkirchen, Germany) for sites A, E, F and G, and Medtronic Inc (Minneapolis,
USA) for sites B, C and D.
Test-Objects and Image Analysis (see supplementary data 1 for a complete description)
The SpinSafety® test-objects (Spin Safety Ltd, Rennes, France) is a commercially
available version of the Eurospin test-objects previously described [1]. The same set of four
test-objects was used at the six imaging centres. The GOGP imaging protocol for each patient
included dynamic acquisition and T1 measurements using 6 reference tubes containing
solutions with known T1s covering values encountered in the brain. Each site received a set of
six such tubes. During the GOGP imaging protocol, these tubes were placed around each
patient’s head (see Fig. 1a) and used as an external reference for T1 correction. During the
QA protocol, these tubes were imaged along with the TO4 (see Fig. 1b).
The measurement protocol was developed in accordance with the Eurospin Methods
for determining the parameter values following the published recommendations [1, 2, 3, 7, 8,
9]. The total acceptance protocol time for each imager was approximately 2h30 min.
All images were examined by the same QA expert and reported on Excel spreadsheets.
Student t-test for the conformity study and Analysis of Variance (ANOVA) were used to
obtain statistical data. Reproducibility and repeatability were determined according to the ISO
MRI devices acceptance guidelines.
To our knowledge, no international guidelines have yet been proposed for the
acceptance criteria of MRI devices in such a protocol. Such guidelines would be too
dependent on the specific goal of the study. However, based on the few previous studies [12,
25, 26, 27, 28, 29] and as a compromise between technical limitations and optimal
requirements under clinical condition, we decided on the following acceptance guidelines for
the GOGP based on the 10 selected parameters. We wished to attain an accuracy of around 1
mm for the geometrical parameters to enable a good positioning during neuronavigation.
Therefore, the acceptable errors on the geometrical parameters must be in agreement with the
values listed on Table 2. These geometrical data are globally better than the mean clinical
positioning errors quoted in the literature [25], which range from 1 mm with implantable
fiducial markers and point-pair matching to 5 mm with surface matching, while both are
measured when redundant fiducial markers are used [25]. To allow a good quantification of
the tumour heterogeneity using the DCE-MRI and texture analysis, the signal variations must
be as small as possible: 5% of variation seems to be a good compromise. The SNR is a key
parameter for the subsequent T1 measurement procedure, which is needed to compute the
dynamic contrast enhancement parameters used by the GOGP. Hence, we developed a Monte
Carlo simulation under Mathematica® (version 5.1; Wolfram Research, IL, USA) to
propagate the noise [30] measured on images to the errors on computed TI values. The Monte
Carlo simulations of the spoiled gradient echo sequence were ran 10 000 times with the
addition of random Gaussian noise. The T1 values were computed from the signal equation
[31], and the standard deviation on T1 expressed in seconds over the 10 000 runs. Standard
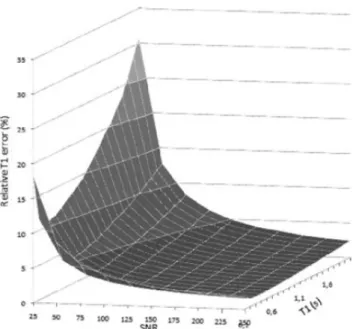
deviation of T1 expressed in percentage is plotted against SNR in the range of 25 to 250 and
for T1 values ranging from 0.1 to 2 s (see Fig. 5). Considering a maximum T1 of 2s, the
minimum SNR of 75. Such a relative error is acceptable [14] for the subsequent dynamic
quantification procedure.
Results
Table 3 summarizes the main results for the three representative sequences (T2W, T1W and
DYN90) of the protocol, reporting the means and standard deviations of the parameter values.
Geometry-related parameters
Spatial resolution (SR) was analysed with an ANOVA test using the sequence as a
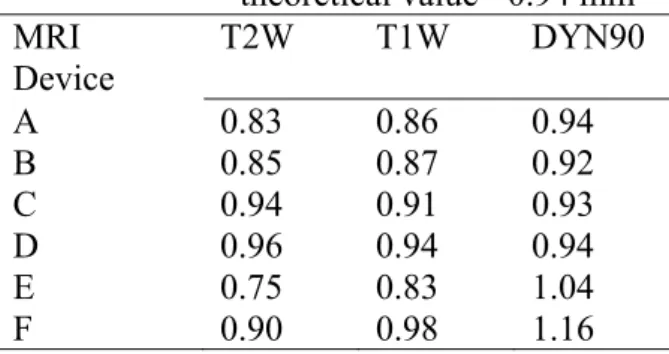
between-subjects factor (i.e., T2W, T1W and DYN90). We observe no consistent main effect
according to the sequences, with means of 0.93, 0.96, and 1.06 for the T2W, T1W and
DYN90, respectively. The Student t-test also indicates that spatial resolution measurements
are close to the theoretical value of 0.94 mm. Furthermore, as can be seen on Table 4, the
results on each device do not exceed our acceptable errors.
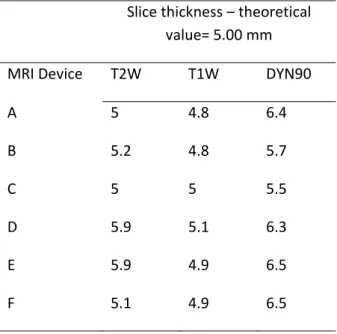
Slice thickness (ST) was analysed with an ANOVA test using the sequence as a
between-subjects factor (i.e., T2W, T1W and DYN90). We observe a consistent main effect
according to the sequences, with means of 5.2 mm, 5.0 mm and 5.8 mm for the T2W, T1W
and DYN90, respectively, F(2, 30) = 12.9, p < 0.0001. The Student t-test also indicates that
slice thickness measurements, except for sequence DYN90, are close to the theoretical value
of 5 mm, with p≤0.001. We note that, for this last sequence, the slice thickness is often greater
that the acceptable error of our clinical study (Table S2, supplementary data 2).
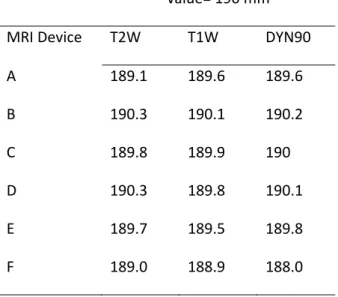
The others parameters (slice position SP, mean diameter GD1, diameter distortion rate
GD2, square side GD3 and diagonal distortion rate GD4) are constant over the sequences and
close to the theoretical values. For example, as presented in Table supplementary data2 S3,
This is slightly more (0.1mm) than our acceptable error. The Student t-test also indicates that
mean diameter measurements are close to the theoretical value of 190 mm.
MR signal-related parameters
Figure 3 presents the detailed results of measurements on each MRI system (A to G) using the
three sequences, yielding SNR values ranging from 76 to 296. The mean SNR ranges from
203 in the case of T2W to 154 in the case of DYN90. The signal variations on frequency
(SVF) and readout (SVR) directions (see Table 2) are less than 5%.
Calculated T1
In this study, we analysed the T1 measurements of TO4 and the external reference tubes. As
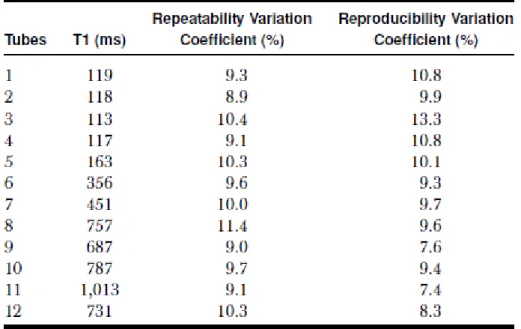
with the other tests, the same TO4 was used at each site. Table 5 reports the mean T1, T1
repeatability and reproducibility variation coefficients for each tube. These statistical data
show that the repeatability variation coefficient ranges from 8.9% to 11.4%, and the
reproducibility variation coefficient from 7.4% to 13.3%.
The reproducibility of the external reference tubes was also checked. As an example,
Fig. 4 gives the results of measurements for one of these tubes taken one year apart at the 6
centres. On this graph, we show the two T1 measurements and the mean T1 for each site. We
can see that the general mean for this external reference tube is 416 ms and the reproducibility
standard deviation is 24 ms.
Discussion
In the context of a multicentre clinical study (the GOGP), we have developed a
protocol to check 10 parameters from signal and geometry-related parameters and T1
assessment. This protocol was disseminated over 6 sites equipped with 1.5T machines from
The precise positioning of the phantom in the transverse plane is not an issue since a
marker is printed on each object so it can be precisely aligned with the laser of the MRI unit.
In this study, we restrict ourselves to transverse acquisitions, while, in common clinical
protocols, the imaging of sagittal or coronal incidence is mainly used, which can also be
checked through a QA procedure. However, this latter approach would require a time
consuming procedure lasting more than three hours, which is difficult to carry out on clinical
sites. Moreover, our goal is not to develop a QA procedure to test the machine but rather to
enable the inclusion of patient data in a specific clinical protocol. We chose transverse
incidence because most of the acquisitions of the GOGP are of this type. The choice of pulse
sequence to be used in QA is also dictated by the clinical protocol, which depends mainly on
spin echo T1, turbo spin T2 and dynamic T1 Gradient echo acquisitions.
The results of the QA for geometrical parameters are accurate to around 2 mm, which
allows a acceptable positioning of the biopsy region by neuronavigation imaging. Distortion
results are comparable, being relatively small and independent of the pulse sequences, as
shown by the standard deviation values. When comparing the slice thickness results between
sequences, DYN90 yields the worst results. Nevertheless, the significantly increased slice
thickness compensates for the inherently lower SNR of this short imaging time sequence (less
than 30 s), at the expense of the partial volume effect.
The SNR obtained for the DYN90 is again lower than the SNR for the T1W and T2W
sequences. During the QA procedure, we obtained a mean measured SNR of 154 for the
DYN90 sequence, which corresponds to a maximum error on T1 of 0.02 s and 0.08 s, for T1
values of 1 s and 2s, respectively (See Figure 5). This represents a relative error on the
computed T1 of less than 4%, which is acceptable [14] for the subsequent dynamic
method [31], the frequency and phase signal variations do not influence these T1
computations.
Moreover, T1 measurements have a good precision in terms of reproducibility and
repeatability. This level of precision is mandatory in the T1 measurement procedure of the
WP1, since it enables a comparison of the dynamic contrast enhancement parameters obtained
at the six centres.
Our choice of sequences for the QA was guided by two principles: first, to have simple
sequences that were sufficiently standardized to be implemented without too much difficulty
on each device, even from different manufacturers, and, second, to stay as close as possible to
the real sequences used in the clinical research protocol we wanted to assess.
The time required for these tests (2h30 for a single control procedure) is not easily
available on clinical machines for monthly follow-up throughout the protocol duration (two
years for GOGP). One solution could be to shorten the procedure by removing the T1
measurements, which take about 1 hour, and also reduce the number of tested sequences.
Performing this “light” procedure lasting about 15 minutes could be used on each system to
check the main geometrical parameters and signal-to-noise ratio on a monthly basis during the
duration of the project. Another time-consuming task is processing all the data gathered
during each QA procedure, which takes about 16 hours. In our study, processing was
performed manually, which could lead to possible errors. An automatic analysis and report
procedure could avoid this source of errors as well as reduce the amount of time needed for
the analysis.
Conclusions
In conclusion, quality assessment testing is mandatory in any clinical research project
involving quantitative MRI. In the GOGP protocol, we used six machines from different
the main pulse sequences of the GOGP clinical protocol using four test-objects to assess
geometry, SNR, uniformity parameters and T1 measurements. As a result of these different
QA tests, we were able to include patients from the different sites and extract tumour
quantification parameters that are comparable irrespective of the origin of the images. In
addition, we could make sure that the extracted MR parameters and image-guided biopsy
samples referred to the same spatial coordinates. It should be mandatory to generalize the
application of this kind of QA procedure from the outset of a multicentre clinical project.
Acknowledgments
The study was supported by “Cancéropôle Grand Ouest” and “Institut National du Cancer”
grants. We gratefully acknowledge the “Centre Hospitalier Universitaire” of Angers, Brest,
Nantes, Rennes, Poitiers, Tours and the “Centre Hospitalier” of Orléans. SO and LT were
supported by a financial grant from Région Bretagne. M.S.N. Carpenter post-edited the
English style.
References
1. EEC concerted research project: protocols and test objects for the assesment of MRI
equipment. Magn Reson Imaging. 1988;6:195-199
2. Lerski RA, McRobbie DW, Straughan K, et al. Multi-center trial with protocols and
prototype test objects for the assessment of MRI equipment. Magn Reson Imaging.
1988;6:201-214
3. Lerski RA, De Certaines JD. Performance assessment and quality control in MRI by
4. Price RR, Axel L, Morgan T, et al. Quality assurance methods and phantoms for magnetic
resonance imaging: report of AAPM Nuclear Magnetic Resonance. Task Goup No. 1a. Med
Phys. 1990;17:287-295
5. Lerski RA. Trial of modifications to Eurospin MRI test objects. Magn Reson Imaging.
1993;11:835-39
6. Och JG, Clarke GD, Sobol WT, et al. Acceptance testing of magnetic resonance imaging
systems: report of AAPM Nuclear Magnetic Resonance Task Group No 6. Med Phys.
1992;19:217-229
7. National Electrical Manufacturers Association. Determination of signal-to-noise-ratio
(SNR) in Diagnostic Magnetic Resonance Imaging. ACR-NEMA 2008
8. National Electrical Manufacturers Association. Determination of Two-Dimensional
Geometric Distortion in Diagnostic Magnetic Resonance Images. ACR-NEMA 2008
9. National Electrical Manufacturers Association. Determination of Slice Thickness in
Diagnostic Magnetic Resonance Imaging. Ref? Année? ACR-NEMA 2003
10. Ihalainen T, Sipilä O, Savolainen S. MRI quality control: six imagers studied using eleven
unified image quality parameters. Eur Radiol. 2004;14:1859-1865
11. Colombo P, Baldassarri A, Del Corona M, et al. Multicenter trial for the set-up of a MRI
quality assurance programme. Magn Reson Imaging. 2004;22:93-101
12. Firbank, M J, Harrison R M, Williams E D, et al. Quality assurance for mri : practical
expérience. BJR 2000 ;73 :376-383.
13. Friedman L, G H Glover. Report on a Multicenter fMRI Quality Assurance Protocol. J
Magn Reson Imaging. 2006;23:827-839
14. De Certaines JD, Henriksen O, Spisni A, et al. In vivo measurements of proton relaxation
times in human brain, liver, and skeletal muscle: a multicenter MRI study. Magn Reson
15. Cancéropôle Grand Ouest. Grand Ouest Glioma Project: from the core to beyond the
margin. France, 2005
16. Kjaer L, Thomsen C, Gjerris F, et al. Tissue characterization of intracranial tumours by
MR imaging. In vivo evaluation of T1 and T2 relaxation behavior at 1.5T. Acta Radiol.
1991;32:498-504
17. De Certaines JD. Measurement and meaning of relaxation times: specific and non-specific
variations in cancer. Ann Ist Super Sanita. 1983;19:107-120
18. Zhu XP, Li KL, Kamaly-Asl ID, et al. Quantification of endothelial permeability, leakage
space, and blood volume in brain tumours using combined T1 and T2* contrast-enhanced
dynamic MR imaging. Magn Reson Imaging. 2000;11:575-585
19. Beppu T, Inoue T, Shibata Y, et al. Fractional anisotropy value by diffusion tensor MRI as
a predictor of cell density and proliferation activity of glioblastomas. Surgical Neurology.
2005;63:56-61
20. Moffat BA, Chenevert TL, Lawrence TS, et al. Functional diffusion map: A noninvasive
MRI biomarker for early stratification of clinical brain tumour response. PNAS.
2005;102:5524-5529
21. Croteau D, Scarpace L, Hearshen D, et al. Correlation between Magnetic Resonance
Spectroscopy Imaging and Image-guided Biopsies: Semiquantitative and Qualitative
Histopathological Analyses of Patients with Untreated Glioma. Neurosurgery.
2001;49:823-829
22. Rock JP, Hearshen D, Scarpace L, et al. Correlations between magnetic resonance
spectroscopy and image-guided histopathology, with special attention to radiation necrosis.
Neurosurgery. 2002;51:912-920
23. Herlidou-Même S, Constans JM, Carsin B, et al. MRI texture analysis on texture test
22. Tofts PS, Brix G, Buckley DL, et al. Estimating Kinetic parameters from dynamic
contrast-enhanced T1-weighted MRI of a diffusible tracer: standardized quantities and
symbols. Magn Reson Imaging. 1999;10:223-232
23. Wang D, Doddrell M. Geometric Distortion in Structural Magnetic Resonance Imaging.
Current Med Imag Reviews. 2005;1:49-60
24. National Electrical Manufacturers Association DICOM website. Available at:
http://medical.nema.org/ Accessed July 31, 2010
25. Novotny J. Jr, Novotny J., Vymazal J., Liscak R., Vladyka V. Assessment of the accuracy
of Stereotactic Target Localization using MRI: a phantom study. J.of Radiosurgery,1998; 1
(2), 99-111.
26. Collewet G, Strzeleck M, Mariette F, Influence of MRI acquisition protocols and image
intensity normalization methods on texture classification, Magn. Reson. Imaging, 2004, 22,
81-91.
27. Mahmoud-Gonheim D, Alkaabi MK, de Certaines JD, Goettsche FM, The impact of
image dynamic range on texture classification of brain white matter, BMC Medical
Imaging,2008, 8 (18).
28. Novotny J Jr, Vymazal J, Novotny J, Tchalacova D. et al., Does new MRI technology
provide better geometrical accuracy during stereotactic imaging?, J Neurosurg (Suppl) 2005,
102, 8-13.
29. Willems PWA, Berkelbach van der Sprenkel JW, Tulleken CAF, et al. Neuronavigation
and surgery of intracerebral tumours. J Neurol 2006;253:1123-1136
30. Tofts PS. Quantitative MRI of the brain. Tofts PS, editor. Institute of Neurology,
31. Eliat PA, Dedieu V, Bertino Catherine, et al. Magnetic resonance imaging
contrast-enhanced relaxometry of breast tumours: an MRI multicenter investigation concerning 100
Fig. 1 Fig 1. (A) Postcontrast brain MR image from T1 dynamic series in axial plane. The four regions of the glioblastoma are labeled: (1) necrosis,
(2) tumor, (3) interface between tumor and parenchyma, (4) isolated infiltrate cells in a normal parenchyma. (B) TO4 and a set of six tubes.
Fig. 2. Relative T1 error plotted against SNR and T1 values for the Dyn90 sequence.
Fig. 3 SNR in different MRI Devices for T2W, T1W and DYN90 sequences
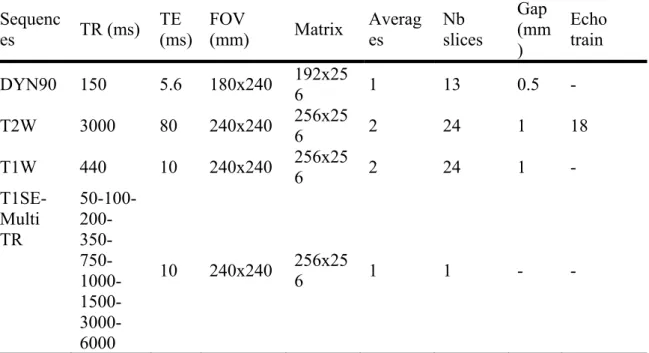
Table 1. Imaging acquisition parameters. Slice thickness is 5 mm in all sequences
TR: Repetition Time. TE: Echo Time. FOV: Field Of View.
Table 2. Acceptable errors for T2W, T1W and DYN90 sequences Parameters Acceptable
Errors
SNR ≥75
Frequency signal variations (%)
5%
Phase signal variations (%) 5% Spatial resolution (0.94 mm) 50% Slice thickness (5 mm) 20% Mean diameter (190 mm) 1% Diameter distortion (%) 1% Square side distortion (%) 1% Diagonal Distortion (%) 1% Slice Position (gap in mm) 1, 0.5*
20% Sequenc
es TR (ms) TE (ms) FOV (mm) Matrix Averages Nb slices
Gap (mm ) Echo train DYN90 150 5.6 180x240 192x256 1 13 0.5 - T2W 3000 80 240x240 256x256 2 24 1 18 T1W 440 10 240x240 256x256 2 24 1 - T1SE-Multi TR 50-100- 200- 350- 750- 1000- 1500- 3000-6000 10 240x240 256x25 6 1 1 - -
Table 3. Mean parameter values, standard deviations for T2W, T1W and DYN90 sequences Parameters T2W T1W DYN90
Mea
n Std Mean Std Mean Std SNR 203 45 184 37 154 59 Frequency signal variations
(%)
3.8 2.6 4.5 2.6 3.9 2.7
Phase signal variations (%) 3.7 2.7 3.6 2.7 2.7 2.7 Spatial resolution (0.94 mm) 0.93 0.15 0.96 0.15 1.06 0.21 Slice thickness (5 mm) 5.2 0.3 5.0 0.1 5.8 0.5 Mean diameter (190 mm) 189. 7 0.6 189. 7 0.6 189. 8 0.8 Diameter distortion (%) 0.6 0.2 0.5 0.2 0.6 0.2 Square side distortion (%) 0.3 0.3 0.2 0.3 0.3 0.3 Diagonal Distortion (%) 0.3 0.3 0.3 0.3 0.2 0.2 Slice Position (gap in mm) 1,
0.5*
0.92 0.15 0.93 0.15 0.51 *
0.15
Table 4. Spatial Resolution in mm for the 3 sequences of each MRI device. Spatial Resolution – theoretical value= 0.94 mm MRI Device T2W T1W DYN90 A 0.83 0.86 0.94 B 0.85 0.87 0.92 C 0.94 0.91 0.93 D 0.96 0.94 0.94 E 0.75 0.83 1.04 F 0.90 0.98 1.16
Table 5. T1 Mean Values, Repeatability, and Reproducibility Variation Coefficients for Each Tube of TO4
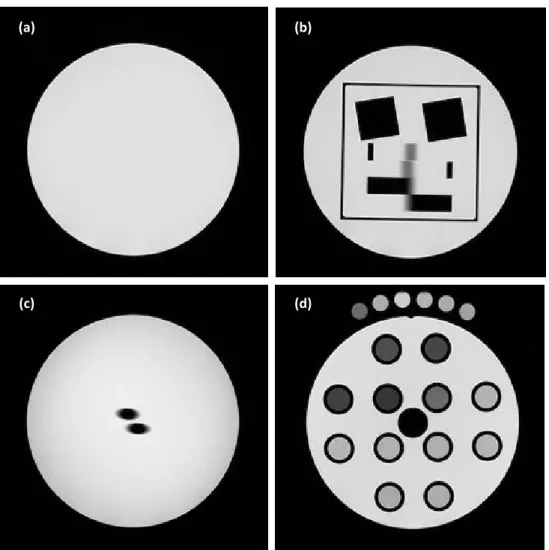
Supplementary data 1 Test-Objects
The SpinSafety® test‐objects (Spin Safety Ltd, Rennes, France) is a commercially available version of the Eurospin test‐objects previously described [1]. The same set of four test‐objects was used at the six imaging centres. They were filled with a dilute solution of copper sulphate to obtain a T1 of 350 ms at 1.5T and 25°C. Figure S1 presents the transverse MRI slice images of the test‐objects. Parameters measured with SpinSafety Test‐Object 1 (TO1) and TO4 were considered to control the quality of GOGP sequences used for T1 measurements and quantification, whereas TO2 and TO3 were considered to control the quality of spatial localization and geometry distortions of sequences used for neuronavigation and MRI‐guided biopsies [23]. TO1 is a homogeneous cylinder designed to be used for the measurement of signal‐related parameters. TO2 is dedicated to the measurement of geometrical parameters; it contains two angled plates and two wedges for measuring slice thickness, two Polymethyl Methacrylate blocks for measuring spatial resolution and four plates in square form used for measuring square and diagonal distortions. TO3 contains two rods used for estimating slice position. TO4 contains 12 tubes filled with solutions having different T1 and T2 relaxation times (see Table S1). The GOGP imaging protocol for each patient included dynamic acquisition and T1 measurements using 6 reference tubes containing solutions with known T1s covering values encountered in the brain. Each site received a set of six such tubes. During the GOGP imaging protocol, these tubes were placed around each patient’s head (see Fig. 1) and used as an external reference for T1 correction. During the QA protocol, these tubes were imaged along with the TO4 (see Fig. S1d).
The measurement protocol was developed in accordance with the Eurospin Methods for determining the parameter values following the published recommendations [1, 2, 7, 8, 9]. The four TOs were positioned in a transverse plane at the centre of the head coil. The ten parameters under examination were: signal variations along frequency encoding direction, signal variations along phase encoding direction, Signal‐to‐Noise Ratio (SNR), slice thickness, slice position, spatial resolution,
mean diameter, circle diameter distortion, square side and diagonal distortions and T1 accuracy (see Table 3). For the three sequences of the protocol (T1W, T2W and DYN90), all these parameters were determined in a transverse plane, using the appropriate TO. Measurement of T1 of the TO4 and the set of six reference tubes was performed with the T1SE‐Multi TR. The total acceptance protocol time for each imager was approximately 2h30 min. Image analysis Images in DICOM [24] format were transferred by each site onto a central Work Station for processing. Signal variations along the frequency and phase encoding directions were calculated by tracing profiles on TO1 images [2]. SNR was obtained by multiplying the mean signal by the square root of 2 and dividing by the standard deviation of the subtracted image resulting from two successive TO scans [7]. Geometrical distortion in the image plane was determined by measuring the mean diameter, the diameter distortion rate, the square distortion rate and the diagonal distortion rate on the TO2. To determine the slice thickness, an intensity profile was measured through an angle plate of the TO3 to calculate the peak width [9]. 2D spatial resolution was obtained by measuring an intensity profile through a block in TO2. The resolution could then be calculated from the Modulation Transfer Function (MTF) [3]. The relative distance of the angle rods of the TO3 was used to obtain slice position. For T1 measurements, signals of the different tubes of TO4 at different repetition times (TR) were fitted to the signal equation of the saturation recovery method using the Solver Program of Microsoft Excel (version 2003, Microsoft Corporation, Seattle, USA). For one manufacturer, specific tools were developed to restore the initial image intensities needed for T1 measurements. The ImageJ software (W. Rasband, National Institutes of health, USA) was used to analyse all the images. All images were examined by the same QA expert and reported on Excel spreadsheets. Student t‐test for the conformity study and Analysis of Variance (ANOVA) were used to obtain statistical data. Reproducibility and repeatability were determined according to the ISO 5725 standard.
Table S1. T1 and T2 values references for the tubes of the TO4. Tubes T1 (ms) T2 (ms) 1 119 9 2 118 10 3 112 9 4 117 9 5 166 13 6 353 56 7 450 64 8 779 83 9 706 77 10 787 98 11 1036 124 12 758 84
Fig. S1 Transversal MRI slice images of the Test Objects (a) TO1, (b) TO2, (c) TO3, (d) TO4 and a set of six tubes
(b)
(c) (d)
Supplementary data 2
Table S1. Imaging assessment parameters Table S2: Slice thickness in mm for the 3 sequences of each MRI device. Slice thickness – theoretical value= 5.00 mm MRI Device T2W T1W DYN90 A 5 4.8 6.4 B 5.2 4.8 5.7 C 5 5 5.5 D 5.9 5.1 6.3 E 5.9 4.9 6.5 F 5.1 4.9 6.5
Parameter Test Object
Frequency signal
variations TO1
Phase signal variations TO1
SNR TO1
Mean diameter TO2
Diameter distortion TO2 Square side distortion TO2 Diagonal distortion TO2 Slice thickness TO2 Spatial resolution TO2
Slice position TO3
Table 8: Mean Diameter in mm for the 3 sequences of each MRI device. Mean Diameter – theoretical value= 190 mm MRI Device T2W T1W DYN90 A 189.1 189.6 189.6 B 190.3 190.1 190.2 C 189.8 189.9 190 D 190.3 189.8 190.1 E 189.7 189.5 189.8 F 189.0 188.9 188.0