Development/Plasticity/Repair
Neurotransmitter Release at the Thalamocortical Synapse
Instructs Barrel Formation But Not Axon Patterning in the
Somatosensory Cortex
Nicolas Narboux-Neˆme,
1,2,3Alexis Evrard,
4,8,9Isabelle Ferezou,
5Reha S. Erzurumlu,
6Pascal S. Kaeser,
7Jeanne Laine´,
1,2,3Jean Rossier,
5Nicole Ropert,
4,8,9Thomas C. Su¨dhof,
7and Patricia Gaspar
1,2,31Institut National de la Sante´ et de la Recherche Me´dicale, UMR-S 839, 75005 France,2Universite´ Pierre et Marie Curie, Paris, 75005, Paris, France,3Institut du Fer a` Moulin, 17, rue du Fer a` Moulin, 75005, Paris, France,4Institut National de la Sante´ et de la Recherche Me´dicale, U603, Laboratory of
Neurophysiology and New Microscopies, 75006 Paris, France,5CNRS, UMR 7637, Laboratoire de Neurobiologie, ESPCI ParisTech, 75005, Paris, France, 6Department of Anatomy and Neurobiology, University of Maryland School of Medicine, Baltimore, Maryland 21201,7Howard Hughes Medical Institute, Stanford University, Stanford, California 94305-5453,8CNRS, UMR 8154, Paris, France, and9Universite´ Paris Descartes, 75006, Paris, France
To assess the impact of synaptic neurotransmitter release on neural circuit development, we analyzed barrel cortex formation after
thalamic or cortical ablation of RIM1 and RIM2 proteins, which control synaptic vesicle fusion. Thalamus-specific deletion of RIMs
reduced neurotransmission efficacy by 67%. A barrelless phenotype was found with a dissociation of effects on the presynaptic and
postsynaptic cellular elements of the barrel. Presynaptically, thalamocortical axons formed a normal whisker map, whereas
postsynap-tically the cytoarchitecture of layer IV neurons was altered as spiny stellate neurons were evenly distributed and their dendritic trees were
symmetric. Strikingly, cortex-specific deletion of the RIM genes did not modify barrel development. Adult mice with thalamic-specific
RIM deletion showed a lack of activity-triggered immediate early gene expression and altered sensory-related behaviors. Thus, efficient
synaptic release is required at thalamocortical but not at corticocortical synapses for building the whisker to barrel map and for efficient
sensory function.
Introduction
Genetic alterations of synaptic transmission underlie a number of
developmental disorders, such as autism spectrum disorders or
mental retardation (Bourgeron, 2009). However, the role of
hard-wired defects of neural circuits in these affections remains
unclear. Neural activity is involved in neuronal network wiring
but no visible change in brain development was observed upon
abolishing synaptic release (Verhage et al., 2000; Molna´r et al.,
2002). Since neurotransmitters and electrical activity have direct
effects on morphogenetic processes such as neuronal growth
(Zhang and Poo, 2001), guidance (Hanson and Landmesser,
2004; Nicol et al., 2007), or gene transcription (Borodinsky et al.,
2004), a large part of the developmental effects of neural activity
could be independent of synaptic activity. However, the role of
synaptic release in later activity-dependent refinement of neural
circuits could not be examined because of early lethality.
Neurotransmitter release is controlled by proteins that prime
vesicles to the presynaptic active zone, where they control vesicle
fusion following Ca
2⫹rise (Sudhof, 2004). Among these
pro-teins, the Rab3 interacting molecules (RIM) family includes
seven isoforms, two of which, RIM1 and RIM2, are expressed
broadly in the brain (Schoch et al., 2006). RIM1 and RIM2 are
central organizers of presynaptic release, interacting with a
num-ber of active zone proteins as well as synaptic vesicle proteins
(Mittelstaedt et al., 2010). Loss of function studies revealed that
RIMs are required for the docking of synaptic vesicles and for the
assembly of calcium channels in the presynaptic active zone
(Deng et al., 2011; Han et al., 2011; Kaeser et al., 2011). RIM1/
RIM2 double knock-out mice show a massive reduction in the
priming and calcium-triggering of neurotransmitter release
(Schoch et al., 2006; Kaeser et al., 2011).
Ablation of RIMs at selected synapses should allow
determin-ing the role of calcium-dependent neurotransmitter release on
late phases of neural wiring. We used the rodent primary
somato-sensory barrel cortex as a model in which neural activity plays a
role in sculpting barrels within the posteromedial barrel subfield
(Erzurumlu and Kind, 2001; Wu et al., 2011). Barrels are
colum-nar processing units that respond preferentially to the
stimula-tion of individual whiskers. The development of a barrel is
initiated by the clustering of thalamocortical (TC) axon
termi-nals, followed by an arrangement of the cortical layer IV neurons
Received Jan. 24, 2012; revised March 9, 2012; accepted March 15, 2012.Author contributions: P.G. designed research; N.N.-N., A.E., I.F., R.S.E., J.L., and N.R. performed research; P.S.K., J.R., and T.C.S. contributed unpublished reagents/analytic tools; N.N.-N., A.E., I.F., R.S.E., J.L., and P.G. analyzed data; N.N.-N., A.E., I.F., R.S.E., N.R., T.C.S., and P.G. wrote the paper.
This work was supported by Institut National de la Sante´ et de la Recherche Me´dicale, Universite´ Pierre et Marie Curie, the Fondation Jerome Lejeune, Domaine d’Intérêt Majeur Neurosciences Re´gion île de France; Agence Nation-ale pour la Recherche (ANR605-neur-046), Ecole des Neurosciences de Paris and NIH/NINDS R01 NS039050 (R.S.E.). We thank Alexandra Rebsam for critical reading of the manuscript and Gaelle Angenard for technical help.
Correspondence should be addressed to Patricia Gaspar, INSERM U839, 17 rue du Fer a` Moulin, 75005, Paris, France. E-mail: patricia.gaspar@inserm.fr.
I. Ferezou’s present address: UNIC, CNRS, UPR-3293, 91198, Gif-Sur Yvette, France. DOI:10.1523/JNEUROSCI.0343-12.2012
and by the orientation of their dendrites toward incoming TC
terminal arborizations (Wu et al., 2011). The formation of barrels
over the first postnatal week depends on neural activity, with the
involvement of both presynaptic and postsynaptic mechanisms
(Iwasato et al., 2000; Hannan et al., 2001; Rebsam et al., 2002;
Gheorghita et al., 2006; Lu et al., 2006; Ballester-Rosado et al.,
2010).
Here we conditionally deleted all multidomain RIM isoforms
in the thalamus causing a severe reduction in evoked release at the
TC synapse. This did not alter the targeting and patterning of the
TC afferents, but severely impaired the dendritic arbor
orienta-tion of target neurons in the somatosensory barrel cortex. In
contrast, mice with a cortex-specific deletion of RIMs showed a
normal barrel organization.
Materials and Methods
Animal breeding
RIM1flox/flox-RIM2flox/flox mice (Kaeser et al., 2008, 2011) were crossed to two different Cre mouse lines to obtain recombination in the thalamus and in the cerebral cortex. Breeding was performed on a mixed background 129Sv⫻ C57BL/6. To minimize potential varia-tion due to background issues, littermate controls of either sex were used for all the experiments and processed simultaneously with the recombined samples.
To obtain thalamic-specific recombination, the serotonin transporter (Sert) Cre mouse line was used. This is a knock-in of nls-Cre in the 5⬘UTR region of Sert (Sl6a4; Zhuang et al., 2005). In these mice, Cre is active in the ventrobasal thalamus (VB) from E15.5 (Narboux-Neˆme et al., 2008). Unexpectedly, some offspring of RIM1flox/flox-RIM2flox/flox breeding with SertCrestrain gave rise to null alleles (RIM⫺allele), indi-cating occasional germline expression of Cre that needed to be controlled in all littermates. In our breeding we usually obtained: Rim1f/⫺Rim2f/⫺ Sertcre/⫹, which are referred to as RIM-DKOSert, and Rim1f/⫺Rim2f/⫺ Sert⫹/⫹, Rim1f/for Rim2f/f, which are referred to as Controls (Ctrl). In their home cages, RIM-DKOSertcould not be distinguished from their control littermates and showed normal survival rates.
For cortex-specific recombination, we used the Emx1-Cre mouse line, a knock-in of Cre in 3⬘ from the stop codon (Iwasato et al., 2000). In these mice, Cre is active in the glutamatergic cortical neurons and in glia but not in GABAergic neurons at E12.5 (Iwasato et al., 2000). Rim recombi-nation with Emx1-Cre strain is referred to as RIM-DKOEmx1, and their littermates were used as controls. The RIM-DKOEmx1mice were smaller than their control littermates and all died around weaning.
We used the TaumGFP-nls-LacZreporter mouse line to check recombi-nation efficiency. This is a knock-in in the Tau gene of a construction containing a stop cassette flanked by loxP sites, a MARCKS sequence fused to the green fluorescent protein (GFP) and an IRES-NLS-LacZ cassette (Hippenmeyer et al., 2005). In the presence of Cre, neurons express a membrane-bound GFP and-Galactosidase (-Gal) in the nucleus.
Experiments were conducted in compliance with the standard ethical guidelines (European Community guidelines on the care and use of lab-oratory animals and French Agriculture and Forestry Ministry guidelines for handling animals).
Genotyping was done on tail lysates prepared by immersing tissue in 50 mMNaOH, at 95°C for 1 h, and then neutralizing with 1MTris-HCl.
PCRs were conducted as previously described (Kaeser et al., 2008, 2011).
RIM1 and RIM2 quantitative PCR
Brains from postnatal day 7 (P7, P0 being the day of birth) RIM-DKOSert, RIM-DKOEmx1and controls were dissected out and directly frozen on liquid nitrogen for 10 s and transferred to dry ice. The VB and somatosensory cortex were microdissected on 120m cryostat section. RNAs were extracted from samples and genomic DNA was removed with “RNAqueous-Micro Kit” (Applied Biosystems). First-strand cDNA was synthesized by reverse transcription of 50 ng of total RNA with Superscript-II reverse transcriptase (Invitrogen) according to standard protocols. Reverse transcriptase was omitted in some samples as negative
control. Relative expression levels of RIM1 and RIM2 mRNA were determined by real time RT-PCR using Absolute SYBR Green Mix (ABgene) and a set of primers specific for the RIM1 and RIM2 floxed sequences. RIM expression was normalized to mouse CyclophilinB mRNA expression. Data were analyzed with the 2–DCt method (Livak and Schmittgen, 2001). Values are expressed as the mean of 3–5 sep-arate experiments, each comprising triplicates.
Tissue preparation
Mice were killed by an overdose of xylazine (1.92 mg/kg body weight, i.p.) and pentobarbital (100 mg/kg i.p.). They were perfused with 4% paraformaldehyde in phosphate buffer. Brains were dissected and either rinsed in PBS for cytochrome oxidase staining, or postfixed overnight at 4°C. Brains were cryoprotected overnight in 30% sucrose in PBS at 4°C before sectioning at 60m with a freezing microtome. To obtain tangen-tial sections, cortices were dissected and flattened between two glass slides with spacers before postfixation.
Histology
The cytochrome oxidase (CO) staining of brain sections was conducted on free-floating sections. They were placed in the CO reaction solution (5 mg diaminobenzidine, 5 mg cytochrome C, 0.4 g sucrose in 0.1 mMTris, pH 7.6) for 12–24 h at 37°C.
Immunocytochemistry was performed on free-floating sections. They were incubated overnight at 4°C in appropriate primary antibodies in-cluding: rabbit polyclonal antibody (Ab) c-Fos (1:1000, Santa-Cruz Bio-technology), rabbit polyclonal Ab CDP/Cux1 (1:500, Santa-Cruz), rabbit polyclonal Ab-Gal (1:5000, Rockland), mouse monoclonal Ab NeuN (1:1000, Millipore), rabbit polyclonal Sert (1:1000, Calbiochem), Guinea pig polyclonal Ab vGlut2 (1:2000, Millipore Bioscience Research Re-agents). After several rinses, species-specific fluorescent secondary Ab (1:500 Invitrogen) were incubated for 2 h, before mounting with Mowiol (Calbiochem). vGlut2 immunohistochemistry was preceded by a 10 min incubation in 50 mMsodium citrate at 97°C. For peroxidase revelation of Sert, biotinylated anti-rabbit (1:300, Vector) followed by avidin-biotin-peroxidase complex (1:400, GE Healthcare) was used before the di-aminobenzidine reaction.
In situ hybridization was performed on free-floating frozen sections as described previously (Narboux-Neˆme et al., 2008). NBT/BCIP was used as blue substrate for in situ revelation. The following plasmids con-taining full-length cDNA were used: RIM1 (IMAGE:40047877) and RIM2 (IMAGE:4505661).
Measures and cell counts
Quantification of areas. vGlut2 immunostained sections were photo-graphed at a⫻1.2 magnification using a stereomicroscope (Olympus). The total cortical area was measured on the tangential sections. The posteromedial barrel subfield (PMBSF) was outlined with ImageJ soft-ware and its area measured. Within this area, the vGlut2-positive regions correspond to the barrel hollows containing the dense TC axon termi-nals. The vGlut2-positive patches were outlined and their areas mea-sured. The total PMBSF area minus the sum of vGlut2-positive areas was used as an estimate of the total interbarrel area. We refer to this value as the septal area in the rest of the manuscript, although strictly speaking, it comprises two different elements, the cellular wall surrounding the hol-lows and a septal region between the barrel walls. Interestingly double immunostainings for vGlut2 and Tenascin, an extracellular glycoprotein that surrounds structural and functional developing barrels in S1 (Cros-sin et al., 1989; Steindler et al., 1990) showed that tenascin-positive re-gions corresponded precisely to the vGlut2-negative rere-gions.
Quantification of neuronal density. Photomicrographs of tangential sections immunostained for vGlut2 and Cux1 were acquired with a 40⫻ objective using a Leica SP2 confocal microscope. The C2 barrel was placed in the center of the field and a single confocal section was ac-quired. The vGlut2-positive area was delimited after automatic thresh-olding using a fixed threshold value (MetaMorph Software). This area was defined as the barrel hollow. A 20m thick belt surrounding the barrel hollow was computed using MetaMorph imaging software. This area was defined as the barrel wall (Ballester-Rosado et al., 2010). The Cux1-positive cell nuclei were counted with the cell counter plug-in
(ImageJ software) within the barrel hollow and the wall compartments. Stereological methods were applied to avoid multiple counting. The cell counts were normalized per surface area for each compartment, provid-ing cell density estimates for the hollow and wall compartments.
Quantification of colocalization. Pictures of coronal sections from P10 SertCre/⫹TaumGFP-ires-LacZand Emx1Cre/⫹TaumGFP-ires-LacZ, immuno-stained for-Gal together with NeuN, were acquired with the confocal microscope. Using the cell counter plug-in of ImageJ, the number of -galactosidase-positive neurons within the NeuN population was mea-sured in the VB and posterior medial (POm) nuclei of the thalamus and in the cerebral cortex layers.
Statistical analysis
All measures were done blind to genotype. For statistical analysis, the distributions of the results were tested with a Shapiro-Wilk test, followed by an f test. We found a normal distribution in the experiments analyzed. In most cases, the variance between groups was similar and a nondirec-tional Student’s t test was applied. When variance was different, a non-directional homoscedastic t test was used. To compare small populations (n⬍ 6), Mann–Whitney tests were applied.
Electrophysiology
TC slice preparation. Animals (P5–P7) were anesthetized by intraperito-neal injection of pentobarbital (15 mg/kg) and decapitated. The brain was quickly removed and placed in ice-cold (2– 4°C) oxygenated (5% O2, 95% CO2) standard artificial CSF (ACSF). TC slices were cut (thickness, 400m) using a vibratome (VT100S; Leica), as previously described (Laurent et al., 2002). The slices were first maintained 1 h at 33°C and later at room temperature (22–24°C) in oxygenated standard ACSF.
Electrophysiological recordings. For recordings, the slices were glued on a polylysine-coated small (1.2 mm diameter) glass coverslip, which was then placed in a small (⬃1 ml) chamber, perfused at 3 ml/min with ACSF at near physiological temperature (33–34°C). Recordings were obtained from layer IV neurons identified under visual control using an upright fixed-stage microscope (Axioskop FS, Zeiss) equipped with infrared No-marski optics and a video camera (Cascade 512B, Roper Scientific). So-matic whole-cell recordings were performed using borosilicate glass pipettes with a tip resistance of 2–3 M⍀ and an Axopatch 200B amplifier (Molecular Devices). The recorded neurons were maintained in voltage-clamp mode using whole-cell patch-voltage-clamp techniques. Membrane ca-pacitance and serial resistance were not compensated. Voltage and current signals were filtered at 5 kHz, digitized at 100 kHz using a digital board (Digidata 1322A, Molecular Devices), and stored on computer. The protocols were generated using the program pClamp10 (Molecular Devices). The series resistance (Rs) was estimated using a short-duration (20 ms) negative voltage step (3 mV) preceding by 200 ms the electrical stimulation of the afferent fibers. Typical Rs, calculated at the beginning of the current step using Ohm’s law, were of the order of 5–20 M⍀, and recordings were discarded when Rs changed by⬎20% during recording. Afferent TC fibers were stimulated by applying short-duration (20s) current steps with an isolated voltage stimulator (DS2A, Digitimer), through bipolar tungsten electrodes (SNEX200x50, Rhodes Medical In-struments) placed on the ascending TC pathway in the internal capsule (IC). As shown previously (Laurent et al., 2002), low-frequency (0.03 Hz) extracellular IC stimulation evoked stable glutamatergic EPSC in the layer IV spiny stellate neurons. The unitary EPSC due to single afferent fiber stimulation (Laurent et al., 2002) was found by progressively in-creasing the stimulation intensity until a plateau unitary response was obtained (see Fig. 2a; Takahashi, 1992; Silver et al., 1996). To unambig-uously define the single fiber unitary EPSC, we plotted the amplitude of the responses in relation with the stimulation intensity. A shown in our previous work at cortical (Laurent et al., 2002), and thalamic (Evrard and Ropert, 2009) synapses, it is sometimes possible to distinguish axonal failure from release failure. In most cases, there was no evidence for axonal failures and the response changes from complete failures at smaller intensity (⬍2.3 mA, Fig. 2a2), to a stable unitary response at higher intensities. In such cases the stimulation intensity was maintained above threshold.
The data were analyzed offline using Clampex (Molecular Devices), Excel (Microsoft), and Igor Pro 4.1 (WaveMetrics). The amplitude of the
AMPA receptor (AMPAR)-mediated component of the EPSC at⫺70 mV was measured between the baseline and the peak of the response by averaging the signal during a short time window (40s). The amplitude of the NMDAR component of the EPSC was measured at⫹30 mV by averaging the current recorded during an identical time window (40s) placed 15 ms after the stimulation. The EPSC failure was measured at ⫺70 mV and was defined as a response that was smaller than twice the SD of the baseline current. The EPSC latency was defined as the time when the EPSC reached 10% of its peak amplitude. Paired-pulse ratios (PPRs) were obtained by applying two stimulations at various time intervals and calculated at⫺70 mV as the second EPSC amplitude divided by the first EPSC amplitude (EPSC2/EPSC1) including failures. The EPSC kinetics was quantified by fitting their decay with a biexponential function y0⫹ Afaste⫺1/fast⫹ Aslowe⫺1/slow, Afastand Aslowbeing the amplitude of the fast and slow components respectively,fastandslowtheir time constant, y0the offset.
Solutions and drugs. All chemicals were purchased from Sigma unless oth-erwise specified. Standard ACSF contained the following (in mM): 126 NaCl,
2.85 KCl, 1.25 KH2PO4, 1.5 MgSO4, 2 CaCl2, 26 NaHCO3, 5 Na-pyruvate and 10 glucose. The following compounds were bath applied:D
-(-)-2-amino-5-phosphonopentanoic acid (D-AP5, 50M; Ascent Scientific),
2,3-dioxo-6-nitro-1,2,3,4-tetrahydrobenzo[f]quinoxaline-7-sulfonamide disodium salt (NBQX, 10M; Ascent Scientific),
[6-imino-3-(4-methoxy-phenyl)-1(6H)-pyridazinebutanoic acid hydrobromide] (gabazine, 10M;
Ascent Scientific).
The intracellular pipette solution contained the following (in mM): 120
Cs methylsulfonate, 10 CsCl, 10 HEPES, 4 K-ATP, 2 MgCl2, 0.4 Na-GTP, and 0.2 EGTA, pH adjusted to 7.35 using CsOH. All voltage values were corrected for a⫺9 mV liquid junction potential.
Pre-embedding immunolabeling electron microscopy
Adult mice (2 Ctrl and 2 RIM-DKOSert) were anesthetized with sodium pentobarbital and transcardially perfused with 4% paraformaldehyde⫹ 0.5% glutaraldehyde in cold 0.1Mphosphate buffer. Brains were further
postfixed in 4% paraformaldehyde⫹ 15% sucrose for 2 h at 4° and then cut in 80m thick coronal sections with a vibratome. Thorough rinses were followed by a blocking step in 5% normal goat serum⫹ 5% BSA and then an overnight incubation at room temperature in guinea-pig polyclonal Ab vGlut2 (1:8000 Millipore Bioscience Research Reagents) diluted in PBS⫹ 2% Normal Goat Serum.
For immunoperoxidase procedures, a biotinylated anti-guinea pig IgG (Vector, CA) was applied as secondary Ab (1/200 in PBS, 2 h), an ABC peroxidase complex (Vectastain Elite) diluted 1/400 was used for ampli-fication and revelation was performed with 0.05% diaminobenzidine as chromogen.
For immunogold labeling, a 4 h incubation in ultra-small gold conju-gate of goat anti-guinea pig IgG (1/100; Aurion) was followed by exten-sive washings, 10 min postfixation in 2% glutaraldehyde, and the 0.7 nm gold beads were then silver enhanced (HQ silver; Nanoprobes).
After OsO4 postfixation (2% for immunoperoxidase labeling, 1% for silver-gold revelation), sections were dehydrated in graded acetone with a 2% uranyl acetate en bloc staining step in acetone 70%, and finally embedded in Epon resin. Ultrathin sections were examined with a Philips CM100 electron microscope, operated at 80 kV and imaged with a Gatan digital camera.
To locate vGlut2-positive synapses within layer IV, the borders of the layer were outlined on a micrograph of the Nissl-stained semithin section immediately preceding the ultrathin sections. Boundary lines were then transferred on a low-magnification electron micrograph to identify the zone in which the positive synapses were examined.
Golgi-Cox
Mice were killed and perfused with 0.9% NaCl. Brains were dissected and soaked in the Golgi-Cox filtrated solution (K2Cr2O735 mM, K2CrO443 mM, HgCl238 mM) for 2 d, rinsed in 30% sucrose for 1 week and sec-tioned at 200 m with a vibratome (Leica VT1000). Sections were mounted on slides, color reacted in 30% NH4OH for 30 min, and fixed in 30% AL4 Kodak photo fixative for 30 min. They were counterstained with cresyl violet, dehydrated and coverslipped with Eukitt (Electron
Microscopy Sciences). Neurons were drawn using a camera lucida with a 100⫻ oil-immersion objective for dendritic analyses. A total of 50 Ctrl and 41 RIM-DKOSertlayer IV spiny stellate cells were reconstructed from 4 mice of each genotype. Morphometric analysis of dendrites was done with NeuronJ software. Asymmetry of dendrites was measured as de-scribed previously (Datwani et al., 2002), briefly, a line was drawn be-tween the tip of each dendrite and the center of the soma. Neurons were considered as asymmetric when 50% or more of these lines representing dendrites were oriented in a 90° angle. Otherwise, they were counted as symmetric. The proportions between genotypes were tested with a2 test. A two dimensional Sholl analysis (Sholl, 1953) was used to analyze dendritic branching patterns. Concentric circles of 10m intervals were brought over each cell with the center of the circles positioned in the middle of the soma. Intersections of different dendritic orders and circles were counted.
The cell count plug-in of the ImageJ program was used to count the number of branches and bifurcation points. The same program was used to count spines on 20m portions of the secondary and tertiary den-drites from stacks of photomicrographs captured using a 100⫻ oil ob-jective on a Leica microscope. Statistical comparisons used ANOVA.
Voltage-sensitive dye imaging
Voltage-sensitive dye (VSD) imaging of the cortical activity evoked by tactile stimulation was performed on 6- to 8-week-old mice under urethane anesthesia (1.7 mg/g), as previously described (Ferezou et al., 2007). Briefly, a large fraction of mouse sensorimotor cortex was exposed unilaterally and stained for 1 h with the VSD RH1691 (Op-tical imaging, 1 mg/ml, in Ringer’s solution containing [in mM]: 135
NaCl, 5 KCl, 5 HEPES, 1.8 CaCl2, 1 MgCl2). After removing the unbound dye, the cortex was covered with agarose (0.5%) and a coverslip. Cortical imaging was done through a tandem-lens fluores-cence microscope (Scimedia), equipped with 2 Leica PlanApo 1⫻ objectives, a 630 nm excitation filter, a 650 nm dichroic, and a long pass 665 nm emission filter. Alternate sequences of images were ac-quired every 20 s (at 500 frames/s), using a CMOS-based camera (MiCam Ultima, SciMedia), with or without piezzo electric stimulus (2 ms) delivered to the right C2 whisker. Data were analyzed using custom-written routines in IgorPro (Wavemetrics). Subtraction of the averaged unstimulated sequences was used to correct for photobleaching.
Sensory-mediated c-Fos expression
All whiskers of adult mice were clipped on the right side, under light anesthesia (ketamine, 100 mg/kg IP). The following day, mice were placed in a cage containing new objects (typically a cardboard tube, two plastic goblets and two balls of paper for each cage). Mice explored this new environment for 1 h, after which they were perfused. For c-Fos immunostaining, brains were sectioned at 50m with a vibratome (Leica VT1000). Immunohistochemistry was performed as described above.
Object exploration
Training and testing were conducted in Plexiglas boxes (white floor, gray walls) of 17⫻ 32 ⫻ 40 cm, in the dark. Before the test, animals were habituated to the empty boxes in 10 min sessions for two consecutive days. For the test, two objects were placed in the boxes and animals were allowed to freely explore for 10 min. Sessions were recorded and analyzed using Viewpoint software. The software determined both the position of the nose and the center of mass of the mouse. Center of mass position over time determined the speed of the mouse during exploration, and object exploration was defined when the nose was within a 2 cm large circle around the object. Eight control and 9 RIM-DKOSertmice were used for this test.
Beam walking test
The test was conducted as described previously (Carter et al., 2001). Briefly, mice were trained for 4 d to walk on an elevated 22 mm section beam to reach a platform. On the trial day, each mouse was given three trials to cross the beam and the time used to do so was noted. When mice did not succeed to reach the platform within 2 min, the trial was consid-ered as a failure. The two best times over the three trials were averaged to
determine each mouse’s crossing time. All failures per genotype were summed and averaged to estimate the probability of failure per trial. Seven Ctrl and 9 RIM-DKOSertmice were used for this test.
Results
Region-specific deletion of RIM genes in the thalamus
or cortex
The presence of RIM1
␣ and RIM1 has been reported as early as
P1 in brain extracts (Kaeser et al., 2008). To determine the
cellu-lar localization of RIM1 and RIM2 expression along the
thalamo-cortical pathway, we performed in situ hybridization (ISH)
analyses from P1 to P14 using full-length probes that recognize
either all RIM1 or all RIM2 splice variants. During the first
post-natal week, RIM1 was broadly expressed in the forebrain with a
stronger expression in the cerebral cortex and weaker expression
in the thalamus (Fig. 1a– d). RIM2 was expressed in partly
over-lapping domains in the thalamus and in the cerebral cortex (Fig.
1e– h).
Cre-mediated recombination of the RIM1 and RIM2 floxed
alleles removes all isoforms expressed from these genes (RIM1
␣,
1, 2␣, 2, and 2␥; Kaeser et al., 2008, 2011), in contrast to the
constitutive
␣-RIM KOs (Schoch et al., 2001, 2006). To optimize
the recombination of the RIM1 and RIM2 genes, heterozygous
RIM1/RIM2 floxed/null mice were used.
To ablate RIMs in the thalamus, the RIM1/RIM2 floxed mice
were crossed to a mouse line expressing Cre recombinase in the
serotonin transporter (Sert, Sl6a4 ) gene, generating
RIM-DKO
Sertmice. Sert is strongly expressed in the major thalamic
sensory relay nuclei during development (Lebrand et al., 1998),
and Cre expression driven by the Sert promoter is efficient in the
thalamus, occurring by embryonic day 15 (E15) (Narboux-Neˆme
et al., 2008). Because Cre is inserted into the Sert locus, care was
taken to maintain only one Cre allele. To evaluate the
percent-age of recombination in the different somatosensory relays, we
crossed Sert-Cre mice with the Tau
mgfp-nls-lacZreporter strain
(Hippenmeyer et al., 2005). After recombination, neurons
ex-press a nuclear
-galactosidase (Fig. 1i,j). X-gal staining revealed
that the somatosensory thalamus relay shows high levels of
re-combination: in the VB nucleus, which receives lemniscal inputs
and projects to cortical layers IV and VI, 96% of the
NeuN-positive neurons expressed
-galactosidase at P10 (n ⫽ 2, 1200
neurons, Fig. 1j). In the POm, which receives paralemniscal
in-puts and projects to the septae in layer IV and to layers Va and I,
89% of the NeuN-positive neurons expressed
-galactosidase
(Fig. 1k,n
⫽ 2 mice, 540 neurons). No recombination was noted
in the brainstem trigeminal nuclei. In the cerebral cortex, some
recombination was noted in the deep layers: 3.25% of layer VI
neurons expressed
-galactosidase (n ⫽ 3 mice, 1050 neurons).
While no recombination was observed in layers I–V.
To quantify the recombination of the RIM genes in the
RIM-DKO
Sertmice, we performed qPCR on thalamic and cortical
ex-tracts from P7 RIM-DKO
Sertbrains. There was a strong
reduction of both RIM1 and RIM2 in the thalamus compared
with control [RIM1: 12% (
⫾1.2%) of control, n ⫽ 3–5 mice, p ⫽
0.018; RIM2: 5% (⫾1.3%) of control, n ⫽ 3–5 mice, p ⫽ 0.012],
and no difference was found in the cerebral cortex [RIM1: 101%
(⫾38%) of control, n ⫽ 3–4 mice, p ⫽ 0.314; RIM2: 94%
(
⫾27%) of control, n ⫽ 3–4 mice, p ⫽ 0.5; Fig. 1k].
To ablate RIM proteins in developing cortical neurons, we
used the Emx1-Cre mouse in which recombination was found to
occur in all excitatory cortical neurons derived from the cortical
plate by E10.5 (Iwasato et al., 2000). Mice derived from
Emx1-Cre
⫻ Tau
mgfp-nls-lacZcrossings confirmed the strong
recombina-tion in the cerebral cortex (Fig. 1l ), showing also scattered
recombination in the thalamus. Quantifications of the
propor-tion of neurons recombined by
-Gal/NeuN colocalization on
confocal images revealed that 87.3% of cortical neurons express
-Gal (n ⫽ 3 mice, 1575 neurons), which corresponds
approxi-mately to the entire population of glutamatergic neurons in the
cortex, while in the VB somatosensory thalamus, 22% of the
neurons expressed
-Gal (n ⫽ 3, 3150 neurons).
RIM-DKO
emx1mice, qPCR showed a strong reduction of
both RIM1 and RIM2 in the cortex compared with control
(RIM1: 14% (
⫾5%) of control, n ⫽ 3–4 mice, p ⫽ 0.029; RIM2:
17% (⫾3%) of control n ⫽ 3–4, mice p ⫽ 0.03), and small
non-significant reduction of RIMs in the thalamus (RIM1: 83%
(⫾14%) of control, n ⫽ 4 mice, p ⫽ 0.5; RIM2: 81% (⫾21%) of
control, n
⫽ 4 mice, p ⫽ 0.35; Fig. 1n).
Deletion of RIMs in the thalamus impairs glutamate release at
the TC synapse
Previous findings showed that the ablation of RIM proteins
causes a massive decrease in evoked EPSC and IPSC amplitudes.
The frequency of miniature EPSC and IPSC (mEPSC and
mIPSC) was also reduced without changing their amplitude. The
reduction of synaptic transmission was associated with a
reduc-tion of the readily releasable pool (RRP) and of the voltage-gated
Ca
2⫹current due to a deficit in the coupling between Ca
2⫹chan-nels and the RRP (Deng et al., 2011; Han et al., 2011; Kaeser et al.,
2011). To test the functional properties of TC synapses in the
barrel cortex, experiments were conducted in P5 to P7 control
and RIM-DKO
Sertmice from the same litters using acute TC
slices (Fig. 2).
The AMPA component of the TC monosynaptic EPSC was
recorded at
⫺70 mV in the presence of gabazine (10
M), and
D
-AP5 (50
M), which are GABA
Aand NMDA receptor
antago-nists, respectively. In control animals, low-frequency (0.03 Hz)
minimal electrical stimulation of the internal capsule (IC) evoked
a stable single fiber unitary EPSC in layer IV spiny stellate
neu-rons (Fig. 2a1,a2) with a small failure rate as previously described
(Laurent et al., 2002). In RIM-DKO
Sertlittermates, EPSCs were
also observed at the same latency (4.9
⫾ 0.2 ms, n ⫽ 9, in control;
4.8
⫾ 0.1 ms, n ⫽ 11, in the RIM-DKO
Sert). However the efficacy
of the TC synaptic transmission, measured as the average
ampli-tude of the unitary responses including failures, appeared much
weaker in RIM-DKO
Sertthan in control mice (34.9
⫾ 4.4 pA, n ⫽
9, in control; 11.6
⫾ 2.6 pA, n ⫽ 11, in RIM-DKO
Sert; p
⬍ 0.0001;
Figure 1. RIM 1 and RIM2 expression and Cre-mediated recombination. a–h, In situ hybridization using RIM1 and RIM2 antisense probes at P2 and P7. a–d, RIM1 is expressed in the somatosensory thalamus (VB; a) and in the cortex with highest expression in deep layers at P2 (b) and upper layers at P7 (d). e–h, RIM2 is broadly expressed in the thalamus including the VB (e), with a low expression in the P2 cerebral cortex (f ) and higher expression at P7 (h). i–n, Recombination induced by Sert-cre and Emx1-cre. Cre mice were crossed with a reporter strain expressing a nuclear-Galactosidase (Taumgfp-nls-LacZ). This recombination, visualized by X-gal staining (i, l ) and-Gal/NeuN double immunolabeling (j, m) shows extensive neuronal recombination in the VB of Sert-cre mice (i, j), and cerebral cortex of Emx1-cre mice (l, m). k, n, Thalamic and cortical mRNAs from P7 brains of both strains were extracted and measured by qPCR. Results for Rim1 are summarized in k for RIM-DKOSertand in n for RIM-DKOEmx1. **p⬍ 0.05. Scale bars: (in a–i, l, 100m; j, m, 25 m.
Fig. 2). This change of synaptic transmission efficacy correlated
with an increased failure rate (4.8
⫾ 2.0%, range 0–16, n ⫽ 9 in
control; 58.9
⫾ 5.8%, range 26–81, n ⫽ 11, in RIM-DKO
Sertmice; p
⬍ 0.0001). Based on previous evidence of unchanged
mEPSC amplitude in the RIM-DKO
Sertmice (Deng et al., 2011;
Han et al., 2011), the failure rate increase seen in the
RIM-DKO
Sertmice should give an average EPSC amplitude of 15.1 pA,
a theoretical value close to the experimental value (11.6 pA),
suggesting that the reduction of synaptic efficacy at the TC
syn-apse of the RIM-DKO
Sertmice is mostly due to a presynaptic
effect on the glutamate release probability. Consistent with a
pre-synaptic modification of the TC transmission, we also observed
an increased coefficient of variation (0.40
⫾ 0.04, n ⫽ 9 in
con-trol; 1.33
⫾ 0.013, n ⫽ 11 in RIM-DKO
Sertmice), and a change of
the paired pulse ratio (PPR) which was estimated by using paired
IC stimulation at several intervals between 20 ms and 1 s (Fig.
2b1,b2). At 20 ms, the PPR calculated as the ratio between the
second and first EPSC amplitude (EPSC2/EPSC1) was
signifi-cantly increased in the RIM-DKO
Sert(0.87
⫾ 0.08, n ⫽ 8 in
control; 2.15
⫾ 0.37, n ⫽ 9 in the RIM-DKO
Sertmice; p
⬍ 0.01;
Fig. 2b3).
To test whether the expression of the postsynaptic ionotropic
glutamatergic receptors by the layer IV neurons was affected in
RIM-DKO
Sertmice, single fiber IC stimulations were used in
presence of gabazine (10
M). The NMDA/AMPA ratio,
mea-sured at the peak of the NMDA component of the EPSCs at
⫹30
mV and the AMPA component at
⫺70 mV (Fig. 2c1,c2). This
ratio was similar in controls (2.22
⫾ 0.37, n ⫽ 9) and
RIM-DKO
Sertmice (1.77
⫾ 0.27, n ⫽ 11; Fig. 2c3), indicating that the
relative proportion of postsynaptic AMPA and NMDA receptors
Figure 2. Reduction of the TC synaptic transmission in the RIM-DKOSertmice. The TC synapses were analyzed in P5 to P7 brain slices preserving the TC pathway. TC axons were stimulated at low frequency (0.03 Hz) in the internal capsule and the TC EPSCs were recorded in layer IV neurons. a1, a3, Superimposed individual responses show failures (1) and single afferent fiber EPSC (2) in control (a1) and RIM-DKOSert(a3) mice. a2, a4, The peak amplitude of the AMPA component of the evoked TC EPSC is plotted against the IC stimulation intensity for the same recordings in control (a2) and RIM-DKOSert(a4 ) mice. This curve was plotted for every recording to find out the stimulation intensity needed to record a single afferent fiber unitary EPSC, that is 2.4 mA in control and 1.7 mA in RIM-DKOSertmice. a5, Summary data (mean⫾ SEM) showing a 60% reduction of the evoked TC unitary EPSC amplitude in the RIM-DKOSert(n⫽ 11; gray) compared with control (n ⫽ 9; black) mice. The amplitude of the unitary EPSC includes the failures. The reduction of the unitary EPSC is associated with an increase of the failure rate (*** p⬍ 0.001). b1, b2, Paired-pulse stimulation experiments at various intervals (0.05 s, 0.2 s, 1 s) showed paired pulse depression of the TC EPSCs in control (b1) and paired pulse facilitation in RIM-DKOSert(b2) mice. b3, Summary data of the paired-pulse ratio at various intervals (0.05 s, 0.1 s, 0.2 s, 0.5 s, 1 s) in control (n⫽ 9, black curve) and RIM-DKOSert(n⫽ 11, gray curve) mice. c1, c2, The amplitude of the AMPA and NMDA components of the TC EPSC were obtained by recording EPSC at⫺70 mV and ⫹30 mV in control (c1) and RIM-DKOSert(c2) mice. c3, This NMDA/AMPA ratio was found similar in control (2.22⫾ 0.37, n⫽ 9) and RIM-DKOSert(1.77⫾ 0.27, n ⫽ 11) mice.
is unchanged when presynaptic RIMs
are lacking. The fast AMPA
receptor-mediated EPSC recorded at
⫺70 mV was
followed by a slower component with
variable amplitude, likely due to the
acti-vation of kainate receptors following
glu-tamate release at the TC synapse (Kidd
and Isaac, 1999). We found no significant
difference in the relative amplitude and
kinetics of the two components of the
EPSC in control and RIM-DKO
Sertmice
(A
fast/A
fast⫹ A
slowbeing 0.86
⫾ 0.03 and
0.90
⫾ 0.02, p ⫽ 0.33, in control and
RIM-DKO
Sertmice, respectively;
fast
being
3.10
⫾ 0.4 ms and 2.35 ⫾ 0.42, p ⫽ 0.21,
in control and RIM-DKO
Sertmice,
re-spectively;
slowbeing 91.36
⫾ 10.11 and
175.14
⫾ 135.61, p ⫽ 0.78 in control and
RIM-DKO
Sertmice, respectively). Together
these results indicate that the expression of
ionotropic glutamate receptors is
un-changed in layer IV spiny stellate cells of the
RIM-DKO
Sertmice.
Overall, these experiments indicate
that the combination of RIM1 and RIM2
KOs at the TC synapses reduces the
effi-cacy and reliability of the TC transmission
without affecting the expression of
iono-tropic glutamate receptors in layer IV
spiny stellate cells.
Deletion of RIM genes in the thalamus
or cortex does not affect the
somatosensory topographic map made
by incoming TC axons
The development of a normal architecture
of the barrel cortex comprises two
coor-dinated events: first, the formation of
periphery-related patterns by the sensory
TC afferents, and second, the clustering of
layer IV neurons. The emergence of TC
periphery-related patterns begins by P3 in
mice. Patterning is first noted in PMBSF
that corresponds to the large whiskers,
and then by P5 in the anterior lateral
bar-rel subfield (ALBSF) that corresponds to
the sinus hair representations (Senft and
Woolsey, 1991; Rebsam et al., 2002).
We analyzed the general topography
and laminar distribution of the developing
TC axons by Sert immunohistochemistry
which labels the TC axons as a population at
P7 (Lebrand et al., 1998). We found that the
laminar position of the TC axonal clusters in
cortical layers IV and VI was unchanged in
RIM-DKO
Sert(n
⫽ 6) and RIM-DKO
Emx1(n
⫽ 6) compared with control (n ⫽ 12)
mice (Fig. 3a–c
⬘).
To analyze the segregation of TC
affer-ents into whisker-related patterns, vGlut2
immunostaining was performed on
tan-gential sections from flattened P7
hemi-spheres in the RIM-DKO
Sertand the
Figure 3. Laminar and tangential distribution of TC axons in S1 of RIM-DKOSertand RIM-DKOEmx1mice. a–c, To analyze the TC tracts and laminar distribution of TC axons in RIM-DKOSertand RIM-DKOEmx1mice, SERT-immunocytochemistry was performed in coronal sections of P7 brains. In the three genotypes: control (a), RIM-DKOSert(b), and RIM-DKOEmx1(c), thalamic axons reach the cortical layers VI and IV where they arborize into well delimited clusters (aⴕ–cⴕ). d–f, To evaluate the topographic map formed by TC axons in a tangential plane, vGlut2 immunohistochemistry was performed on serial tangential sections of flattened cortical hemispheres of P7 mice. The sections through layer IV were photographed and analyzed. The TC clusters corresponding to the barrels of the principal whiskers in the PMBSF are clearly delimited in control (d) RIM-DKOSert(e) and RIM-DKOEmx1(f ) mice; Increase in the septal intervals between barrel rows in the RIM-DKOSert cortex is shown with arrowhead in e. g, j, quantification method: the PMBSF area was delimited by joining the external boundaries of the vGlut2 stained patches corresponding to the five rows of the main vibrissae (delineated in pink). The area covered by the individual TC patches/barrels was measured (white areas) and the septal area was calculated as the difference between these two areas (blue area). h, i, histograms showing the summed area of each individual patch in the PMBSF, normalized to area measured in the control, in the RIM-DKOSert(h) and the RIM-DKOEmx1(i) mice; k, l, quantifi-cation of the septal/PMBSF area ratio in RIM-DKOSert(k) and RIM-DKOEmx1(l ) mice. AL: anterolateral barrel subfield, dg: digits; PMBSF: posteromedial barrel subfields, A–E: barrel rows, 1–5: barrel columns. Scale bars: a, 500m; a=, 100 m;
RIM-DKO
Emx1mice (Fig. 3d–f ). In all
ge-notypes, clusters of TC terminals
corre-sponding to the different body parts were
observed. Both the principal
whisker-related patterns of the PMBSF and the
barrels corresponding to digits and the
smaller TC axonal clusters of the ALBSF
were sharply outlined (Fig. 3d– g).
How-ever, in the PMBSF of the RIM-DKO
Sertmice, TC clusters appeared smaller with
larger interbarrel space (called septae for
convenience see Materials and Methods,
Measures and cell counts; compare Fig.
3d,e). We measured the area of each TC
cluster in the PMBSF as the dense patch of
vGlut2-immunostaining (Fig. 3g). In the
RIM-DKO
Sertsamples, the summed area of
individual barrels was reduced by 22%
com-pared with controls (Fig. 3h; p
⫽0.0077).To
measure the septal area, we outlined the
contours of the PMBSF and subtracted the
area covered by the TC patches (Fig. 3j). The septal area was
increased in the RIM-DKO
Sertsamples (Ctrl: 21
⫾ 0.6%
RIM-DKO
Sert: 29
⫾ 1% of the total PMBSF area, p ⬍ 0.001; Fig. 3k).
Similar measures in RIM-DKO
Emx1mice showed no change in the
size of TC patches (Fig. 3i), or the size of the PMBSF, the area
occu-pied by the TC terminals (RIM-DKO
Emx1: 93
⫾ 3% of control,
p
⫽ 0.54, Fig. 3i), or the septal regions (Ctrl: 24 ⫾ 2%;
RIM-DKO
Emx1: 27
⫾ 1%; p ⫽ 0.29; Fig. 3l).
We further examined the maturation of TC synapses at the
ultrastructural level. Because TC synapses represent only 10% of
the total complement of asymmetric synapses in layer IV in the
somatosensory cortex (Benshalom and White, 1986),
anti-vGlut2 immunolabeling was used for their specific identification
(Nahmani and Erisir, 2005). In 2 months old mice, TC
vGlut2-labeled terminal butons in layer IV were large, filled with round
synaptic vesicles, and faced perforated postsynaptic densities in
both control and RIM-DKO
Sert(Fig. 4).
These results indicate that RIM function in either the
thala-mus or the cortex was not required for the formation by afferent
TC axons of a somatosensory map with precise ordering of
pe-riphery related patterns. Lack of RIMs in thalamic neurons
caused a reduction in the size of TC terminal clusters in layer IV
of the barrel cortex, but no change in synapse formation and
ultrastructure.
Deletion of RIM genes in the thalamus but not in the cortex
causes a barrelless phenotype
Shortly after the arrival of TC axons in layer IV, spiny stellate
neurons adopt a ring-like distribution around each TC axonal
cluster (Rice and Van der Loos, 1977), becoming more densely
packed on the external boundary of the clusters. We evaluated the
organization and density of layer IV neurons with regard to the
TC axonal clusters using the nuclear stains DAPI or Cux1
immu-nostaining that labels a vast majority of glutamatergic layer IV
neurons (Nieto et al., 2004; Ferrere et al., 2006). In mice, where
only RIM1, or only RIM2 isoforms were invalidated in the
thal-amus, the neurons in cortical layer IV formed normal ring-like
arrangements around the TC clusters, including the smaller
bar-rels corresponding to the sinus hair representations (Fig. 5a–c
⬘).
However, when both RIM1 and RIM2 were deleted from the
thalamus, cortical neurons showed an even distribution in the
barrel walls and center (Fig. 5d,d⬘,f). To quantify these changes,
the density of Cux1-positive neurons was measured in the C2
barrel (Fig. 5e– h). Neuronal density in the hollow was similar in
control and recombined mice (Ctrl: 4873
⫾ 429 neurons/mm
2;RIM-DKO
Sert: 4777
⫾ 282 neurons/mm
2), but was reduced in
the barrel wall (Ctrl: 6815
⫾ 387 neurons/mm
2;RIM-DKO
Sert:
5267
⫾ 278 neurons/mm
2). The wall/hollow cell density ratio
was greatly reduced in the RIM-DKO
Sertmice (Fig. 5i; Ctrl:
1.42
⫾ 0.06 n ⫽ 6; RIM-DKO
Sert: 1.1
⫾ 0.03, n ⫽ 8; p ⫽ 0.001).
Thus, there is a barrelless phenotype in the RIM-DKO
Sertmice.
Quantification in RIM-DKO
Emx1mice (Fig. 5g,j) showed no
change in the clustering of the layer IV neurons (wall/hollow cell
density ratio: Ctrl: 1.32
⫾ 0.05 (n ⫽ 6); DKO
Emx1: 1.35
⫾ 0.03
(n
⫽ 6); p ⫽ 0.58). In both RIM-DKO
Sertand RIM-DKO
Emx1mouse strains, barreloids were clearly visible in the thalamus by
CO reaction (data not shown). The alterations in the
organiza-tion of layer IV neurons in RIM-DKO
Sertmice persisted
through-out adult life, as observed with Nissl staining or by the uniform
distribution of ROR
, a layer IV neuronal marker which
expres-sion level was not modified (data not shown).
These results indicated that RIM function is required in the
thalamus but not in the cerebral cortex for the development of
barrels in the somatosensory cortex. RIM function in this process
appears to require both the RIM1 and the RIM2 genes, as deletion
of either of these genes in the thalamus was insufficient to cause
barrel formation defects.
Modified dendrite organization in the RIM-DKO
Sertmice
The formation of barrels involves a reorganization of the
den-drites of layer IV neurons that become polarized toward the
cen-ter of the TC axonal patches, and acquire an asymmetric
branching morphology (Rice and Van der Loos, 1977). To
eval-uate the dendritic organization of layer IV neurons, Golgi
analy-ses were done in adult RIM-DKO
Sert(n
⫽ 4) and control (n ⫽ 4)
mice. Fifty control and 41 RIM-DKO
Sertlayer IV spiny stellate
neurons were reconstructed and analyzed. One representative
neuron for each genotype is shown in Figure 6 (Fig. 6a,b). Cells
were qualified as asymmetric when
⬎50% of the dendrites were
distributed within one quadrant (Fig. 6a,a⬘,b,b⬘) as described
previously (Datwani et al., 2002). The percentage of asymmetric
spiny stellate neurons was smaller in RIM-DKO
Sertthan in
con-trol mice (Fig. 6c,d; 21% vs 70%; n
⫽ 4 each, p ⫽ 0.028, Mann–
Whitney). The dendritic span of the spiny stellate neurons,
Figure 4. TC synapses form normally in RIM-DKOSert. a– c, Ultrastructural analysis of the TC synapses. vGlut2 pre-embedding immunocytochemistry was performed and revealed with diaminobenzidine (a, b) or gold (c). In control (a) and RIM-DKOSert(b, c) mice, the terminal boutons are filled with synaptic vesicles and form asymmetric synapses that are frequently fenestrated (arrow-heads). Scale bar: (in a) a–c, 500m.
measured as the areas projected in a two-dimensional plane, was
more than doubled in the RIM-DKO
Sertmice (12,205
⫾ 688
m
2) compared with control mice (5885
⫾ 418
m
2; p
⬍ 0.001).
This can be explained by the loss of asymmetry and by an increase
in the length of dendrites visible in the Sholl analysis: dendrites of
RIM-DKO
Sertmice cross circles up to 150
m diameter around
the cell soma, whereas in controls the limit is 120
m. In addition,
dendrites from RIM-DKO
Sertneurons had more intersections
than controls with every circle from 50 to 90
m (n ⫽ 4 for each
genotype, p
⬍ 0.05 for 50 and 90
m p ⬍ 0.001 for 60, 70 and 80
m; Fig. 6e). Moreover, a tendency for a moderate increase in
dendritic branch endpoints was noted in the RIM-DKO
Sertmice
(14.2
⫾ 0.7 dendrites/cell), compared with controls (13.4 ⫾ 0.4
dendrites/cell; n
⫽ 4 each, p ⫽ 0.123, Mann–Whitney) with a
reduced dendritic complexity, as the number of primary branches
increased (control 3.3
⫾ 0.09 dendrite/cell; RIM-DKO
Sert: 4.1
⫾
0.1; n
⫽ 4 each, p ⫽ 0.029, Mann–Whitney) while the number of
third and fourth degree branches was reduced (Fig. 6f ). Finally,
counts of the number of spines along randomly selected 20
m
segments of the secondary and tertiary dendrites of the layer IV
Figure 5. Deletion of RIM1–2 in the thalamus alters barrel development. Cortices from control, RIM1-KOSert, RIM2-KOSert, and RIM-DKOSertmice were tangentially sectioned through layer IV and labeled for vGlut2 to reveal TC terminals (a–d) and DAPI to reveal the nuclei of cells in layer IV (aⴕ–dⴕ).a–d,Thewhisker-relatedpatternsasrevealedwithvGlut2immunocytochemistryaresimilar in all 4 genotypes. In the small anterior snout barrels: aⴕ–dⴕ,DAPIstainingrevealsanormalbarrel-likeorganizationoflayerIVcellsinthecontrol(aⴕ),theRIM1-KOSert(bⴕ)andtheRIM2-KOSert(cⴕ) in the RIM-DKOSertmice, however, layer IV neurons are uniformly distributed (dⴕ). Scale bar: 50m. (e–j) Double immunolabeling of vGlut2-positive TC axons and Cux1-positive layer IV cortical neurons in P7 tangential sections through principal barrels of the PMBSF in control (e), RIM-DKOSert(f ) and RIM-DKOEmx1(g) mice. The barrel-like organization of layer IV neurons is visible with Cux1 labeling in control (f ) and DKOEmx1(g) mice. In contrast Cux1-labeled neurons are uniformly distributed in the DKOSertmice (f ). h, To estimate neuronal density in the barrel septae and hollows, a mask was computed based on the intensity of vGlut2-positive staining (the barrel hollow), and another mask was drawn surrounding it as 20-m-thick band (the barrel wall). Density of neurons was counted in these 2 areas (i, j). Histograms show the ratios of neuronal density between the walls and the hollows; and values were individually plotted (diamonds). This wall/hollow ratio is significantly reduced in RIM-DKOSertmice compared with controls (i), whereas the wall/hollow ratio is unchanged in RIM-DKOEmx1compared with controls (j). ***p⬍ 0.001; n.s., nonsignificant. Scale bars: a (for a–dⴕ), e (for e–h), 50m.
neurons (Fig. 6g,h) showed a significant increase in the density of
spines in the RIM-DKO
Sertcompared with control mice [Fig. 6i,
secondary: 17.4
⫾ 1.4 vs 11.5 ⫾ 0.4 spine/20
m for controls, n ⫽
4 each, p
⫽ 0.0143; tertiary: 19.1 ⫾ 1.5 (n ⫽ 3) vs 12.7 ⫾ 0.7 for
controls (n
⫽ 4) spine/20
m, each, p ⫽ 0.0286; Mann–Whitney
tests].
These results suggest that reduced efficacy of synaptic
trans-mission at the TC synapse causes significant structural changes in
the dendritic differentiation and organization of layer IV spiny
stellate neurons, with a lack of acquisition of a polarized dendritic
arborization, and an increase in branch and spine numbers.
Sensory-evoked responses are altered in RIM-DKO
Sertmice
To evaluate the long term consequences of altered presynaptic
release at the TC synapse on processing of somatosensory
infor-mation, we performed in vivo voltage-sensitive dye (VSD)
imag-ing of cortical activity evoked by tactile sensory stimulation. This
method is based on the use of dye molecules that transduce
mem-brane potential changes into optical fluorescent signals (Grinvald
and Hildesheim, 2004). Using conventional epifluorescence
op-tics on the mouse cortex in vivo, it allows the visualization of
membrane potential changes occurring in superficial layers
(Fe-rezou et al., 2006). A large part of the left dorsal cortical surface,
covering most of the sensorimotor cortex, was imaged under
urethane anesthesia using the dye RH1691. As previously
de-scribed (Ferezou et al., 2007), a single right C2 whisker deflection
induced a short latency (8 –12 ms) response in the C2 barrel
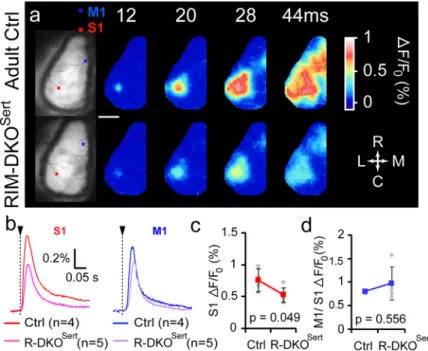
column of the contralateral PMBSF (S1; Fig. 7a). The amplitude
of this response was significantly reduced in RIM-DKO
Sertmice
(n
⫽ 5) compared with control animals (n ⫽ 4, p ⫽ 0.049; Fig.
7b,c), although its location and latency were not modified.
Within 28 ms after whisker stimulation, the evoked activity
spreads within the entire S1, and propagates toward the whisker
motor cortex (M1). This propagation of the activity was
un-changed in RIM-DKO
Sertmice compared with controls (Fig.
7b,d). These results showed that although there is a significant
reduction of the amplitude of the sensory driven responses in the
RIM-DKO
Sertmice, the spatiotemporal dynamics of the
intra-cortical activity was unchanged.
We also tested the consequences of this reduced thalamic
syn-aptic drive on the activity-modulated gene expression.
Expres-sion of immediate early genes such as c-Fos is triggered in the
somatosensory cortex, and in layer IV in particular, by sensory
exploration in naturalistic conditions (Staiger et al., 2000). Mice
were placed in an environment containing several objects that
differed by their textures and shape and c-Fos expression was
evaluated 1 h later. To identify the response to sensory
explora-tion versus nonspecific activaexplora-tion of cortical neurons, all
whis-kers were clipped on one side of the snout. In control mice, there
was a fivefold increase in the number of c-Fos-positive neurons in
the S1 region of the unclipped side relative to the clipped side
(Fig. 8a,a⬘,c). In RIM-DKO
Sertmice, c-Fos expression in layer IV
was strongly reduced in both the clipped and the unclipped sides
(Fig. 8b,b⬘,c), in comparison with controls, although a small
de-Figure 6. Morphology of layer IV cortical neurons in RIM-DKOSertmice. a, b, Camera lucida drawings of Golgi-Cox-stained spiny stellate neurons in the barrel cortex. Typical layer IV neurons from control (a) and RIM-DKOSert(b) are illustrated. (aⴕ, bⴕ) to measure dendritic orientation, lines were drawn from the tip of each dendrite to the center of the cell soma; and the number of lines per quadrant was taken as an index of dendritic symmetry. c, d, The pie charts present the percentage of assymetric/symetric profiles for control (c) and RIM-DKOSert(d) mice. e, Sholl analysis: the histograms represent the mean number (⫹SEM) of dendrites crossing concentric rings drawn at 10m intervals from the cell soma.f, Histogram depicting the mean⫹ SEM of first, second, third, and fourth order dendritic branches of spiny stellate neurons in control and DKOSertmice. g, h, micrographs of Golgi stained second and third order dendrites. Spines appear to be more numerous in the RIM-DKOSertneurons (h), than in controls (g). i, Histogram of the mean⫹ SEM spine counts on 20-m-long sections of second and third order dendrites of neurons from RIM-DKOSertand control brains. **p⬍ 0.05. Scale bar, 20m.
gree of activation could be noted when comparing the clipped/
unclipped side of the mutants, which may be related to the
residual transmission in nonrecombined neurons (estimated to
4 –11%, see Results, Region specific deletion of RIM genes).
These results indicated that reduced transmitter release at the TC
synapse profoundly impacts activity-dependent gene expression
in the layer IV of the somatosensory cortex.
Overall, these experiments indicated that decreased
neurotrans-mitter release at the TC synapse, diminished sensory-evoked
re-sponses but had even stronger effects on the activity-dependent gene
expression which was almost abolished.
Behavioral consequences in RIM-DKO
Sertmice
To evaluate the functional consequences of the morphological
and physiological changes of sensory processing on behavior, we
began by examining motor exploratory behavior of the adult
mice when placed in a familiar nonstressful context containing
novel objects to explore. Total locomotor behavior, measured
with video tracking, was unchanged in the RIM-DKO
Sert(3.8
⫾
0.4 mm/s n
⫽ 9) compared with controls (3.8 ⫾ 0.3 mm/s n ⫽ 9;
Fig. 8d), and animals whisked while exploring the novel objects.
However, interestingly the time spent exploring these novel
ob-jects was increased in the RIM-DKO
Sert(44
⫾ 16 s n ⫽ 9)
com-pared with controls (25
⫾ 7 s; n ⫽ 8, p ⫽ 0.043; Fig. 8e). This
increase is consistent with observations of increased thigmotaxis
in rats that have undergone a lesion of the primary
somatosen-sory cortex (Luhmann et al., 2005), and can be interpreted as
indicating defective sensory integration. To further evaluate
sen-sorimotor performance, we tested mice in the beam walking test,
that has previously been noted to be disturbed in barrelless
MAOA-KO mice and normalized in MAOA-5-HT1B DKO with
rescued barrel formation (Salichon et al., 2001). During
success-ful trials, the RIM-DKO
Serttook a
signif-icantly longer time to traverse the beam
(34.44
⫾ 9.3 s, n ⫽ 8, p ⫽ 0.037)
com-pared with their control littermates
(9.86
⫾ 4.3 s, n ⫽ 7; Fig. 8f). In addition,
Rim-DKO
Sertmice had a strong
proba-bility to fail crossing the beam on a given
trial (29.6
⫾ 11.7%, n ⫽ 9, p ⫽ 0.016)
compared with controls (no failure, n
⫽
8; Fig. 8g).
These results indicated that although
general motor activity was not visibly
altered in the RIM-DKO
Sert,
sensorimo-tor integration was defective in these
mice.
Discussion
Using regional ablation of the RIM1 and
RIM2 proteins at TC or corticocortical
synapses, we find that synaptic release at
TC but not at corticocortical synapses is
necessary for the formation of barrels as
cellular specializations in the mouse
neocortex. Our results also show that
presynaptic control of TC transmission
is dispensable for the formation of a
topographic map by the incoming TC
axons. Decreased evoked release at the
TC synapse almost abolished
sensory-evoked immediate early gene expression
in the cortex.
Presynaptic release is required at TC but not corticocortical
synapses for barrel formation
The importance of synaptic glutamate release for barrel
develop-ment has previously been suggested in mutants with defective
synaptic release at the TC synapse (Lu et al., 2006; Erzurumlu and
Gaspar, 2012). However, a causal link was difficult to establish
because of the pleiotropic effects of these mutations. Our
obser-vations stress the importance of the TC synaptic input for the
refinement of cortical circuits in the barrel cortex, since the
thalamus-specific deletion of RIM1 and RIM2 affected the
corti-cal barrel structure whereas cortex-specific deletion did not. TC
synapses have a high probability of release early in development,
before barrel emergence (Laurent et al., 2002; Yanagisawa et al.,
2004) at a critical period when they evoke long-term potentiation
(LTP) (Crair and Malenka, 1995). Thus, perturbing the efficiency
of this synapse is likely to have important consequences on the
plasticity of the postsynaptic cortical neurons. At the time of
barrel cortex development, a spindle-like network activity has
been recorded in the S1 cortex (Khazipov et al., 2004; Minlebaev et
al., 2007; Yang et al., 2009). This activity is driven by the thalamic
afferents and the stimulation of the whisker pads (Minlebaev et al.,
2011), and is therefore well suited to play a driving role in the
estab-lishment of a columnar organization in the cerebral cortex.
Because a vast majority of the glutamatergic synapses in the
cerebral cortex and in the barrel field in particular, are
cortico-cortical (Benshalom and White, 1986; Douglas et al., 1986) it
appeared surprising that RIM deletion in excitatory neurons of
the cerebral cortex in RIM-DKO
Emx1had no visible effect on the
normal development of the barrel architecture. This indicated
that neurotransmitter release by intrinsic corticocortical barrel
circuits, and subplate to layer IV connections which amplify
tha-Figure 7. Cortical sensory processing is altered in RIM-DKOSertmice. a, VSD imaging of cortical activity evoked by single whisker (C2) deflection in control and RIM-DKOSertmice. Typical responses are illustrated in the upper panel: the first images on the left show resting fluorescence of VSD-stained unilateral craniotomies. The squares indicate the regions of interest used to quantify the signal on the C2 barrel column of the primary somatosensory cortex (S1, red square) and in the primary motor cortex (M1, blue square). Adjacent images show the VSD fluorescence changes at different times following a single right C2 whisker deflection. Scale bar, 2 mm. b, Averaged responses from control mice and RIM-DKOSertmice, quantified from S1 (left) and M1 (right). c, Peak amplitudes of the sensory responses measured in S1. d, Ratio M1/S1 (means⫾ SD for each group).