Decomposing transverse momentum balance contributions
for quenched jets in PbPb collisions at √sNN = 2.76 TeV
The MIT Faculty has made this article openly available.
Please share
how this access benefits you. Your story matters.
Citation
The CMS collaboration, et al. “Decomposing Transverse Momentum
Balance Contributions for Quenched Jets in PbPb Collisions at
√sNN =2. 76 TeV.” Journal of High Energy Physics, vol. 2016, no. 11,
Nov. 2016. © 2016 The Authors
As Published
http://dx.doi.org/10.1007/JHEP11(2016)055
Publisher
Springer Nature
Version
Final published version
Citable link
http://hdl.handle.net/1721.1/115959
Terms of Use
Creative Commons Attribution 4.0 International License
Detailed Terms
http://creativecommons.org/licenses/by/4.0/
JHEP11(2016)055
Published for SISSA by Springer
Received: September 8, 2016 Accepted: October 30, 2016 Published: November 9, 2016
Decomposing transverse momentum balance
contributions for quenched jets in PbPb collisions at
√
s
NN= 2.76 TeV
The CMS collaboration
E-mail: cms-publication-committee-chair@cern.ch
Abstract: Interactions between jets and the quark-gluon plasma produced in heavy ion collisions are studied via the angular distributions of summed charged-particle transverse
momenta (pT) with respect to both the leading and subleading jet axes in high-pT dijet
events. The contributions of charged particles in different momentum ranges to the overall
event pT balance are decomposed into short-range jet peaks and a long-range azimuthal
asymmetry in charged-particle pT. The results for PbPb collisions are compared to those
in pp collisions using data collected in 2011 and 2013, at collision energy√sNN = 2.76 TeV
with integrated luminosities of 166 µb−1 and 5.3 pb−1, respectively, by the CMS
experi-ment at the LHC. Measureexperi-ments are presented as functions of PbPb collision centrality,
charged-particle pT, relative azimuth, and radial distance from the jet axis for balanced
and unbalanced dijets.
Keywords: Jet substructure, Heavy Ion Experiments, Heavy-ion collision, Quark gluon
plasma
JHEP11(2016)055
Contents
1 Introduction 1
2 The CMS detector 3
3 Jet and track reconstruction 3
4 Event selection 4
5 Analysis procedure 5
5.1 Pair-acceptance correction 5
5.2 Separation of correlations into jet-peak and long-range components 6
5.3 Corrections and systematic uncertainties 7
6 Results 9
6.1 Measurement of radial jet momentum density profile 10
6.2 Azimuthal distribution of charged-particle transverse momentum 10
6.3 Integrated hemisphere momentum balance 14
7 Summary 18
The CMS collaboration 24
1 Introduction
High transverse momentum (pT) jets originating from partons produced in the initial hard
scatterings in ultra-relativistic heavy ion collisions have been used successfully to study
the properties of the quark-gluon plasma (QGP) [1]. The observation of the jet quenching
phenomenon, first at the BNL RHIC [2, 3] and then at the CERN LHC [4–7], began
the era of detailed experimental studies trying to assess both the redistribution of energy from the parton as it interacts with the QGP, and the possible QGP response to the propagating parton. In these studies, a suppression of strongly interacting hard probes has been observed, including suppression of charged-particle yields associated with jets when compared with pp data at the same center-of-mass energy. The dependence of jet quenching on the collision centrality (i.e. the degree of the overlap of the two colliding nuclei, with fully-overlapping nuclei defined as “0% central”), has also been established, with stronger quenching effects reported for more central collisions. Detailed studies at CMS and ATLAS report that not only the suppression of jet yields, but also the relative differences between the momenta of the leading and subleading jets in dijet events increase in more central collisions, indicating that the jet quenching effect depends on the path length of the parton
JHEP11(2016)055
traversing the medium [4–6]. Corresponding measurements from the most peripheral (i.e.
least central) PbPb data in these studies and from pPb collisions [8] are found to be
similar to those in pp collisions, implying that the jet quenching phenomenon is caused by hot nuclear matter effects. Recently, CMS reported results showing the difference in the
distribution of charged-particle pT between the subleading and leading jet hemispheres in
PbPb events with asymmetric dijets [9]. In these results, it is found that low-pT particles
extending to large angles away from the dijet axis in the subleading hemisphere must be considered in order to recover the momentum balance in these events. In addition to these
momentum balance studies, precise measurements of the fragmentation pattern [10] and
the distribution of charged-particle pT as a function of radial distance from the jet axis [11],
have also shown that the jet structure is modified by the medium. These modifications extend to large distances in relative pseudorapidity (∆η) and relative azimuth (∆φ) with
respect to the jet axis [12]. These studies have found softening of the jet fragmentation in
PbPb collisions with respect to pp events, with the most significant excess of soft-hadron yields observed in more central PbPb events.
The analysis presented in this paper probes the details of the momentum distribution in dijet events, taking advantage of the high production rates for dijet events at the LHC, and
the CMS detector’s ability to measure charged-particle tracks over an extended η and pT
range. Two-dimensional correlations between the reconstructed jets and charged-particle tracks (jet-track correlations) are constructed in ∆η and ∆φ. These correlations are used to
decompose the overall event pT distribution into three components: two 2D Gaussian-like
peaks associated with the leading and subleading jets, and an azimuthal asymmetry in the distribution of momentum under the jet peaks. Results for each component are presented as a function of ∆φ, and the jet momentum density profile (“jet shape”) is also presented as a function of the radial distance from the jet axis in the ∆η-∆φ plane. Measurements are performed differentially in collision centrality, charged-particle transverse momentum
(ptrkT ), and dijet asymmetry. These detailed differential studies provide input for theoretical
models that attempt to describe the patterns of energy loss by a highly-energetic probe passing through the QGP.
The data used in this analysis are from PbPb collisions at a nucleon-nucleon
center-of-mass energy of 2.76 TeV, corresponding to an integrated luminosity of 166 µb−1. For
the reference measurement, pp data taken in 2013 at the same energy corresponding to an
integrated luminosity of 5.3 pb−1 are used. These studies allow for a detailed
characteriza-tion of the two-dimensional (in ∆η and ∆φ) ptrkT distributions for charged-particle tracks
with respect to the jet axes, providing information about the topology of the event from
the jet perspective and details about the ptrkT flow modification in dijet events.
In this paper, section2gives general information about the CMS detector, and section3
outlines jet and track reconstruction procedures for PbPb and pp data. Section4describes
the selection of events, while section 5 details the procedure applied to analyze these
events and evaluate systematic uncertainties. Section 6 presents results as a function of
∆r (section 6.1), ∆φ (section6.2), and integrated transverse momentum balance over the
JHEP11(2016)055
2 The CMS detector
The central feature of the CMS apparatus is a superconducting solenoid of 6 m internal diameter, providing a magnetic field of 3.8 T. Within the solenoid volume are a silicon pixel and strip tracker, a lead tungstate crystal electromagnetic calorimeter (ECAL), and a brass and scintillator hadron calorimeter (HCAL), each composed of a barrel and two endcap sections. Two hadronic forward (HF) steel and quartz-fiber calorimeters comple-ment the barrel and endcap detectors, providing coverage up to |η| < 5.2. In this analysis,
the collision centrality is determined using the total sum of transverse energy (ET) from
calorimeter towers in the HF region (covering 2.9 < |η| < 5.2). The ET distribution is used
to divide the event sample into bins, each representing 0.5% of the total nucleus-nucleus hadronic interaction cross section. A detailed description of centrality determination can
be found in ref. [6].
Jet reconstruction for this analysis relies on calorimeter information from the ECAL and HCAL. For the central region (|η| < 1.74) from which jets are selected for this analysis, the HCAL cells have widths of 0.087 in both η and φ. In the η–φ plane, and for |η| < 1.48, the HCAL cells map on to 5×5 ECAL crystal arrays to form calorimeter towers projecting radially outwards from close to the nominal interaction point. Within each tower, the energy deposits in ECAL and HCAL cells are summed to define the calorimeter tower
energies, subsequently used to provide the energies and directions of hadronic jets [13].
Accurate particle tracking is critical for measurements of charged-hadron yields. The CMS silicon tracker measures charged particles within the range |η| < 2.5. It consists of 1,440 silicon pixel and 15,148 silicon strip detector modules. For nonisolated particles of
1 < pT < 10 GeV and |η| < 1.4, the track resolutions are typically 1.5% in pT and 25–90
(45–150) µm in the transverse (longitudinal) impact parameter [14]. Performance of the
track reconstruction in pp and PbPb collisions will be discussed in section 3.
A detailed description of the CMS detector, together with a definition of the coordinate
system used and the relevant kinematic variables, can be found in [15].
3 Jet and track reconstruction
For both pp and PbPb collisions, jet reconstruction in CMS is performed with the anti-kT
algorithm, as implemented in the FastJet framework [16, 17], using a distance parameter
R = 0.3. Jets are reconstructed offline (i.e. after raw data is recorded) based on energy deposits in the CMS calorimeters. Raw jet energies are obtained from the sum of the tower energies and raw jet momenta from the vectorial sum of the tower momenta, and are corrected to establish a relative uniform response of the calorimeter in η and a calibrated
absolute response in pT. For PbPb collisions, the CMS algorithm “HF/Voronoi” is used
to estimate and subtract the heavy-ion underlying event based on information from HF
energy measurements as well as Voronoi decomposition of particle flow [9, 18]. For pp
collisions, the contribution from the underlying event is negligible and no underlying event subtraction is employed.
JHEP11(2016)055
Monte Carlo (MC) event generators have been used for evaluation of the jet and track
reconstruction performance. Jet events are generated by the pythia MC generator [19]
(version 6.423, tune Z2 [20]). Simulated events are further propagated through the CMS
detector using the Geant4 package [21] to simulate the detector response. In order to
account for the influence of the underlying PbPb event, the pythia events are embedded
into fully simulated PbPb events, generated by hydjet [22] (version 1.8) that is tuned
to reproduce the total particle multiplicities, charged-hadron spectra, and elliptic flow at all centralities. The embedding is done by mixing the simulated signal information from pythia and hydjet, hereafter referred to as pythia+hydjet. These events are then propagated through the same jet and track reconstruction and analysis procedures as pp and PbPb data.
The jet energy scale (JES) is established for pp using pythia events and for PbPb using pythia+hydjet events in classes of event centrality. The accuracy of the reconstruction
and correction procedure is tested as a function of jet pT and η, by comparing a sample of
reconstructed and corrected jets to the jets originally simulated in that sample. To account for the dependence of the JES on the fragmentation of jets, an additional correction is
applied as a function of reconstructed jet pT and as a function of the number of tracks
with pT > 2 GeV within a radius ∆r < 0.3 around the jet axis. This correction is derived
separately for pp and PbPb data, as described in ref. [9].
For studies of pp data and pythia simulation, tracks are reconstructed using the
same iterative method [14] as in the previous CMS analyses of pp collisions. For PbPb
data and pythia+hydjet simulation, a dedicated heavy-ion iterative track reconstruction
method [11,23] is employed. Tracking efficiency for charged particles in pp collisions ranges
from approximately 80% at pT ≈ 0.5 GeV to 90% or better at pT ≈ 10 GeV and higher.
Track reconstruction is more difficult in the heavy-ion environment due to the high track multiplicity, and tracking efficiency for PbPb collisions ranges from approximately 30% at 0.5 GeV to about 70% at 10 GeV . Detailed studies of tracking efficiency and of tracking
efficiency corrections (derived as a function of centrality, ptrk
T , η, φ, and local charged
particle density) can be found in ref. [9].
4 Event selection
The events for this analysis are selected using the CMS high-level trigger (HLT), with
an inclusive single-jet trigger with a threshold of pT > 80 GeV [24]. This trigger is fully
efficient in both PbPb and pp data for events containing offline reconstructed jets with
pT > 120 GeV . In order to suppress noncollision-related noise due to sources such as
cosmic rays and beam backgrounds, the events used in this analysis are also required to
satisfy offline selection criteria as documented in refs. [6, 25]. These include restricting
PbPb events to those containing a reconstructed vertex with at least two tracks and a z position within 15 cm of the detector center, and in which at least 3 GeV energy is deposited in at least three HF calorimeter towers on each side of the interaction point.
A dijet sample is selected using criteria matched to those of previous CMS analyses
JHEP11(2016)055
selection, events are first required to contain a leading calorimeter jet with pT,1> 120 GeV
in the range of |ηjet| < 2, and a subleading jet of pT,2 > 50 GeV, also in |ηjet| < 2. Once
the leading and subleading jets in the event have been identified, a tighter |ηjet| selection
is applied to ensure stable jet reconstruction performance and good tracker acceptance for tracks on all sides of each jet: only events in which both leading and subleading jets
fall within |ηjet| < 1.6 are included in the final selected data sample. The azimuthal
angle between the leading and subleading jets is required to be at least 5π/6. No explicit requirement is made either on the presence or absence of a third jet in the event. This jet sample is further divided based on the asymmetry between the leading and subleading
jets, AJ = (pT,1− pT,2)/(pT,1+ pT,2). Two asymmetry classes are considered: the more
balanced part (defined by AJ < 0.22) of the total dijet sample, and the more unbalanced
part (defined by AJ > 0.22). The dividing value AJ = 0.22 is chosen for consistency
with previous CMS analyses [5, 9]. In this analysis, 52% of PbPb events are balanced,
while 67% of pp events are balanced. For the PbPb data, the centrality of the collisions is also considered and results are compared for central events (with centrality 0–30%) versus peripheral events (with centrality 50-100%).
5 Analysis procedure
Dijet events in this analysis are studied differentially in collision centrality, with the fol-lowing bins: 0–30% (most central), 30–50% (not shown), and 50–100% (most peripheral).
This analysis follows the procedure established in refs. [12, 26]: two-dimensional ∆η–∆φ
correlations with respect to the measured subleading and leading jet axes are constructed
for charged-particle tracks in the event with ptrkT ≥ 0.5 GeV and |ηtrack| < 2.4, in several ptrk
T
bins. These correlations are weighted by ptrk
T on a per-track basis, and normalized by the
number of jets in the sample. This produces two-dimensional ∆η–∆φ average per-jet
dis-tributions of ptrkT with respect to the leading and subleading jets. After the construction of
the initial two-dimensional correlations described above, the remaining analysis procedure consists of the following steps, which will be discussed in detail below:
• A pair-acceptance correction, derived by the “mixed event” method [12,26];
• The separation of correlations into jet-peak and long-range components;
• Corrections for jet reconstruction biases: a full simulation-based analysis is conducted to determine and subtract the correlated yield produced by jet selection bias.
5.1 Pair-acceptance correction
With jet acceptance of |ηjet| < 1.6, many tracks within |∆η| < 2.5 of a jet will fall outside
of the track acceptance of |ηtrack| < 2.4, resulting in correlation geometry that falls with
increasing ∆η. To correct for this pair-acceptance effect, a mixed-event distribution is constructed by correlating jets from the jet-triggered event sample with tracks from a sample of minimum bias events, matched in vertex position (within 1 cm) and collision
JHEP11(2016)055
Njets denotes the number of dijet events selected as described in a given data sample. The
per-jet associated yield, weighted per-track by ptrkT is defined as:
1 Njets d2P pT d∆η d∆φ = M E(0, 0) M E(∆η, ∆φ)S(∆η, ∆φ). (5.1)
The signal pair distribution, S(∆η, ∆φ), represents the ptrkT -weighted yield of jet-track pairs
normalized by Njets from the same event:
S(∆η, ∆φ) = 1
Njets
d2ΣpsameT
d∆η d∆φ. (5.2)
The mixed-event pair distribution,
M E(∆η, ∆φ) = 1
Njets
d2Nmix
d∆η d∆φ, (5.3)
is constructed to account for pair-acceptance effects, with Nmix denoting the number of
mixed-event jet-track pairs.
Signal and mixed event correlations are both corrected for tracking efficiencies on a
per-track basis, using the efficiency parametrization defined as a function of centrality, ptrkT ,
η, φ, and local charged-particle density, as in ref. [9]. The ratio M E(0, 0)/M E(∆η, ∆φ)
establishes the correction normalization, with M E(0, 0) representing the mixed-event asso-ciated yield for jet-track pairs going in approximately the same direction and thus having full pair acceptance.
5.2 Separation of correlations into jet-peak and long-range components
After the mixed-event correction, correlations to the leading and subleading jets show a Gaussian-like peak confined to the region |∆η| < 1.5, on top of a significant
combina-torial and long-range-correlated background. To separate the long-range
azimuthally-correlated and unazimuthally-correlated distributions under the peaks from jets, the “sideband” regions 1.5 < |∆η| < 2.5 of both the leading and subleading jet acceptance-corrected correlations are projected into ∆φ. Previous studies have found no ∆η-dependence of the long-range
underlying event distributions in this |∆η| range [12,30]. Figure 1 illustrates these
long-range distributions in ∆φ for pp, most peripheral PbPb, and most central PbPb data
for representative bins at low (upper panels) and high (lower panels) ptrkT of the tracks
in unbalanced dijet events (with AJ > 0.22). For illustration, the range |∆φ| < π/2 of
the leading and subleading long-range ∆φ distributions are shown as a combined 2π dis-tribution, with the subleading jet distribution shifted by π to show the full underlying event correlation with respect to the leading jet direction. The visible asymmetry in this long-range distribution in pp data is attributed to the presence of additional jets and other contributions that must, by momentum conservation, be present on the subleading side of the unbalanced dijet system.
To isolate the Gaussian-like leading and subleading jet peaks, this long-range dis-tribution is propagated over the full range |∆η| < 2.5 and subtracted in 2D from the
JHEP11(2016)055
φ ∆ -1 0 1 2 3 4 (GeV) φ ∆ /d T p Σ d jets 1/N 5 10 15 20 pp reference | < 1.0 η ∆ Dijet peaks, | | < 2.5 η ∆ Long range, 1.5 < | < 2 GeV trk T 1 < p φ ∆ -1 0 1 2 3 4 (GeV) φ ∆ /d T dp jets 1/N 5 10 15 20 25 PbPb cent. 50-100% < 2 GeV trk T 1 < p φ ∆ -1 0 1 2 3 4 (GeV) φ ∆ /d T dp jets 1/N 75 80 85 90 PbPb cent. 0-30% CMS < 2 GeV trk T 1 < p φ ∆ -1 0 1 2 3 4 (GeV) φ ∆ /d T p Σ d jets 1/N 10 20 30 40 50 pp reference < 8 GeV trk T 4 < p φ ∆ -1 0 1 2 3 4 (GeV) φ ∆ /d T dp jets 1/N 10 20 30 40 50 PbPb cent. 50-100% < 8 GeV trk T 4 < p φ ∆ -1 0 1 2 3 4 (GeV) φ ∆ /d T dp jets 1/N 10 20 30 40 50 PbPb cent. 0-30% < 8 GeV trk T 4 < p > 0.22 J A (2.76 TeV) -1 pp 5.3 pb PbPb 166 µb-1 (2.76 TeV) | < 1.6 jet η R = 0.3, | T anti-k /6 π > 5 1,2 φ ∆ > 50 GeV, T,2 > 120 GeV, p T,1 pFigure 1. Jet-track correlation distributions for unbalanced dijet events (AJ > 0.22), projected
over |∆η| <1. and overlaid with a long-range distribution projected over 1.5 < |∆η| < 2.5. The region |∆φ| < π/2 is taken from the leading jet correlation, while the region π/2 < ∆φ < 3π/2 is taken from the subleading jet correlation. The top row shows the low ptrk
T bin 1 < p trk
T < 2 GeV,
while the bottom row shows the high ptrk
T bin 4 < ptrkT < 8 GeV . Statistical uncertainties are shown
with vertical bars.
mixed-event-corrected signal correlation. In addition, the leading side of the long-range distribution is subtracted from the subleading side (in the illustration shown, the distribu-tion for |∆φ| < π/2 is subtracted from the distribudistribu-tion for π/2 < ∆φ < 3π/2) to obtain a measurement of subleading-to-leading asymmetry in the long-range correlated background. With this, the three contributions to the dijet hemisphere momentum balance have been identified: leading jet peak, subleading jet peak, and subleading-to-leading two-dimensional underlying event asymmetry.
5.3 Corrections and systematic uncertainties
Simulation-based corrections are applied to correlations to account for two biases in jet reconstruction: a bias toward selecting jets that are found on upward fluctuations in the background (relevant for PbPb only), and a bias toward selecting jets with harder frag-mentation (affecting PbPb and pp similarly). For the former, to estimate and subtract the contribution to the excess yield due to background fluctuation bias in jet reconstruction,
a similar procedure to that outlined in previous CMS studies [10] is followed. Simulations
are performed in pythia+hydjet samples with reconstructed jets, and correlations are constructed excluding particles generated with the embedded pythia hard-scattering pro-cess. A Gaussian fit to the excess is subtracted as a correction from the data results, and half its magnitude is assigned as the associated systematic uncertainty.
JHEP11(2016)055
The second bias is toward the selection of jets with fewer associated tracks in both pp
and PbPb data for all ptrkT selections studied, due to the fact that jets with harder
fragmen-tation are more likely to be successfully reconstructed than jets with softer fragmenfragmen-tation.
Following the method used in refs. [9,12], corrections are derived for this jet fragmentation
function (JFF) bias and for the related possible effect of “jet swapping” between leading, subleading, and additional jets by comparing correlated per-trigger particle yields for all reconstructed jets versus all generated jets. This correction is derived for each jet selec-tion in a pythia-only simulaselec-tion, and also in pythia+hydjet events, excluding hydjet tracks from the correction determination. The variation between the JFF and jet swapping correction derived from pythia embedded into hydjet simulation at different centralities is assigned as a systematic uncertainty in this correction. This uncertainty is less than 2%
for all ptrkT selections, and converges to zero at high ptrkT .
Jet reconstruction-related sources of systematic uncertainty in this analysis include the two reconstruction biases as discussed above, as well as a residual JES uncertainty that accounts for possible differences of calorimeter response in data and simulation. In simulation, for example, there is a difference in the JES between quark and gluon jets
(about 2% at 120 GeV [9]), meaning that medium-induced changes in jet flavor could
result in either over-correction or under-correction of jet energy, and a resulting bias in jet selection. To evaluate this residual JES uncertainty, we vary the leading jet selection threshold by 3% to account for possible differences in data versus simulated calorimeter response. The resulting maximum variations in total correlated particle yield are found to be within 3% in all cases, and we conservatively assign 3% to account for this systematic uncertainty source.
The tracking efficiency correction uncertainty is estimated from the ratio of cor-rected reconstructed yields and generated yields in pythia and pythia+hydjet simu-lated events, by using generator-level charged particles as a reference. This uncertainty is found to be ∼ 2–4% for PbPb and pp collisions, with the greater value corresponding to a higher multiplicity and lower momentum range of selected tracks. To account for possi-ble track reconstruction differences in data and simulation, a residual uncertainty in track
reconstruction efficiency and misidentification rate corrections is estimated to be 5% [9].
The uncertainty arising from pair acceptance effects is estimated by considering the sideband asymmetry after dividing by the mixed-event correlation. Each sideband region of the final background-subtracted ∆η distribution (−2.5 < ∆η < −1.5 and 1.5 < ∆η < 2.5) is separately fit with a constant. The greater of these two deviations from zero is assigned
as systematic uncertainty, and is found to be within 5–9% for the lowest ptrk
T bin. The
uncertainty resulting from the event decomposition is determined by evaluating point-to-point variations in the side-band projections used to estimate long-range correlation contributions. The event decomposition uncertainty is found to be within 2–5% for 0–30%
central PbPb data in the the lowest ptrkT bin where the background is most significant
compared to the signal level, and decreases for less central collisions and for higher ptrkT
tracks (ptrkT > 2 GeV).
The systematic uncertainties from the sources discussed above are added in quadrature
for the final result. Table 1 lists the upper limits on the estimated contributions from the
JHEP11(2016)055
Source 0–30% 30–50% 50–100% pp
Balanced jet selection (AJ< 0.22):
Background fluctuations 1–8% 1–3% 0–1% —
JFF bias and jet swapping 0–2% 0–2% 0–2% 0–2%
Residual JES 3% 3% 3% 3%
Tracking efficiency 4% 4% 4% 3 %
Residual track efficiency corr. 5% 5% 5% 5%
Pair acceptance corrections 5–9% 4–8% 2–6% 2–3%
Event decomposition 2–5% 2–5% 2–5% 1–2%
Total 9–15% 8–13% 8–10% 7–8%
Unbalanced jet selection (AJ> 0.22):
Background fluctuations 1–10% 1–5% 0–2% —
JFF bias and jet swapping 0–2% 0–2% 0–2% 0–2%
Residual JES 3% 3% 3% 3%
Tracking efficiency 4% 4% 4% 3 %
Residual track efficiency corr. 5% 5% 5% 5%
Pair acceptance corrections 5–9% 4–8% 2–6% 2–3%
Event decomposition 2–5% 2–5% 2–5% 1–2%
Total 9–16% 8–13% 8–10% 7–8%
Table 1. This table summarizes the systematic uncertainties in the measurement of the jet-track correlations in PbPb and pp collisions. Upper and lower limits are shown as a function of collision centrality. Upper values correspond to the uncertainties at lowest ptrkT .
6 Results
In this analysis, two-dimensional ∆η–∆φ momentum distributions with respect to high-pT
leading and subleading jets are studied differentially in centrality and ptrk
T . First, the jet
momentum density profile is measured as a function of ∆r =p(∆η)2+ (∆φ)2 for all dijet
events, comparing PbPb to pp jet shapes up to ∆r = 1. Next, the sample is divided into
balanced (AJ< 0.22) and unbalanced (AJ> 0.22) dijet events, and the overall
subleading-to-leading hemisphere momentum balance is evaluated by subtracting the distribution of
ptrkT about the leading jet from the distribution of ptrkT about the subleading jet. This overall
hemisphere momentum balance is then further decomposed into contributions from the leading and subleading jet peaks and from the underlying event-wide long-range asymmetry.
The jet peak shapes are quite similar in ∆η and ∆φ, as reported in ref. [12], but the
long-range “ridge-like” distribution is independent of ∆η within the fiducial acceptance
and uncertainties, while showing a clear ∆φ dependence, as is visible in figure1. To avoid
JHEP11(2016)055
including the overall subleading-to-leading hemisphere momentum balance and respective contributions from the leading and subleading peaks and underlying long-range asymmetry as a function of ∆φ. Finally, we summarize our findings by presenting the total momentum
in each ptrk
T bin, integrated over each hemisphere.
6.1 Measurement of radial jet momentum density profile
After subtraction of the long-range background, ptrkT correlations in ∆η and ∆φ may be
used to obtain measurements of jet shape as a function of ∆r by direct integration. Jet shape ρ(∆r) is defined as:
ρ(∆r) = 1 δr 1 Njets Σjets Σtracks∈(ra,rb)p trk T pjetsT . (6.1)
The jet shape ρ(∆r) is extracted by integrating 2D jet-peak momentum distributions
in annuli with radial width δr = 0.05, where each has an inner radius of ra= r − δr/2 and
outer radius of rb = r + δr/2. A previous CMS study measured the jet shape ρ(∆r) within
the jet cone radius ∆r = 0.3 [11]; for comparison with this previous result, distributions
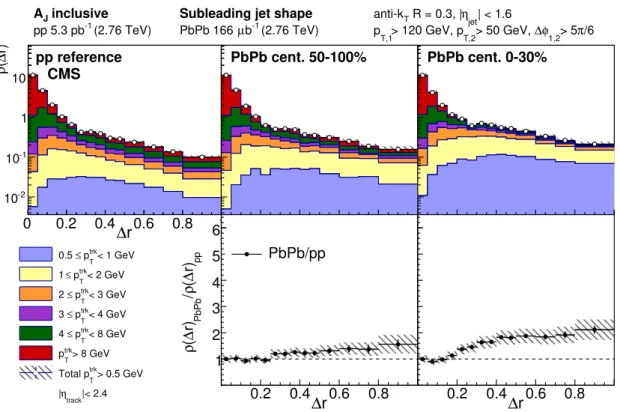
are normalized to integrate to unity within the radius ∆r < 0.3. In figure 2, the leading
jet shape measured with this correlation technique is compared to the published CMS
measurement [11]. The new jet shape measurement is performed differentially in ptrkT , in
bins ranging from 0.5 < ptrkT < 1 GeV to ptrkT > 8 GeV . With the advantages provided by
the correlation technique, the radial jet momentum density profile measurements are also extended in this analysis to ∆r = 1. The ∆r = 1 limit is driven by the pp data, which has no correlated yields within our sample at larger ∆r. The leading jet shape is found to be very similar to that in the previous measurement for an inclusive jet selection of all jets
with pT> 100 GeV, despite small differences in the jet selection.
A new measurement of subleading jet shape is presented in figure 3. Significant jet
shape modifications are evident in central PbPb events for both leading and subleading jets with respect to the pp reference measurement, while in peripheral PbPb events the jet shapes are similar to the pp reference. Broadening of the jet structure is an expected
consequence of jet quenching in theoretical models [31]. Here it is important to note that
the broadening in central PbPb collisions is relative to the jets of the same type (leading or
subleading) in pp collisions. The subleading jets are of lower pT by selection in both PbPb
and pp, and significantly broader than leading jets in pp data. Thus, although subleading jets in central PbPb collisions are softer and broader than leading jets in these collisions, the relative jet shape modification (expressed via a ratio to pp data) is greater for leading jets since these are compared to the narrower pp leading jets.
6.2 Azimuthal distribution of charged-particle transverse momentum
To investigate in detail how the modification of the jet peaks contributes to the overall
redistribution of ptrkT flow reported in [9], we measure the transverse momentum balance in
the event via ∆η–∆φ ptrkT correlations to subleading and leading jets. First, we present the
JHEP11(2016)055
0 0.2 0.4 0.6 0.8 1 r) ∆( ρ -2 10 -1 10 1 10 pp reference CMS < 1 GeV trk T p ≤ 0.5 < 2 GeV trk T p ≤ 1 < 3 GeV trk T p ≤ 2 < 4 GeV trk T p ≤ 3 < 8 GeV trk T p ≤ 4 > 8 GeV trk T p > 0.5 GeV trk T Total p |< 2.4 track η | pp r) ∆( ρ/ PbPb r) ∆( ρ 0 1 2 3 4 5 6 r ∆ 0 0.2 0.4 0.6 0.8 10 0.2 0.4 0.6 0.8 1 PbPb cent. 50-100% r ∆ 0 0.2 0.4 0.6 0.8 1 PbPb/pp PLB 730 (2014) 243 0 0.2 0.4 0.6 0.8 1 PbPb cent. 0-30% r ∆ 0 0.2 0.4 0.6 0.8 1 inclusive JA Leading jet shape
(2.76 TeV) -1 pp 5.3 pb PbPb 166 µb-1 (2.76 TeV) | < 1.6 jet η R = 0.3, | T anti-k /6 π > 5 1,2 φ ∆ > 50 GeV, T,2 > 120 GeV, p T,1 p
Figure 2. Top row: leading jet shape ρ(∆r) for the pp reference, and peripheral and central PbPb data, shown for all tracks with pT > 0.5 GeV and decomposed by ptrkT (with ptrkT ranges
denoted by different color shading). Shapes are normalized to unity over the region ∆r < 0.3 for comparison with the published reference shown (ref. [11]). Bottom row: leading jet shape ratio ρ(∆r)PbPb/ρ(∆r)pp, again with the published reference. Statistical uncertainties are shown with
vertical bars, and systematic uncertainties are shown with shaded boxes.
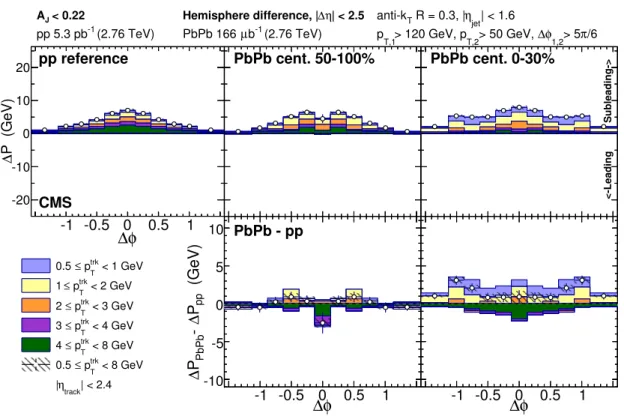
jets in figures4and5, for balanced and unbalanced dijet events, respectively. These figures
show the per-event azimuthal distribution of ptrkT about the leading or subleading jet axis,
denoted P = 1/NevtdΣpT/d∆φ, with the subleading-to-leading hemisphere difference of
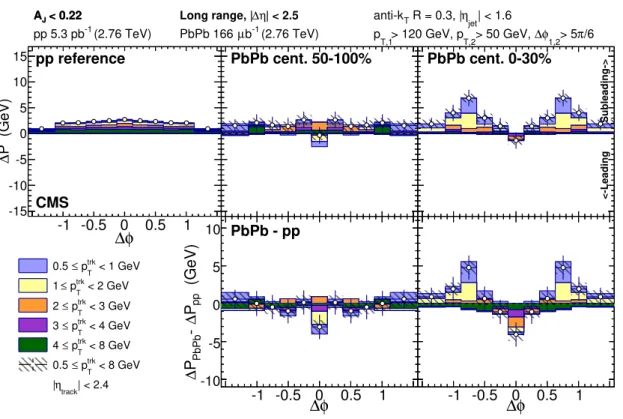
this distribution denoted ∆P. For display, all distributions are symmetrized in ∆φ. For both balanced and unbalanced dijet events, a broad excess of soft particles is evident in the subleading versus leading hemisphere in central PbPb collisions relative to the pp reference data. This reflects the greater quenching of the subleading jet. In the unbalanced selection, as required by the momentum conservation, the signal is enhanced in both pp and PbPb
data: in pp data a large excess of particles with ptrk
T > 3 GeV is present on the subleading
side. This excess compensates for the smaller contribution of the highest pT particles in
the jet itself. In peripheral PbPb data the distribution is quite similar to the pp reference, while in central PbPb data this balancing distribution consists mostly of soft particles with
ptrkT < 3 GeV, consistent with the findings of the previous CMS study [9]. To demonstrate
these medium modifications more clearly, the difference in yield between PbPb and pp
collisions is shown in the bottom panels of figures 4 and 5. For presentation, tracks with
ptrkT > 8 GeV are not included in these figures, so that it is possible to zoom in on the
JHEP11(2016)055
0 0.2 0.4 0.6 0.8 1 r) ∆( ρ -2 10 -1 10 1 10 pp reference CMS < 1 GeV trk T p ≤ 0.5 < 2 GeV trk T p ≤ 1 < 3 GeV trk T p ≤ 2 < 4 GeV trk T p ≤ 3 < 8 GeV trk T p ≤ 4 > 8 GeV trk T p > 0.5 GeV trk T Total p |< 2.4 track η | pp r) ∆( ρ/ PbPb r) ∆( ρ 0 1 2 3 4 5 6 r ∆ 0 0.2 0.4 0.6 0.8 10 0.2 0.4 0.6 0.8 1 PbPb cent. 50-100% r ∆ 0 0.2 0.4 0.6 0.8 1 PbPb/pp 0 0.2 0.4 0.6 0.8 1 PbPb cent. 0-30% r ∆ 0 0.2 0.4 0.6 0.8 1 inclusive JA Subleading jet shape
(2.76 TeV) -1 pp 5.3 pb PbPb 166 µb-1 (2.76 TeV) | < 1.6 jet η R = 0.3, | T anti-k /6 π > 5 1,2 φ ∆ > 50 GeV, T,2 > 120 GeV, p T,1 p
Figure 3. Top row: subleading jet shape ρ(∆r) for pp reference and peripheral and central PbPb data, shown for all tracks with pT> 0.5 GeV and decomposed by ptrkT (with ptrkT ranges denoted by
different color shading), normalized to unity over the region ∆r < 0.3. Bottom row: subleading jet shape ratio ρ(∆r)PbPb/ρ(∆r)pp. Statistical uncertainties are shown with vertical bars, and
systematic uncertainties are shown with shaded boxes.
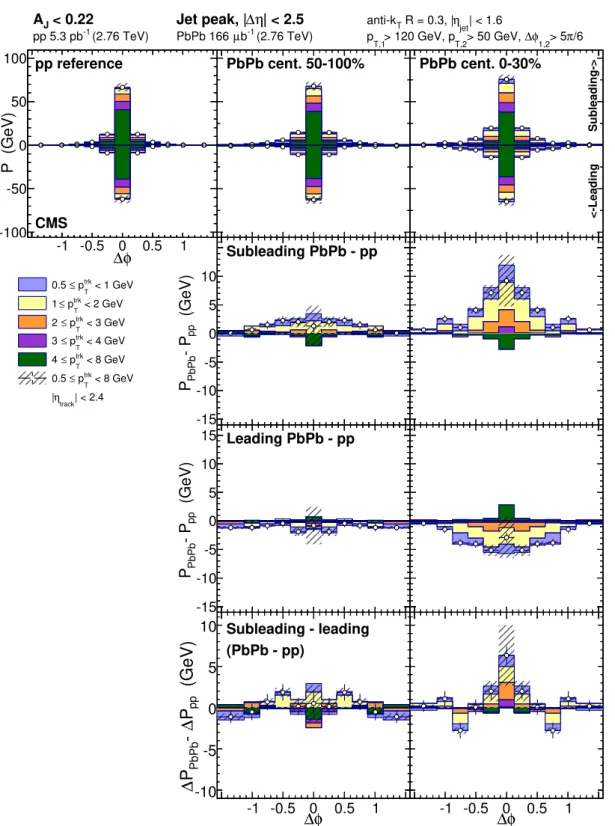
To elucidate the redistribution of ptrkT within the QGP, the distributions are separated
into three components as stated above: the two Gaussian-like peaks about the leading and subleading jet axes, and a third component accounting for overall subleading-to-leading hemisphere asymmetry of the long-range side-band distributions (measured in the region
1.5 < |∆η| < 2.5). In figures6 and7, the jet peak components are shown for balanced and
unbalanced jets, respectively, presenting subleading results as positive and leading results
as negative (in line with the hemisphere difference measurements in figures 4 and 5). Jet
peak distributions after decomposition are projected over the full range |∆η| < 2.5, again for consistency with the hemisphere difference measurements. The top row of each panel
first shows the overall distribution of momentum carried by particles with ptrk
T < 8 GeV
associated with the jet peak. The middle two panels then assess modifications to the
subleading and leading jets for each ptrkT bin. Here, again, there is evidence of quenching of
both the subleading and leading jets in central PbPb collisions relative to the pp reference
data. There is an excess of low-pT particles correlated with the leading and subleading
jet axes in both the balanced and unbalanced dijet selections, in agreement with results
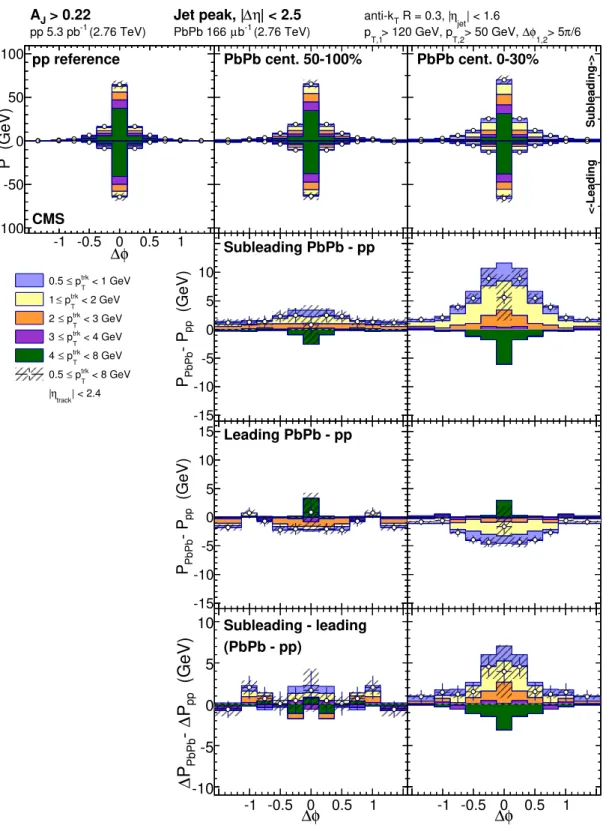
presented in the CMS study [12]. In unbalanced dijet events, this enhancement of soft
particles turns into a depletion at higher ptrkT , and is greater on the subleading than the
JHEP11(2016)055
-1.5 -1 -0.5 0 0.5 1 1.5 P (GeV) ∆ -20 -10 0 10 20 pp reference CMS < 1 GeV trk T p ≤ 0.5 < 2 GeV trk T p ≤ 1 < 3 GeV trk T p ≤ 2 < 4 GeV trk T p ≤ 3 < 8 GeV trk T p ≤ 4 < 8 GeV trk T p ≤ 0.5 | < 2.4 track η | φ ∆ -1.5 -1 -0.5 0 0.5 1 1.5 (GeV) pp P ∆ - PbPb P ∆-10 -5 0 5 10 -1.5 -1 -0.5 0 0.5 1 1.5 PbPb cent. 50-100% φ ∆ -1.5 -1 -0.5 0 0.5 1 1.5 PbPb - pp -1.5 -1 -0.5 0 0.5 1 1.5 PbPb cent. 0-30% <-Leading Subleading-> φ ∆ -1.5 -1 -0.5 0 0.5 1 1.5 < 0.22 J A Hemisphere difference, |∆η| < 2.5 (2.76 TeV) -1 pp 5.3 pb PbPb 166 µb-1 (2.76 TeV) | < 1.6 jet η R = 0.3, | T anti-k /6 π > 5 1,2 φ ∆ > 50 GeV, T,2 > 120 GeV, p T,1 pFigure 4. Top row: difference of the total ptrk
T distributions between subleading and leading jet
hemispheres, projected on ∆φ, for balanced dijet events with AJ < 0.22 shown differentially by
ptrk
T for pp reference, peripheral PbPb, and central PbPb data. Bottom row: PbPb-pp difference
in these ∆φ momentum distributions. Statistical uncertainties are shown with vertical bars, and systematic uncertainties are shown with shaded boxes.
while both subleading and leading jet peaks are broader in central PbPb than pp data, the PbPb-pp excess is wider on the leading than on the subleading side. To assess the jet peak contributions to the overall hemisphere momentum balance, the double-differential (PbPb-pp, subleading-leading) result is presented in the bottom panel. Here it is evident
that the low-ptrkT excess in central PbPb collisions is greater on the subleading than the
leading side of the dijet system, but the larger subleading-to-leading excess only accounts for a portion of the total momentum redistribution in unbalanced dijet events. It is also
clear that the high-ptrkT large-angle depletion observed in the overall hemisphere momentum
balance distribution is not produced by the Gaussian-like jet peaks.
To uncover the missing part of the total transverse momentum balance, these jet-related studies are complemented by an analysis of the long-range subleading-to-leading
hemisphere asymmetry, presented in figures 8 and 9for balanced and unbalanced jets,
re-spectively. The long-range correlated background in balanced dijet events is approximately symmetric in pp and peripheral PbPb data, while in central PbPb data there is a small
excess of low-pT particles. In unbalanced dijet events, however, there is already significant
asymmetry in the pp reference data, with a large correlated excess of particles in all ptrkT
classes less than 8 GeV on the subleading relative to the leading side of the underlying event. This asymmetry reflects the presence of other hard-scattering products in the subleading
JHEP11(2016)055
-1.5 -1 -0.5 0 0.5 1 1.5 P (GeV) ∆ -20 -10 0 10 20 pp reference CMS < 1 GeV trk T p ≤ 0.5 < 2 GeV trk T p ≤ 1 < 3 GeV trk T p ≤ 2 < 4 GeV trk T p ≤ 3 < 8 GeV trk T p ≤ 4 < 8 GeV trk T p ≤ 0.5 | < 2.4 track η | φ ∆ -1.5 -1 -0.5 0 0.5 1 1.5 (GeV) pp P ∆ - PbPb P ∆-10 -5 0 5 10 -1.5 -1 -0.5 0 0.5 1 1.5 PbPb cent. 50-100% φ ∆ -1.5 -1 -0.5 0 0.5 1 1.5 PbPb - pp -1.5 -1 -0.5 0 0.5 1 1.5 PbPb cent. 0-30% <-Leading Subleading-> φ ∆ -1.5 -1 -0.5 0 0.5 1 1.5 > 0.22 J A Hemisphere difference, |∆η| < 2.5 (2.76 TeV) -1 pp 5.3 pb PbPb 166 µb-1 (2.76 TeV) | < 1.6 jet η R = 0.3, | T anti-k /6 π > 5 1,2 φ ∆ > 50 GeV, T,2 > 120 GeV, p T,1 pFigure 5. Top row: difference of the total ptrk
T distributions between subleading and leading jet
hemispheres, projected on ∆φ, for unbalanced dijet events with AJ> 0.22, shown differentially by
ptrk
T for the pp reference data, peripheral PbPb, and central PbPb data. Bottom row: PbPb-pp
difference in these ∆φ momentum distributions. Statistical uncertainties are shown with vertical bars, and systematic uncertainties are shown with shaded boxes.
hemisphere of dijet events (e.g. additional jets), as required by the momentum conserva-tion for asymmetric dijet events in pp collisions. In the presence of the strongly interacting medium, however, this underlying event asymmetry in asymmetric dijet events changes notably. In peripheral PbPb collisions, an onset of some depletion of momentum carried
by high-pT particles can be seen, and in central PbPb data, subleading-to-leading
under-lying event excesses with ptrkT > 2 GeV nearly vanish. The significance of the contribution
of this long-range asymmetry to the total hemisphere imbalance is further assessed by the double difference (PbPb-pp, subleading-leading), which is shown on the bottom panel. The
absence of a high-ptrkT component in the long-range part of the correlation suggests that
events containing additional jets constitute a smaller fraction of unbalanced dijet events in PbPb than pp data. A likely explanation for this effect is that while momentum conserva-tion requires the presence of addiconserva-tional jets in unbalanced pp dijet events, in PbPb data the sample of unbalanced dijet events also includes events in which the dijet asymmetry is due to the greater quenching of the subleading jet.
6.3 Integrated hemisphere momentum balance
To summarize all contributions to the overall ptrkT flow in the dijet events, we first present
JHEP11(2016)055
-1.5 -1 -0.5 0 0.5 1 1.5 P (GeV) -100 -50 0 50 100 pp reference CMS < 1 GeV trk T p ≤ 0.5 < 2 GeV trk T p ≤ 1 < 3 GeV trk T p ≤ 2 < 4 GeV trk T p ≤ 3 < 8 GeV trk T p ≤ 4 < 8 GeV trk T p ≤ 0.5 | < 2.4 track η | (GeV) pp - P PbPb P -15 -10 -5 0 5 10 15 φ ∆ -1.5 -1 -0.5 0 0.5 1 1.5 (GeV) pp - P PbPb P -15 -10 -5 0 5 10 15 (GeV) pp P ∆ - PbPb P ∆-10 -5 0 5 10 -1.5 -1 -0.5 0 0.5 1 1.5 PbPb cent. 50-100% -1.5 -1 -0.5 0 0.5 1 1.5 Subleading PbPb - pp -1.5 -1 -0.5 0 0.5 1 1.5 Leading PbPb - pp φ ∆ -1.5 -1 -0.5 0 0.5 1 1.5 Subleading - leading (PbPb - pp) -1.5 -1 -0.5 0 0.5 1 1.5 PbPb cent. 0-30% <-Leading Subleading-> -1.5 -1 -0.5 0 0.5 1 1.5 -1.5 -1 -0.5 0 0.5 1 1.5 φ ∆ -1.5 -1 -0.5 0 0.5 1 1.5 < 0.22 J A Jet peak, |∆η| < 2.5 (2.76 TeV) -1 pp 5.3 pb PbPb 166 µb-1 (2.76 TeV) | < 1.6 jet η R = 0.3, | T anti-k /6 π > 5 1,2 φ ∆ > 50 GeV, T,2 > 120 GeV, p T,1 pFigure 6. Top row: jet-peak (long-range subtracted) distribution in ∆φ of ptrkT about the sublead-ing (plotted positive) and leadsublead-ing (plotted negative) jets for balanced dijet events with AJ< 0.22.
Middle rows: PbPb-pp momentum distribution differences for subleading and leading jets. Bottom row: PbPb-pp, subleading-leading double difference in these ∆φ momentum distributions. Sta-tistical uncertainties are shown with vertical bars, and systematic uncertainties are shown with shaded boxes.
JHEP11(2016)055
-1.5 -1 -0.5 0 0.5 1 1.5 P (GeV) -100 -50 0 50 100 pp reference CMS < 1 GeV trk T p ≤ 0.5 < 2 GeV trk T p ≤ 1 < 3 GeV trk T p ≤ 2 < 4 GeV trk T p ≤ 3 < 8 GeV trk T p ≤ 4 < 8 GeV trk T p ≤ 0.5 | < 2.4 track η | (GeV) pp - P PbPb P -15 -10 -5 0 5 10 15 φ ∆ -1.5 -1 -0.5 0 0.5 1 1.5 (GeV) pp - P PbPb P -15 -10 -5 0 5 10 15 (GeV) pp P ∆ - PbPb P ∆-10 -5 0 5 10 -1.5 -1 -0.5 0 0.5 1 1.5 PbPb cent. 50-100% -1.5 -1 -0.5 0 0.5 1 1.5 Subleading PbPb - pp -1.5 -1 -0.5 0 0.5 1 1.5 Leading PbPb - pp φ ∆ -1.5 -1 -0.5 0 0.5 1 1.5 Subleading - leading (PbPb - pp) -1.5 -1 -0.5 0 0.5 1 1.5 PbPb cent. 0-30% <-Leading Subleading-> -1.5 -1 -0.5 0 0.5 1 1.5 -1.5 -1 -0.5 0 0.5 1 1.5 φ ∆ -1.5 -1 -0.5 0 0.5 1 1.5 > 0.22 J A Jet peak, |∆η| < 2.5 (2.76 TeV) -1 pp 5.3 pb PbPb 166 µb-1 (2.76 TeV) | < 1.6 jet η R = 0.3, | T anti-k /6 π > 5 1,2 φ ∆ > 50 GeV, T,2 > 120 GeV, p T,1 pFigure 7. Top row: jet-peak (long-range subtracted) distribution in ∆φ of ptrkT about the sublead-ing (plotted positive) and leadsublead-ing (plotted negative) jets for unbalanced dijet events with AJ> 0.22.
Middle rows: PbPb-pp momentum distribution differences for subleading and leading jets. Bottom row: PbPb-pp, subleading-leading double difference in these ∆φ momentum distributions. Sta-tistical uncertainties are shown with vertical bars, and systematic uncertainties are shown with shaded boxes.
JHEP11(2016)055
-1.5 -1 -0.5 0 0.5 1 1.5 P (GeV) ∆ -15 -10 -5 0 5 10 15 pp reference CMS < 1 GeV trk T p ≤ 0.5 < 2 GeV trk T p ≤ 1 < 3 GeV trk T p ≤ 2 < 4 GeV trk T p ≤ 3 < 8 GeV trk T p ≤ 4 < 8 GeV trk T p ≤ 0.5 | < 2.4 track η | φ ∆ -1.5 -1 -0.5 0 0.5 1 1.5 (GeV) pp P ∆ - PbPb P ∆-10 -5 0 5 10 -1.5 -1 -0.5 0 0.5 1 1.5 PbPb cent. 50-100% φ ∆ -1.5 -1 -0.5 0 0.5 1 1.5 PbPb - pp -1.5 -1 -0.5 0 0.5 1 1.5 PbPb cent. 0-30% <-Leading Subleading-> φ ∆ -1.5 -1 -0.5 0 0.5 1 1.5 < 0.22 J A < 0.22J A Long range, |∆η| < 2.5 (2.76 TeV) -1 pp 5.3 pb PbPb 166 µb-1 (2.76 TeV) | < 1.6 jet η R = 0.3, | T anti-k /6 π > 5 1,2 φ ∆ > 50 GeV, T,2 > 120 GeV, p T,1 pFigure 8. Top row: long-range distribution in ∆φ of excess ptrk
T in the subleading relative to
leading sides for balanced dijet events with AJ< 0.22. Bottom row: PbPb-pp difference in these
∆φ long-range momentum distributions. Statistical uncertainties are shown with vertical bars, and systematic uncertainties are shown with shaded boxes.
in the ∆φ distribution of ptrkT in the event) for this long-range asymmetry, measured in
|∆φ| < π/2 and |∆η| < 2.5, in figure10. For balanced dijet events, the PbPb and pp
inte-grals follow similar ptrkT dependences. For unbalanced dijet events, the overall asymmetry
rises with ptrkT in the pp reference data, but falls with ptrkT in central PbPb data,
indicat-ing the presence of different sources for the long-range momentum correlations. Finally, a summary of hemisphere-integrated excess (PbPb-pp) yields from all assessed sources for
balanced and unbalanced dijet events is shown in figures 11 and 12. The top panels of
figure 11 present total central PbPb-pp differences in ptrkT associated with the subleading
(plotted positive) and leading (plotted negative) jets. The leading and subleading jet peak modifications offset each other, so the total jet-peak-related modification, constructed from these two distributions, is also presented. The total jet peak modifications in central PbPb collisions are not significantly different in unbalanced versus balanced dijet events. The
bottom panels of figure11present these jet-peak modifications together with the long-range
modifications evident in figure 10 to show the decomposed hemisphere-wide differences in
associated pT in each track pT range. Unlike the jet peak contributions, the long-range
PbPb versus pp modifications are greater than their uncertainties between balanced and
unbalanced dijet events. Here the depletion of high-pT tracks in unbalanced PbPb
JHEP11(2016)055
-1.5 -1 -0.5 0 0.5 1 1.5 P (GeV) ∆ -15 -10 -5 0 5 10 15 pp reference CMS < 1 GeV trk T p ≤ 0.5 < 2 GeV trk T p ≤ 1 < 3 GeV trk T p ≤ 2 < 4 GeV trk T p ≤ 3 < 8 GeV trk T p ≤ 4 < 8 GeV trk T p ≤ 0.5 | < 2.4 track η | φ ∆ -1.5 -1 -0.5 0 0.5 1 1.5 (GeV) pp P ∆ - PbPb P ∆-10 -5 0 5 10 -1.5 -1 -0.5 0 0.5 1 1.5 PbPb cent. 50-100% φ ∆ -1.5 -1 -0.5 0 0.5 1 1.5 PbPb - pp -1.5 -1 -0.5 0 0.5 1 1.5 PbPb cent. 0-30% <-Leading Subleading-> φ ∆ -1.5 -1 -0.5 0 0.5 1 1.5 > 0.22 J A > 0.22J A Long range, |∆η| < 2.5 (2.76 TeV) -1 pp 5.3 pb PbPb 166 µb-1 (2.76 TeV) | < 1.6 jet η R = 0.3, | T anti-k /6 π > 5 1,2 φ ∆ > 50 GeV, T,2 > 120 GeV, p T,1 pFigure 9. Top row: long-range distribution in ∆φ of excess ptrk
T in the subleading relative to
leading sides for unbalanced dijet events with AJ> 0.22. Bottom row: PbPb-pp difference in these
∆φ long-range momentum distributions. Statistical uncertainties are shown with vertical bars, and systematic uncertainties are shown with shaded boxes.
are prominently evident in the long-range distribution for pp unbalanced dijet events) in
central PbPb unbalanced dijet events. Figure 12 presents the same hemisphere-integrated
PbPb-pp excess for peripheral collisions for comparison to the central results shown in
figure11. Some possible small modifications are already evident in this 50–100% centrality
range, but these differences between peripheral PbPb and pp results are in most cases smaller than systematic uncertainties.
7 Summary
In this analysis, the redistribution of momentum in dijet events is studied via
two-dimensional ∆η–∆φ jet-track correlations in PbPb and pp collisions at √sNN= 2.76 TeV,
using data sets with integrated luminosities of 166 µb−1 and 5.3 pb−1, respectively. Events
are selected to include a leading jet with pT,1 > 120 GeV and subleading jet with
pT,2 > 50 GeV, with an azimuthal separation of at least ∆φ1,2 > 5π/6. Subtracting
the long-range part of the correlation from the jet peaks, this work extends the studies of jet shape modifications in PbPb events relative to pp collisions to large radial distances (∆r ≈ 1) from the jet axis. These modifications are found to extend out to the largest radial distance studied in central PbPb events for both leading and subleading jets. The jet mod-ifications are further studied differentially for balanced and unbalanced dijet events, and as
JHEP11(2016)055
(GeV) trk T p 1 2 3 4 5 6 7 8 P (GeV) ∆ Σ -2 0 2 4 6 8 10 12 14 < 0.22 J A PbPb 50-100% PbPb 0-30% pp reference (GeV) trk T p 1 2 3 4 5 6 7 8 > 0.22 J A CMS |<2.5 η ∆Long range asymmetry |
(2.76 TeV) -1 pp 5.3 pb (2.76 TeV) -1 b µ PbPb 166 | < 1.6 jet η R = 0.3, | T anti-k /6 π > 5 1,2 φ ∆ > 50 GeV, T,2 > 120 GeV, p T,1 p
Figure 10. Integrated pTin the long-range ∆φ-correlated distribution as a function of track-ptrkT
integrated over |∆φ| < π/2 and |∆η| < 2.5 for pp reference, peripheral PbPb and central PbPb data for balanced compared to unbalanced dijet events. Statistical uncertainties are shown with vertical bars, and systematic uncertainties are shown with shaded boxes.
a function of ptrkT and collision centrality for each of these selections in PbPb and pp
refer-ence data. Transverse momentum redistribution around the subleading and leading jets, as well as differences in long-range correlated background asymmetry, are separately analyzed.
An excess of transverse momentum carried by soft particles (ptrk
T < 2 GeV) is found
for both leading and subleading jets in central PbPb collisions relative to the pp reference,
consistent with previous studies of charged-particle yields correlated to high-pT jets. For
unbalanced dijet events, this low-ptrkT excess is greater on the subleading-jet side than on
the leading-jet side. However, the difference in ptrkT contained in the Gaussian-like jet peaks
is found only partially to account for the total ptrkT redistribution in the most central PbPb
collisions with dijet events. In the long-range correlated distribution of ptrkT under the jet
peaks, it is found that the excess of relatively high-pT particles (2 < ptrkT < 8 GeV) on the
subleading side relative to the leading side, which is observed in asymmetric pp collisions and mainly attributed to three-jet events, is absent in most central PbPb collisions. This indicates that the fraction of events with additional jets in the asymmetric dijet sample is significantly lower than in an identical selection of dijet events in pp data. A long-range
asymmetry in the low-pT particles in dijet events is also observed, providing further input
for the theoretical understanding of jet-medium coupling.
Acknowledgments
We congratulate our colleagues in the CERN accelerator departments for the excellent performance of the LHC and thank the technical and administrative staffs at CERN and at other CMS institutes for their contributions to the success of the CMS effort. In ad-dition, we gratefully acknowledge the computing centres and personnel of the Worldwide
JHEP11(2016)055
(GeV) pp P Σ - PbPb P Σ -10 -5 0 5 10 15 Subleading jet Leading jetSubleading and leading jets
< 0.22 J A (GeV) trk T p 1 2 3 4 5 6 7 8 (GeV) pp P ∆ Σ - PbPb P ∆ Σ -10 -5 0 5 10
15 Subleading and leading jets
Long range Total > 0.22 J A CMS 0-30% central PbPb - pp (GeV) trk T p 1 2 3 4 5 6 7 8 (2.76 TeV) -1 pp 5.3 pb (2.76 TeV) -1 b µ PbPb 166 | < 1.6 jet η R = 0.3, | T anti-k /6 π > 5 1,2 φ ∆ > 50 GeV, T,2 > 120 GeV, p T,1 p
Figure 11. Modifications of jet-track correlated ptrk
T in central PbPb collisions with respect to the
pp reference data, integrated over |∆φ| < π/2 and |∆η| < 2.5. Top row: subleading and leading jet peaks PbPb-pp. Bottom row: relative contributions from jet peaks and long-range asymmetry to the double difference (PbPb-pp, subleading-leading) in total hemisphere ptrkT . Statistical uncertainties are shown with vertical bars, and systematic uncertainties are shown with shaded boxes.
LHC Computing Grid for delivering so effectively the computing infrastructure essential to our analyses. Finally, we acknowledge the enduring support for the construction and operation of the LHC and the CMS detector provided by the following funding agencies: BMWFW and FWF (Austria); FNRS and FWO (Belgium); CNPq, CAPES, FAPERJ, and FAPESP (Brazil); MES (Bulgaria); CERN; CAS, MoST, and NSFC (China); COL-CIENCIAS (Colombia); MSES and CSF (Croatia); RPF (Cyprus); SENESCYT (Ecuador); MoER, ERC IUT and ERDF (Estonia); Academy of Finland, MEC, and HIP (Finland); CEA and CNRS/IN2P3 (France); BMBF, DFG, and HGF (Germany); GSRT (Greece); OTKA and NIH (Hungary); DAE and DST (India); IPM (Iran); SFI (Ireland); INFN (Italy); MSIP and NRF (Republic of Korea); LAS (Lithuania); MOE and UM (Malaysia); BUAP, CINVESTAV, CONACYT, LNS, SEP, and UASLP-FAI (Mexico); MBIE (New Zealand); PAEC (Pakistan); MSHE and NSC (Poland); FCT (Portugal); JINR (Dubna); MON, RosAtom, RAS and RFBR (Russia); MESTD (Serbia); SEIDI and CPAN (Spain); Swiss Funding Agencies (Switzerland); MST (Taipei); ThEPCenter, IPST, STAR and
JHEP11(2016)055
(GeV) pp P Σ - PbPb P Σ -10 -5 0 5 10 15 Subleading jet Leading jetSubleading and leading jets
< 0.22 J A (GeV) trk T p 1 2 3 4 5 6 7 8 (GeV) pp P ∆ Σ - PbPb P ∆ Σ -10 -5 0 5 10
15 Subleading and leading jets
Long range Total > 0.22 J A CMS 50-100% peripheral PbPb - pp (GeV) trk T p 1 2 3 4 5 6 7 8 (2.76 TeV) -1 pp 5.3 pb (2.76 TeV) -1 b µ PbPb 166 | < 1.6 jet η R = 0.3, | T anti-k /6 π > 5 1,2 φ ∆ > 50 GeV, T,2 > 120 GeV, p T,1 p (2.76 TeV) -1 pp 5.3 pb (2.76 TeV) -1 b µ PbPb 166 | < 1.6 jet η R = 0.3, | T anti-k /6 π > 5 1,2 φ ∆ > 50 GeV, T,2 > 120 GeV, p T,1 p
Figure 12. Modifications of jet-track correlated ptrk
T in peripheral PbPb collisions with respect
to the pp reference data, integrated over |∆φ| < π/2 and |∆η| < 2.5. Top row: subleading and leading jet peaks PbPb-pp. Bottom row: relative contributions from jet peaks and two-dimensional asymmetry to the double difference PbPb-pp, subleading-leading in total hemisphere ptrk
T . Statistical uncertainties are shown with vertical bars, and systematic uncertainties are shown
with shaded boxes.
NSTDA (Thailand); TUBITAK and TAEK (Turkey); NASU and SFFR (Ukraine); STFC (United Kingdom); DOE and NSF (U.S.A.).
IIndividuals have received support from the Marie-Curie programme and the Euro-pean Research Council and EPLANET (EuroEuro-pean Union); the Leventis Foundation; the A. P. Sloan Foundation; the Alexander von Humboldt Foundation; the Belgian Federal
Science Policy Office; the Fonds pour la Formation `a la Recherche dans l’Industrie et
dans l’Agriculture (FRIA-Belgium); the Agentschap voor Innovatie door Wetenschap en Technologie (IWT-Belgium); the Ministry of Education, Youth and Sports (MEYS) of the Czech Republic; the Council of Science and Industrial Research, India; the HOM-ING PLUS programme of the Foundation for Polish Science, cofinanced from European Union, Regional Development Fund, the Mobility Plus programme of the Ministry of Science and Higher Education, the National Science Center (Poland), contracts Har-monia 2014/14/M/ST2/00428, Opus 2013/11/B/ST2/04202, 2014/13/B/ST2/02543 and
JHEP11(2016)055
2014/15/B/ST2/03998, Sonata-bis 2012/07/E/ST2/01406; the Thalis and Aristeia pro-grammes cofinanced by EU-ESF and the Greek NSRF; the National Priorities Research Program by Qatar National Research Fund; the Programa Clar´ın-COFUND del Principado de Asturias; the Rachadapisek Sompot Fund for Postdoctoral Fellowship, Chulalongkorn University and the Chulalongkorn Academic into Its 2nd Century Project Advancement Project (Thailand); and the Welch Foundation, contract C-1845.
Open Access. This article is distributed under the terms of the Creative Commons
Attribution License (CC-BY 4.0), which permits any use, distribution and reproduction in
any medium, provided the original author(s) and source are credited.
References
[1] J.D. Bjorken, Energy loss of energetic partons in QGP: possible extinction of high pT jets in
hadron-hadron collisions, FERMILAB-PUB-82-059-THY (1982),
http://lss.fnal.gov/archive/preprint/fermilab-pub-82-059-t.shtml.
[2] STAR collaboration, J. Adams et al., Direct observation of dijets in central Au+Au collisions at√sNN= 200 GeV,Phys. Rev. Lett. 97 (2006) 162301[nucl-ex/0604018] [INSPIRE]. [3] PHENIX collaboration, A. Adare et al., Transverse momentum and centrality dependence of
dihadron correlations in Au+Au collisions at√sNN= 200 GeV: Jet-quenching and the
response of partonic matter,Phys. Rev. C 77 (2008) 011901[arXiv:0705.3238] [INSPIRE]. [4] ATLAS collaboration, Observation of a Centrality-Dependent Dijet Asymmetry in Lead-Lead
Collisions at√sNN= 2.77 TeV with the ATLAS Detector at the LHC,Phys. Rev. Lett. 105 (2010) 252303[arXiv:1011.6182] [INSPIRE].
[5] CMS collaboration, Observation and studies of jet quenching in PbPb collisions at√ sNN= 2.76 TeV,Phys. Rev. C 84 (2011) 024906[arXiv:1102.1957] [INSPIRE]. [6] CMS collaboration, Jet momentum dependence of jet quenching in PbPb collisions at√
sNN= 2.76 TeV,Phys. Lett. B 712 (2012) 176[arXiv:1202.5022] [INSPIRE]. [7] ALICE collaboration, Measurement of jet suppression in central Pb-Pb collisions at√
sNN= 2.76 TeV,Phys. Lett. B 746 (2015) 1[arXiv:1502.01689] [INSPIRE]. [8] CMS collaboration, Studies of dijet transverse momentum balance and pseudorapidity
distributions in pPb collisions at√sNN= 5.02 TeV,Eur. Phys. J. C 74 (2014) 2951
[arXiv:1401.4433] [INSPIRE].
[9] CMS collaboration, Measurement of transverse momentum relative to dijet systems in PbPb and pp collisions at√sNN= 2.76 TeV,JHEP 01 (2016) 006[arXiv:1509.09029] [INSPIRE]. [10] CMS collaboration, Measurement of jet fragmentation in PbPb and pp collisions at√
sN N = 2.76 TeV,Phys. Rev. C 90 (2014) 024908[arXiv:1406.0932] [INSPIRE].
[11] CMS collaboration, Modification of jet shapes in PbPb collisions at √sNN= 2.76 TeV,Phys. Lett. B 730 (2014) 243[arXiv:1310.0878] [INSPIRE].
[12] CMS collaboration, Correlations between jets and charged particles in PbPb and pp collisions at√sNN= 2.76 TeV,JHEP 02 (2016) 156[arXiv:1601.00079] [INSPIRE].
[13] CMS collaboration, Determination of Jet Energy Calibration and Transverse Momentum Resolution in CMS,2011 JINST 6 P11002[arXiv:1107.4277] [INSPIRE].
JHEP11(2016)055
[14] CMS collaboration, Description and performance of track and primary-vertex reconstructionwith the CMS tracker,2014 JINST 9 P10009[arXiv:1405.6569] [INSPIRE].
[15] CMS collaboration, The CMS experiment at the CERN LHC,2008 JINST 3 S08004
[INSPIRE].
[16] M. Cacciari, G.P. Salam and G. Soyez, FastJet User Manual,Eur. Phys. J. C 72 (2012) 1896[arXiv:1111.6097] [INSPIRE].
[17] M. Cacciari, G.P. Salam and G. Soyez, The anti-kt jet clustering algorithm,JHEP 04 (2008) 063[arXiv:0802.1189] [INSPIRE].
[18] CMS Collaboration, Underlying-Event Subtraction for Particle Flow,CMS-DP-2013-018
(2013).
[19] T. Sj¨ostrand, S. Mrenna and P.Z. Skands, PYTHIA 6.4 Physics and Manual, JHEP 05 (2006) 026[hep-ph/0603175] [INSPIRE].
[20] R. Field, Early LHC Underlying Event Data — Findings and Surprises,arXiv:1010.3558
[INSPIRE].
[21] GEANT4 collaboration, S. Agostinelli et al., GEANT4: a simulation toolkit,Nucl. Instrum. Meth. A 506 (2003) 250[INSPIRE].
[22] I.P. Lokhtin and A.M. Snigirev, A model of jet quenching in ultrarelativistic heavy ion collisions and high-pT hadron spectra at RHIC,Eur. Phys. J. C 45 (2006) 211
[hep-ph/0506189] [INSPIRE].
[23] CMS collaboration, Study of high-pT charged particle suppression in PbPb compared to pp
collisions at √sN N = 2.76 TeV,Eur. Phys. J. C 72 (2012) 1945[arXiv:1202.2554]
[INSPIRE].
[24] CMS collaboration, The CMS high level trigger, Eur. Phys. J. C 46 (2006) 605
[hep-ex/0512077] [INSPIRE].
[25] CMS collaboration, Studies of jet quenching using isolated-photon+jet correlations in PbPb and pp collisions at√sNN= 2.76 TeV,Phys. Lett. B 718 (2013) 773[arXiv:1205.0206]
[INSPIRE].
[26] CMS collaboration, Multiplicity and transverse momentum dependence of two- and four-particle correlations in pPb and PbPb collisions,Phys. Lett. B 724 (2013) 213
[arXiv:1305.0609] [INSPIRE].
[27] CMS collaboration, Observation of Long-Range Near-Side Angular Correlations in Proton-Proton Collisions at the LHC,JHEP 09 (2010) 091[arXiv:1009.4122] [INSPIRE]. [28] CMS collaboration, Long-range and short-range dihadron angular correlations in central
PbPb collisions at√sNN= 2.76 TeV,JHEP 07 (2011) 076[arXiv:1105.2438] [INSPIRE]. [29] CMS collaboration, Observation of long-range near-side angular correlations in proton-lead
collisions at the LHC,Phys. Lett. B 718 (2013) 795[arXiv:1210.5482] [INSPIRE]. [30] CMS collaboration, Measurement of higher-order harmonic azimuthal anisotropy in PbPb
collisions at√sNN= 2.76 TeV,Phys. Rev. C 89 (2014) 044906[arXiv:1310.8651] [INSPIRE]. [31] G.-Y. Qin and X.-N. Wang, Jet quenching in high-energy heavy-ion collisions,Int. J. Mod.
JHEP11(2016)055
The CMS collaboration
Yerevan Physics Institute, Yerevan, Armenia V. Khachatryan, A.M. Sirunyan, A. Tumasyan
Institut f¨ur Hochenergiephysik der OeAW, Wien, Austria
W. Adam, E. Asilar, T. Bergauer, J. Brandstetter, E. Brondolin, M. Dragicevic, J. Er¨o,
M. Flechl, M. Friedl, R. Fr¨uhwirth1, V.M. Ghete, C. Hartl, N. H¨ormann, J. Hrubec,
M. Jeitler1, A. K¨onig, I. Kr¨atschmer, D. Liko, T. Matsushita, I. Mikulec, D. Rabady,
N. Rad, B. Rahbaran, H. Rohringer, J. Schieck1, J. Strauss, W. Treberer-Treberspurg,
W. Waltenberger, C.-E. Wulz1
National Centre for Particle and High Energy Physics, Minsk, Belarus V. Mossolov, N. Shumeiko, J. Suarez Gonzalez
Universiteit Antwerpen, Antwerpen, Belgium
S. Alderweireldt, E.A. De Wolf, X. Janssen, J. Lauwers, M. Van De Klundert, H. Van Haevermaet, P. Van Mechelen, N. Van Remortel, A. Van Spilbeeck
Vrije Universiteit Brussel, Brussel, Belgium
S. Abu Zeid, F. Blekman, J. D’Hondt, N. Daci, I. De Bruyn, K. Deroover, N. Heracleous, S. Lowette, S. Moortgat, L. Moreels, A. Olbrechts, Q. Python, S. Tavernier, W. Van Doninck, P. Van Mulders, I. Van Parijs
Universit´e Libre de Bruxelles, Bruxelles, Belgium
H. Brun, C. Caillol, B. Clerbaux, G. De Lentdecker, H. Delannoy, G. Fasanella, L. Favart,
R. Goldouzian, A. Grebenyuk, G. Karapostoli, T. Lenzi, A. L´eonard, J. Luetic, T.
Maer-schalk, A. Marinov, A. Randle-conde, T. Seva, C. Vander Velde, P. Vanlaer, R. Yonamine,
F. Zenoni, F. Zhang2
Ghent University, Ghent, Belgium
A. Cimmino, T. Cornelis, D. Dobur, A. Fagot, G. Garcia, M. Gul, D. Poyraz, S. Salva,
R. Sch¨ofbeck, M. Tytgat, W. Van Driessche, E. Yazgan, N. Zaganidis
Universit´e Catholique de Louvain, Louvain-la-Neuve, Belgium
H. Bakhshiansohi, C. Beluffi3, O. Bondu, S. Brochet, G. Bruno, A. Caudron, S. De Visscher,
C. Delaere, M. Delcourt, L. Forthomme, B. Francois, A. Giammanco, A. Jafari, P. Jez, M. Komm, V. Lemaitre, A. Magitteri, A. Mertens, M. Musich, C. Nuttens, K. Piotrzkowski, L. Quertenmont, M. Selvaggi, M. Vidal Marono, S. Wertz
Universit´e de Mons, Mons, Belgium
N. Beliy
Centro Brasileiro de Pesquisas Fisicas, Rio de Janeiro, Brazil
W.L. Ald´a J´unior, F.L. Alves, G.A. Alves, L. Brito, C. Hensel, A. Moraes, M.E. Pol,
JHEP11(2016)055
Universidade do Estado do Rio de Janeiro, Rio de Janeiro, Brazil
E. Belchior Batista Das Chagas, W. Carvalho, J. Chinellato4, A. Cust´odio, E.M. Da Costa,
G.G. Da Silveira5, D. De Jesus Damiao, C. De Oliveira Martins, S. Fonseca De Souza,
L.M. Huertas Guativa, H. Malbouisson, D. Matos Figueiredo, C. Mora Herrera, L. Mundim,
H. Nogima, W.L. Prado Da Silva, A. Santoro, A. Sznajder, E.J. Tonelli Manganote4,
A. Vilela Pereira
Universidade Estadual Paulista a, Universidade Federal do ABC b, S˜ao Paulo,
Brazil
S. Ahujaa, C.A. Bernardesb, S. Dograa, T.R. Fernandez Perez Tomeia, E.M. Gregoresb,
P.G. Mercadanteb, C.S. Moona, S.F. Novaesa, Sandra S. Padulaa, D. Romero Abadb,
J.C. Ruiz Vargas
Institute for Nuclear Research and Nuclear Energy, Sofia, Bulgaria
A. Aleksandrov, R. Hadjiiska, P. Iaydjiev, M. Rodozov, S. Stoykova, G. Sultanov, M. Vutova
University of Sofia, Sofia, Bulgaria
A. Dimitrov, I. Glushkov, L. Litov, B. Pavlov, P. Petkov Beihang University, Beijing, China
W. Fang6
Institute of High Energy Physics, Beijing, China
M. Ahmad, J.G. Bian, G.M. Chen, H.S. Chen, M. Chen, Y. Chen7, T. Cheng, C.H. Jiang,
D. Leggat, Z. Liu, F. Romeo, S.M. Shaheen, A. Spiezia, J. Tao, C. Wang, Z. Wang, H. Zhang, J. Zhao
State Key Laboratory of Nuclear Physics and Technology, Peking University, Beijing, China
Y. Ban, G. Chen, Q. Li, S. Liu, Y. Mao, S.J. Qian, D. Wang, Z. Xu Universidad de Los Andes, Bogota, Colombia
C. Avila, A. Cabrera, L.F. Chaparro Sierra, C. Florez, J.P. Gomez, C.F. Gonz´alez
Hern´andez, J.D. Ruiz Alvarez, J.C. Sanabria
University of Split, Faculty of Electrical Engineering, Mechanical Engineering and Naval Architecture, Split, Croatia
N. Godinovic, D. Lelas, I. Puljak, P.M. Ribeiro Cipriano University of Split, Faculty of Science, Split, Croatia Z. Antunovic, M. Kovac
Institute Rudjer Boskovic, Zagreb, Croatia
V. Brigljevic, D. Ferencek, K. Kadija, S. Micanovic, L. Sudic, T. Susa University of Cyprus, Nicosia, Cyprus
A. Attikis, G. Mavromanolakis, J. Mousa, C. Nicolaou, F. Ptochos, P.A. Razis, H. Rykaczewski