HAL Id: hal-02116418
https://hal.archives-ouvertes.fr/hal-02116418
Submitted on 30 Apr 2019
HAL is a multi-disciplinary open access
archive for the deposit and dissemination of
sci-entific research documents, whether they are
pub-lished or not. The documents may come from
teaching and research institutions in France or
abroad, or from public or private research centers.
L’archive ouverte pluridisciplinaire HAL, est
destinée au dépôt et à la diffusion de documents
scientifiques de niveau recherche, publiés ou non,
émanant des établissements d’enseignement et de
recherche français ou étrangers, des laboratoires
publics ou privés.
built-up noise based on water indices from Sentinel-2
MSI imagery
Xiucheng Yang, Qiming Qin, Pierre Grussenmeyer, Mathieu Koehl
To cite this version:
Xiucheng Yang, Qiming Qin, Pierre Grussenmeyer, Mathieu Koehl. Urban surface water body
de-tection with suppressed built-up noise based on water indices from Sentinel-2 MSI imagery. Remote
Sensing of Environment, Elsevier, 2018, 219, pp.259-270. �10.1016/j.rse.2018.09.016�. �hal-02116418�
Contents lists available atScienceDirect
Remote Sensing of Environment
journal homepage:www.elsevier.com/locate/rse
Urban surface water body detection with suppressed built-up noise based on
water indices from Sentinel-2 MSI imagery
Xiucheng Yang
a,b,⁎, Qiming Qin
a, Pierre Grussenmeyer
b, Mathieu Koehl
baInstitute of Remote Sensing and Geographic Information System, Peking University, 100871 Beijing, China bPhotogrammetry and Geomatics Group, ICube Laboratory UMR 7357, INSA Strasbourg, France
A R T I C L E I N F O
Keywords:
Urban Sentinel-2 Water index
Constrained energy minimization Noise
Built-up area
A B S T R A C T
Water spectral indices can enhance the difference between water bodies and background features. Thus, they have been widely used to extract and map surface water bodies based on multispectral satellite imagery. The urban scene is very heterogeneous since the surface is composed of a vast diversity of man-made objects, often of mixed distribution. Urban surface water mapping faces an extreme overestimation phenomenon because certain types of objects such as shadow, dark roads and some artificial features may return similar values to water bodies after an index computation. This study proposes a noise-prediction strategy to eliminate such misclassified nonwater areas in an automated way. Constrained energy minimization (CEM), a typical sparse target detection algorithm that does not need any background information, is utilized to draw the possible distribution of noise based on prior noise samples. The initial noise samples are automatically extracted by calculating the difference between two water indices widely accepted in urban scenes, namely, the modified normalized difference water index (MNDWI) and the automated water extraction index (AWEI). Recently freely available Sentinel-2 multi-spectral satellite imagery, with high spatial resolution (up to 10 m) and high repeated global coverage (every 5 days), was adopted, considering its potential on urban land cover mapping. Compared with the AWEI based approach, the results show that the proposed noise-prediction approach obtained an improved overall accuracy (increased Kappa coefficient by 0.07 on average), dramatically enhanced user accuracy (by 12.47% on average) with reduced noise, and simultaneously slightly decreased producer accuracy (by −1.19% on average). That is, the proposed method possesses an improvement of the misclassification of nonwater bodies to water bodies and a suppression of the missing of water body extraction at the same time. Finally, the comparative results, with the varying water index segmentation thresholds (−0.2 to 0.3) and an automatic Otsu threshold, indicate the ro-bustness to the threshold of the proposed approach.
1. Introduction
Urban surface water bodies, which significantly influence public health, living environments, regional climate, and the urban heat island effect, are important components of an urban environment (Brazel et al., 2009). Rapid urbanization increasingly results in the damage and decline of urban surface water bodies (Du et al., 2010). The measuring and monitoring of urban surface water using remote sensing technology is therefore an essential topic. In particular, the use of freely available high-spatial resolution optical satellite data is relevant (Pekel et al., 2016). Such data include the images obtained by the Landsat series (Tulbure and Broich, 2013;Singh et al., 2015;Acharya et al., 2016), Advanced Spaceborne Thermal Emission and Reflection Radiometer (ASTER) (Sivanpillai and Miller, 2010;Zhou et al., 2014), and
Sentinel-2 (Du et al., 2016;Yang et al., 2017) multispectral imagery.
A high extraction accuracy has been achieved in the mapping of surface water bodies, including lakes (Bhardwaj et al., 2015), rivers (Jiang et al., 2014), coastlines (Li and Gong, 2016) and water bodies in rural areas (McFeeters, 1996), under a relative homogeneous back-ground from remote sensing imagery with high spatial resolution. However, urban surface water mapping still faces the dramatic over-estimation phenomenon (Zhou et al., 2014) because of the hetero-geneous and mixed background scenes. The commission errors derive from the vast diversity of built-up areas, especially the low-albedo ob-jects that are typically presented as shadow areas and bituminous streets.
The use of the water index is currently accepted to enhance the differences between water and nonwater bodies based on combinations
https://doi.org/10.1016/j.rse.2018.09.016
Received 10 September 2017; Received in revised form 8 September 2018; Accepted 18 September 2018
⁎Corresponding author at: ICube Laboratory, 24, Boulevard de la Victoire 67084, STRASBOURG Cedex, 67000 Strasbourg, France
E-mail addresses:xiucheng.yang@etu.unistra.fr,xiuchengyang@163.com(X. Yang).
Remote Sensing of Environment 219 (2018) 259–270
Available online 19 October 2018
0034-4257/ © 2018 The Author(s). Published by Elsevier Inc. This is an open access article under the CC BY-NC-ND license (http://creativecommons.org/licenses/BY-NC-ND/4.0/).
of two or more spectral bands using various algebraic operations. The well-known normalized difference water index (NDWI) (McFeeters, 1996) is sensitive to built-up lands and frequently results in the over-estimation of water bodies in urban areas (Huang et al., 2015). The modified NDWI (MNDWI) (Xu, 2006) is mostly used in urban scenes to improve the separability of the built-up areas. The recently developed automated water extraction index (AWEI) (Feyisa et al., 2014), high-lights the water bodies in urban areas over shadow and dark surfaces. It consists of two separate indices: AWEInshfor urban areas where shadow is not an important factor and AWEIshin urban areas with dramatic shadow areas.Table 1summarizes the merits and possible noise source for these water indices in the urban environment. Water indices map multiband information to a single-band image with bimodal histogram characteristics. A binary threshold is then normally utilized to segment the pixels of the water bodies from the background. The pixel-level cutoff segmentation evidently requires improvement by combining with other techniques, particularly in the case of involving complex urban backgrounds. Multiscale object-level segmentation is commonly uti-lized to improve pixel-level extraction (Zhou et al., 2014). Spectral mixture analysis of mixed urban land–water pixels is performed in water abundance estimation (Xie et al., 2016;Halabisky et al., 2016). Machine learning approaches such as SVM (Sun et al., 2015), boosted random forest classifier (Ko et al., 2015), and deep learning (Yang et al., 2015) are also adopted.
Although great progress has been achieved in the area of urban water extraction, the overestimation of urban surface water bodies re-mains an issue because of the multicomponent features of urban scenes. Fisher et al. (2016)compared the popular water indices and concluded that the combination of highly reflective surfaces, dark surfaces, and shadows in urban areas could create false positives in all these indices. Currently, the commission errors from the similarity of shadows to water have attracted much attention (Pekel et al., 2016; Verpoorter et al., 2012). Although terrain shadows can be theoretically identified by simulating hill-shading with a DEM and the solar azimuth and ele-vation at the time of image acquisition (Feng et al., 2016;Verpoorter et al., 2012;Yamazaki et al., 2015), the urban shadows were usually regarded as the commission error for the water extraction (Muller et al., 2016). For shadow areas, some research combined the shadow detec-tion approaches, such as the shadow index (Huang et al., 2015) and the relationship with buildings (Yao et al., 2015) to reduce the false alarms of urban shadows to some degree. Besides,Pekel et al. (2016)utilized HSV-based classification and the time dimension to distinguish the urban permanent water bodies and urban shadows. But seasonal water detections within urban areas remain problematic, because these pixels
will move between land and water in multispectral feature-space over time even in the absence of shadow.
Actually, for the urban surface water mapping, important additional errors also derive from urban structures, such as dark roads and highly reflective surfaces (Muller et al., 2016). To the best of our knowledge, no existing approach for urban surface water mapping utilizes multi-spectral satellite imagery to extract water information while suppres-sing the false detection of various types of built-up areas.
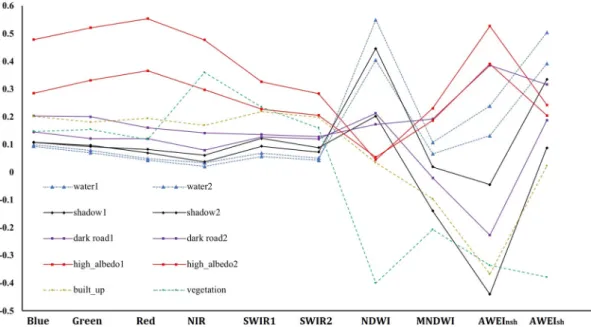
In this study, we propose an automated noise elimination strategy by predicting a possible noise map, whose pixels may possess a similar response to water bodies according to a water index calculation.Fig. 1 shows the original spectral curves (including the VIS, NIR, and SWIRs bands) and calculated water indices (including NDWI, MNDWI, AWEInshand AWEIsh) for some typical objects (water bodies, shadows, roads, high-albedo objects, built-up areas, and vegetation) in an urban scene. The water index maps multi-dimensional reflectance values to a single-band spectral-index map and it is easy to misclassify certain types of objects that possess similar responses to water bodies. The approach mainly considers the following two factors: (i) No water index can entirely draw a line with a given cutoff threshold between water and nonwater bodies (Table 1). Certain types of objects obtain similar index values to those of water bodies via an algebraic operation of multispectral bands. This condition is also true for the recently devel-oped AWEI, which still cannot exclude all the noises in the obtained water maps even with an optimal threshold. (ii) Different water indices include various types and varying degrees of noise. A comparison shows that MNDWI and AWEI can effectively remove the effect of the built-up areas (Li et al., 2016). The difference obtained by excluding the MNDWI images with AWEI images can be regarded as noise. Such noise samples indicate the presence of certain pixels of similar characteristics to those of water bodies, and can serve as training samples in predicting the possible distribution of noise in an entire image.
Constrained energy minimization (CEM) (Harsanyi, 1993) is a target detection approach originally dedicated to hyperspectral remote sen-sing imagery when a detected target is generally present in a small number of pixels in a scene. (Gao et al., 2015). This approach is in-creasingly utilized in multispectral images for extracting small objects, particularly for sparse mineral occurrence mapping, including iron mineralization mapping (Mazhari et al., 2017), alteration mineral mapping (Zhang et al., 2007), and hydrothermal alteration mapping (Zhang and Zhou, 2017). Under the assumption of a low-probability distribution for the target in an image, the CEM detector can distinguish the target of interest from the background using only prior spectral knowledge of the small target.
Table 1
Comparison of typical water indices in the urban environment and applicable satellite imagery.
Water indices Equation Merits Noise source in urban
scene Applicable multispectralsensors NDWI
+ G NIR
G NIR Common bands necessary Built-up land features Landsat 8Sentinel-2
ASTER WorldView-2/3 SPOT 6/7 Pleiades-1 MNDWI + G SWIR G SWIR 1
1 Improved contrast value between the built-up land and water Shadow, roads, and otherdark objects Landsat 8Sentinel-2
ASTER WorldView-3 AWEInsh × × + ×
+ + + G SWIR NIR SWIR
G NIR SWIR SWIR
4 ( 1) (0.25 2.75 2)
1 2 Enhanced separability between water, dark surfaces andother nonwater surfaces Some shadow and lowalbedo surfaces Landsat 8Sentinel-2
ASTER WorldView-3 AWEIsh + × × + ×
+ + + +
B G NIR SWIR SWIR B G NIR SWIR SWIR
2.5 1.5 ( 1) 0.25 2
1 2 Further improvement of accuracy by removing shadow pixelsthat AWEI
nshmay not effectively eliminate
Snow, ice and high albedo
built surfaces Landsat 8Sentinel-2 WorldView-3
In this paper, noise is defined as an object with similar digital values (normally positive values) to those of water bodies in an image of a certain water index. Noise is sparsely distributed in an image of a low-probability distribution. These characteristics match well with the CEM technique, which only requires a portion of noise samples obtained by the difference between two water indices, namely, AWEIshand MNDWI. Thus, this work aims to improve urban surface water mapping by suppressing noise in heterogeneous urban scenes, which consist of water bodies, vegetation, soil, roads, building roofs, and shadows. The proposed approach is expected to generate accurate urban surface water maps in a semi-automated way and regardless of the complexity of the urban environment. The overall workflow of the proposed method is shown in Fig. 2. Taking six separate cities in China and France as study areas, freely available Sentinel-2 top-of-atmosphere (TOA) reflectance images are preprocessed into the bottom-of-atmo-sphere (BOA) reflectance data with uniform spatial resolution in the official SNAP software (Section 2). The proposed method is conducted in two remote sensing image processing platforms, namely, ENVI for the pixel-oriented process and eCognition for the object-oriented ap-plication. (i) The noise region of interest (ROI) is initially obtained by the differentiation of the MNDWI and AWEIshwater maps and classified into two subclasses by an unsupervised classification, namely, low-al-bedo objects, which are typically shown as shadows and bituminous streets, and extremely high-albedo objects (Section 3.1). (ii) The CEM target detection approach is then employed to build the possible noise map, which presents the potential to be included in a water map and should be eliminated (Section 3.2). (iv) The final water map is created by eliminating the noise from the AWEIshwater maps. In addition, two object-oriented water extraction methods, namely, eCognition com-mercial software and SVM classification, are adopted to compare and evaluate the proposed approach by the confusion matrix and Kappa coefficient (Section 3.3). The comparative results are displayed in Section 4, and the effect of varying threshold values of water indices on the proposed approach is discussed in Section 5. Finally, Section 6 presents the conclusions and future works.
2. Study areas and materials
The study areas (Fig. 3) comprise the urban areas of six separate cities in China and France, namely, Beijing, which is located inland with a humid continental climate; Yantai, which is a coastal city in
transition between a humid subtropical and humid continental regime; Changsha, which is located in the river valley plain with a humid subtropical climate; Yangjiang, which is situated in a coastal area with a humid subtropical climate; Lyon, which is located at the confluence of the rivers with a humid subtropical climate; and Strasbourg, whose position is far inland with an oceanic climate.Table 2presents the main water bodies and background features for these study areas. The water bodies mainly include the river flowing through the cities, urban lakes, and a few sparsely distributed pools. The extensive occurrence of high-rise buildings in Beijing, Changsha and Yantai brings an abundance of shadowed areas, while the shadow effect is insignificant for the other three cities. For all study areas, there exists a vast diversity of the built-up areas with different types of spectral features, including the dark roads and very-high albedo objects.
The Sentinel-2 mission carries a multispectral instrument (MSI) with 13 spectral bands spanning from the visible spectrum (VIS) and near infrared (NIR) to the short wave infrared (SWIR) at different spatial resolutions on the ground ranging from 10 m to 60 m (Drusch et al., 2012). The mission consists of two satellites, namely, Sentinel-2A, launched on June 23, 2015, and Sentinel-2B, launched on March 7, 2017. These satellites provide a global coverage of the Earth's land surface every five days. The Sentinel-2 satellite images (Fig. 3) used in this study were collected on May 3, 2016 (Beijing); October 10, 2016 (Yantai); December 9, 2016 (Changsha); February 14, 2017 (Yang-jiang); April 13, 2017 (Lyon); and April 4, 2017 (Strasbourg), under clear weather conditions. The Sentinel-2 level 1C dataset was the standard product of the TOA reflectance freely downloaded from the Sentinels Scientific Data Hub (https://scihub.copernicus.eu/dhus/#/ home) and then was preprocessed by the official software Sentinel Application Platform (SNAP). The official atmosphere correction model, Sen2Cor,1was utilized to transfer the TOA reflectance to the
BOA data. In this study, only VIS, NIR, and SWIR bands were utilized. The two SWIR bands in 20 m were resized to 10 m by the resampling tool in SNAP, which divided the pixel on 4 pixels with the same values of gray to maintain the same spatial resolution as the VIS and NIR bands.
Fig. 1. The original spectral curves and calculated water indices for some typical objects in an urban scene. The value of the Y-axis indicates the BOA values for the
original spectral bands (which is between 0 and 1) and the normalized values for the water indices (which is between −1 and 1).
1Sen2Cor.http://step.esa.int/main/third-party-plugins-2/sen2cor/. Last ac-cessed 2017/09/05.
3. Methods
3.1. Water indices and noise ROI generation
Two urban water indices, namely, MNDWI and AWEIsh, were in-itially calculated to enhance the difference between water and non-water bodies and to generate two initial non-water body maps. Water bodies tend to positive values in the MNDWI and AWEIsh, whereas soil, ve-getation, and built-up classes are expected to hold negative values (Xu, 2006; Feyisa et al., 2014). Thus, the normally empirical threshold is zero, which is adopted in this study. On the basis of the binary threshold (zero), the initial water map was obtained via object-oriented multiscale segmentation and classification to replace the direct pixel-level surface water mapping. Homogeneous blocks were built using multiresolution segmentation in eCognition software. Some blocks were categorized as water when their spectral mean value is positive. An integration can eliminate the dramatic “salt-and-pepper phenomenon” that consists of sparse pixels and improve the time efficiency of sub-sequent map analysis processing in vector levels instead of raster image spaces.
In this study, noise refers to nonwater built-up areas, most likely dark objects and very high-albedo areas, which possess a positive re-sponse similar to surface water bodies in the water index image. Although the water index attempts to enhance the difference between water bodies and background features, it inevitably mixes some non-water pixels with non-water bodies (Fig. 1), which are mapped to a section under similar values via the combination of several bands. Both MNDWI and AWEIshmap some of the extremely high-albedo built-up areas into positive values and misclassify them as water bodies to
different degrees (Fig. 4). MNDWI also easily misclassifies shadow and dark roads into water bodies, while AWEIshsuppresses this type of noise to some extent. Considering the overestimation fact of the urban surface water extraction, the difference between the water map from MNDWI and that from AWEIshdenotes a portion of the noise area. In view of the typical spectral difference between the two types of noises in the ori-ginal multispectral image, we utilize an unsupervised ISODATA classi-fication to obtain two types of noise ROI, namely, low-albedo noise and extremely high-albedo noise (Fig. 5left).
3.2. CEM and noise detection
The CEM algorithm (Harsanyi, 1993) can detect certain type of known targets by maximizing the responses of the target spectra and suppressing the responses of unknown background signatures (Mazhari et al., 2017). Under the assumption of low-probability targets in an image, the CEM detector can effectively distinguish the target of in-terest from the background (Ji et al., 2015;Chang and Heinz, 2000) using only the prior knowledge of the target (Marwaha et al., 2014). These characteristics agree with our goal for noise extraction: (i) the noise are small blocks in sparse distribution, (ii) only the noise ROI is available for the detection of similar targets in the current work, and (iii) the categories and samples of heterogeneous background are un-necessary and unavailable.
Assuming the multispectral image data set is written as X = {x1,x2, …,xN}, where xi= (xi1,xi2,…,xiL)Tfor 1 ≤ i ≤ N is a L-dimensional
vector, N is the total number of pixels, and L is the number of bands (generally L ≪ N). In the CEM algorithm, only target spectral signature (noise ROI) is given, denoted as d = (d1,d2,…,dL)Tand is known as a
Fig. 2. Workflow of the proposed urban surface mapping approach based on noise prediction strategy. All three thresholds, including the water index segmentation,
priori, and any prior knowledge is not required, e.g., multiple targets of interest or background. The CEM is used to design an FIR linear filter
w = (w1,w2,…,wL)Tthat keeps the output energy of the target at unity
and suppresses the output energy of the background at the same time. The energy of one pixel can be evaluated by a scalar value yi= ∑l=1Lwlxil= wTxi(1 ≤ i ≤ N), and the objective is to find operator w to satisfy two constraints: one minimizes the total output energy for
all pixels (E = ∑i=1Nyi2); the other is that when the operator is applied
on the target signal (d), the output energy is 1. Correspondingly, an optimization problem is defined as:
= = = w Rw d w N y d w = min 1 min 1 w i N w T T i l L l l =1 2 1 (1)
where R = x xN1 i iT, the solution to this constrained minimization pro-blem is given by (Harsanyi, 1993):
= w R d d R d CEM T 1 1 (2)
In practice, the pixel energy of the Sentinel-2 image X is output by CEM filter as wCEMTX, where wCEMis calculated according to the noise
samples d. The larger the pixel output energy achieves, the greater the probability of the noise is. Otherwise, the pixel has lower probability as noise. The noise in urban scene may consist of extremely high-albedo areas and dark areas, two CEM filters are adopted to generate their noise maps, respectively. The prior knowledge of the two types of initial samples has been obtained (Fig. 5. Left).
The extremely high-albedo noise shows different spectral informa-tion from that of water bodies in the original multispectral image. The minimum noise fraction transform of the original multispectral bands is utilized to obtain the irrelevant bands for CEM calculation, because adding linearly irrelevant data to multidimensional data can improve the performance of CEM (Geng et al., 2014). A loose CEM detection threshold is recommended and defined (default value of 0.4).
The low-albedo built-up areas may show similar spectral curve to
Fig. 3. Study areas and imagery materials. The study cases are urban areas of Beijing, Yantai, Changsha and Yangjiang, China, and Lyon and Strasbourg, France. The
images are shown with a pseudocolor composite of bands (8, 4, and 3) of the Sentinel-2 MSI BOA data.
water bodies in the original bands. To improve the performance of CEM on dark areas, we expand the dimensionality of the multispectral image with useful spectral index data (Ji et al., 2015). Three widely accepted shadow indices (Eqs.(3)–(5)) in three different color spaces are adopted to enhance the difference between water and shadow-like low-albedo areas: (i) A shadow index (SI)2considers the low reflectance of shadows
in the blue, red, and green spectral bands. (ii) The C3∗index is used in shadow detection in the nonlinear C1, C2, C3, and C4 color spaces (Besheer and Abdelhafiz, 2015). (iii) A normalized saturation value difference index is constructed to identify shadows (Ma et al., 2008), which exhibit high saturation (S) and low value (V) in the case of the HSV color space. A high CEM detection threshold is recommended and defined (default value of 1.2).
= SI 3(1 R) (1 G) (1 B) ; (3) = C B R G NIR arctan max( , , ) ; 3 (4) = + = = NDVDI S V S V V R G B S R G B R G B V
, max( , , ), max( , , ) min( , , )
(5) The obtained noise map (Fig. 5. Right) indicates the possible dis-tribution of noise in the water maps that utilize the water index-based approaches. That is, the corresponding areas should be eliminated in the original water maps, where may possibly show a similar digital value to those of water bodies according to the water index calculation. 3.3. Water surface mapping and accuracy assessment
Water surface mapping can finally be obtained by erasing the noise
Table 2
The compositions and statistics of the main land cover of the study areas.
Study area Water Background
Objects Area (km2) Objects Area (km2)
Beijing Sparsely distributed man-made lakes, aqueduct and moats
Like Kunming Lake, Yuyuan Pond, Houhai Lake 3.9 Built-up areas including many high-rises and dark roadsUrban green spaces Extreme shadows
109.2 Yantai Jiahe River and Taozi Bay 18.2 Mountainous and hilly areas
Built-up areas including some high-rise buildings Vacant land
Some shadows
117.6
Changsha Xiang River and Liuyang River
Some urban lakes, such as Houhu Lake, Xianjia Lake, and Yuejin Lake 15.0 Built-up areas including high-rise buildingsVacant land Extreme shadows
127.5 Yangjiang Moyang River
Yuanliang Lake, Dutian Reservoir 3.3 Low-rise buildingsA small amount of shadows 41.1 Lyon Saône and Rhône rivers
Golden Head Park Grand Parc Miribel Jonage
9.3 Low-rise buildings Cropland
A small amount of shadows
151.0 Strasbourg Rhine River
Ill River flowing through the city Baggersee Lake
7.0 Low-rise buildings Cropland
A small amount of shadows
132.5
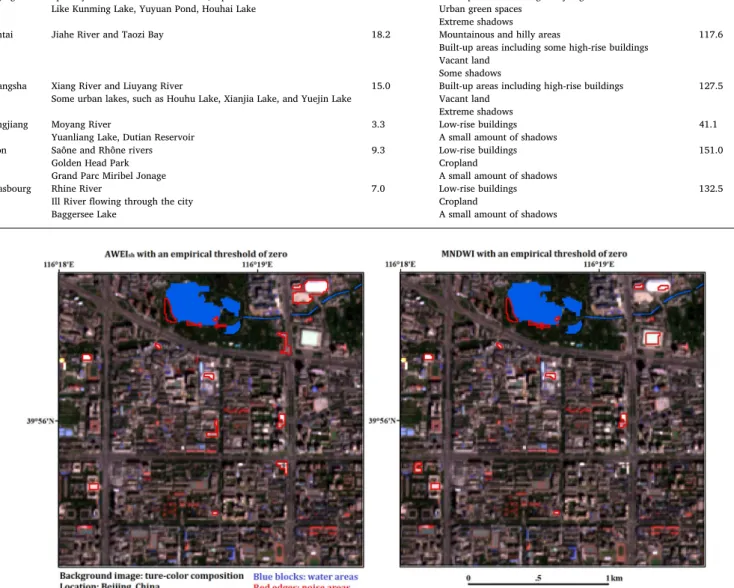
Fig. 4. The overestimation phenomenon utilizing water index-based approaches. The noises consist of highly reflective surfaces, dark surfaces, and shadows in urban
areas, yet their distributions are different for the two water indices.
2Shadow index (SI). http://www.spaceanalyzer.com/index.php/shadow-index-si. Last accessed 2017/6/14.
areas from the AWEIshwater map. The proposed method is compared with two typical water mapping approaches, that is, the initial object-level AWEIshwithout improvement by the proposed noise elimination procedure and the object-level SVM-based water mapping with the manual selection of training sets (Fig. 6). The comparison between the proposed approach and AWEIsh method is conducted in artificial thresholds varying between −0.2 and 0.3 and in automated binary segmentation threshold. “True” water bodies of the six cities are manually digitized in ArcMap through the visual interpretation process of the experimental Sentinel-2 images in the scale of 1:4000, which is accurate enough to measure the mapping results in the pixel level.
Four unit rates, namely, producer's accuracy (PA), user's accuracy (UA), overall accuracy (OA), and kappa coefficient (Kappa; Eqs.(6)–(9), respectively) are used to assess the accuracy and evaluate the final water maps produced by the different approaches. PA represents how well the reference pixels of the surface water body are classified. That is, for the water body in the reference plots, accuracy relates to the number of pixels on the map that are correctly labeled. UA represents the probability of a pixel being classified into the water category. That is, for the detected water body, accuracy relates to the number of pixels
on the map that are actually water bodies in the object space. OA and Kappa present the general accuracy for a certain approach.
= + PA TP TP FN (6) = + UA TP TP FP (7) = + OA TP TN T (8) = × + + × + + + × + × + × + + + × + Kappa T TP TN TP FP TP FN FN TN FP TN T T TP FP TP FN FN TN FP TN ( ) ( ) ( ) ( ) ( ) ( ) ( ) ( ) ( ) (9) In Eqs.(6)–(9), TP (true positives), FN (false negatives), FP (false positives), and TN (true negatives) are the four different types of pixels determined by comparing the extracted water body with the reference map. The TP, FN, FP, and TN indicate the number of correct extractions, undetected water pixels, incorrect extractions, and pixels of nonwater bodies that are correctly rejected, respectively. T is the total number of pixels in the experimental Sentinel-2 images.
Fig. 5. The image in the left shows the noise samples obtained by considering the difference between the AWEIshand MNDWI water maps. The green and purple edges contain two types of noises determined by an unsupervised classification, namely, low-albedo and extremely high-albedo built-up areas. The image in the right presents the possible noise map via CEM prediction. The green and purple areas show the possible noise areas from low-albedo and extremely high-albedo objects, respectively, which may achieve positive values via the water index calculation. (For interpretation of the references to color in this figure legend, the reader is referred to the web version of this article.)
Fig. 6. Workflow of comparative approaches: one is the classic cutoff threshold segmentation based on AWEI, and the other is the SVM classification by the manual
drawing of training samples. Both approaches are also conducted in the object-oriented level.
4. Results
4.1. Water mapping results
The experiments were conducted using the Sentinel-2 MSI images (Fig. 3) to comparatively evaluate the performance of the proposed approach for water body extraction in urban environments. The images for the four study areas were processed by object-oriented AWEIsh-based binary segmentation in eCognition, object-oriented SVM water mapping in ENVI, and the proposed noise prediction approach (Fig. 7). Generally, all of the methods can extract typical and clear water areas, including coastal areas, lakes, and wide rivers. The SVM-based approach can extract most of the water areas even for the small rivers in Beijing and Strasbourg, sparse pools in Yangjiang, and existing phyto-plankton in Yantai. In comparison with the classic AWEIshextraction, the proposed noise elimination approach reserves most of the water areas after the post-processing in the noise elimination. That is, the obtained noise candidate map can effectively avoid true water areas and improve the noise elimination process. The only evident error ex-clusion is observed in some lakes in Changsha.
For the classic AWEIshand SVM approaches, the sources and degrees of noise are considerably different, and they change in different study areas due to the complexity of the surface environment. The SVM and AWEIshwork best in Yantai and Yangjiang, respectively. Extreme noise exists in the most complex scenes of Beijing and Changsha, which in-clude extremely high-albedo building roofs and the widely existing shadow areas of high-rise buildings. For the proposed approach, the over-detection phenomenon is dramatically improved in all six study areas. Most of the sparse noises are eliminated, including the low-al-bedo and extremely high-allow-al-bedo built-up areas with similar values to those of the water index.
4.2. Accuracy assessment
Table 3summarizes the extraction accuracy of the water mapping with the classic AWEIsh, SVM, and the proposed approach. The detailed confusion matrixes of the proposed approach are included in the Sup-plement. A. The high OA indicates the feasibility of the two classic
approaches and the newly proposed approach. By comparing the water index-based methods with or without the proposed noise elimination, Kappa improves after noise elimination and achieves robust results, especially for the study area of Beijing and Changsha with the more complex surface scene. The PA slightly decreases by approximately 1% in most cases, thereby indicating that water and noise pixels are well distinguished, and by 5% in the worst cases (Changsha) because of the error elimination of the ponds. The UA dramatically improves to ap-proximately 90% or more for all the study areas, especially for Beijing (from 67.93%) and Changsha (from 71.92%), where there are extreme high-rise building shadows. These results agree with our aim, that is, to eliminate noise (improved UA with 8.45% on average) and reserve water bodies (slightly decreased PA with 1.14% on average) simulta-neously. Generally, the SVM obtains the highest PA, and the UA is re-lated to surface complexity. The SVM shows extreme overestimation phenomenon in Beijing and Strasbourg with low UA accuracy, although it achieves acceptable results for the other study areas. The perfor-mance of the SVM also depends on the manual interaction of training samples.
In addition, we also evaluated the study area of Strasbourg with the official topographic and thematic data.3The reference data with two
different precisions (10 m and 0.5 m) are adopted: (i) thematic map with the precision of 10 m, which is accordant with the utilized Sen-tinel-2 image, and (ii) the topographic map with the precision of 0.5 m, which includes the detailed urban streams.Table 4displays the accu-racy of the proposed method on the reference of the official data. The high accuracy is obtained in the scale of 10 m, which reaffirms that the urban surface thematic maps are of high quality with our efforts. However, in the scale of 0.5 m, the PA accuracy is low, because of lots of urban streams are invisible in the Sentinel-2 image.
5. Threshold discussion
The comparative results show that mapping of the urban surface water bodies based on the proposed noise detection approach achieves improved accuracy. The proposed approach can be conducted in an automated way with several default thresholds in the water indices mapping and CEM noise prediction.
In the workflow, the empirical threshold (zero) segments the ima-ging of water indices. Threshold selection is a key step in extracting water pixels from water index images. The effects of the different thresholds of water indices must be addressed.
In this study, we adopt changing thresholds (such as, −0.2, −0.1, −0.05, 0.05, 0.1, 0.2, and 0.3) and an automated Otsu threshold to compare the results. For the Otsu adapting threshold, two different thresholds of AWEIshand MNDWI (Table 5) were obtained and used to calculate the noise.
Fig. 8shows the changes of PA, UA, and Kappa in the six study areas before and after the implementation of the proposed noise elimination approach. The threshold 0 ± 0.05 is robust for the proposed method because it constantly achieves nearly optimal results. Thus, a high PA should be maintained, and UA and Kappa should be improved to above 0.8. For the rigid thresholds larger than 0.05, water mapping can obtain clear water areas and eliminate noise, thereby leading to insufficient noise candidates for CEM detection. The rigid threshold excludes noise directly but extremely limits the accuracy of PA. The typical examples are Yantai and Beijing, in which PA and Kappa decrease with the
Fig. 7. The final water maps utilizing the proposed method and two classic approaches. The blue shows the accurate detected water bodies (TP), green shows the
missing water bodies (FN), and red shows the error detection (FP). (For interpretation of the references to color in this figure legend, the reader is referred to the web version of this article.)
Table 3
Water mapping accuracy assessment results on the Sentinel-2 image.
Study area Approach PA UA OA Kappa
Beijing Proposed 90.30% 95.66% 99.53% 0.927 AWEIsh 90.72% 67.93% 98.21% 0.768 SVM 95.61% 52.32% 96.86% 0.661 Yantai Proposed 92.43% 97.46% 98.66% 0.941 AWEIsh 93.13% 90.92% 97.83% 0.908 SVM 96.28% 96.66% 99.05% 0.959 Changsha Proposed 93.87% 97.01% 99.05% 0.949 AWEIsh 98.77% 71.92% 95.79% 0.809 SVM 96.06% 92.75% 98.79% 0.937 Yangjiang Proposed 93.44% 99.70% 99.50% 0.962 AWEIsh 93.47% 97.33% 99.33% 0.950 SVM 96.14% 84.15% 98.38% 0.889 Lyon Proposed 96.23% 88.05% 99.01% 0.914 AWEIsh 96.96% 81.12% 98.50% 0.875 SVM 98.21% 80.40% 98.49% 0.876 Strasbourg Proposed 89.62% 90.88% 99.01% 0.897 AWEIsh 89.66% 84.80% 98.66% 0.865 SVM 97.71% 75.58% 98.28% 0.843 Average of the six study areas Proposed 92.65% 94.79% 99.13% 0.932 AWEIsh 93.79% 82.34% 98.05% 0.863
SVM 96.67% 80.31% 98.31% 0.861 3Eurometropole of Strasbourg. http://www.sig.strasbourg.eu/index.php?
page=opendata(Accessed on 08/25/2018).
increase in the cutoff threshold. For the thresholds smaller than −0.05, the noise cannot be suppressed. In the cases of Beijing and Changsha, these thresholds can eliminate noise to a certain extent. By contrast, the thresholds fail to exclude noise in the cases of Yantai. Loose thresholds can provide sufficient candidates, although extensive noise should be eliminated. Besides, for the conventional index-based mapping, the automated threshold can lead to good results. For the proposed ap-proach, the adjusted Otsu threshold can improve the results to a certain extent because it constantly shows an improved inflection point (black
line inFig. 8) in the accuracy curve. But the optimal Otsu threshold is rigid for the proposed approach and cannot obtain sufficient samples for CEM noise detection. That is, when a high segmentation threshold is utilized, the water body recognition rate is relative low and the noise samples obtained may be insufficient. Moreover, when a small threshold is utilized, the water body recognition rate is high and ex-treme noise needs to be eliminated.
Thus, the proposed noise suppression approach shows a relative robustness against changing thresholds for water mapping and achieves stable results with the empirical threshold (zero). If the traditional AWEI is adopted, then the optimal threshold for different areas changes. However, the effect of the threshold is relatively stable after the proposed noise elimination post-processing, which can mostly bal-ance PA and UA simultaneously.
The robustness to the thresholds of the proposed approach makes it promising to be accomplished on large scales. We also conducted the proposed method on some other cities (Melbourne, Ottawa and New York) with the empirical threshold of zero (Supplement B). The current global and national water maps have obtained good results in the non-urban areas yet the results on non-urban areas still need improvement (Verpoorter et al., 2012; Mueller et al., 2016;Pekel et al., 2016). To apply our proposed strategy to improve the urban surface water map-ping using the recently developed Google Earth Engine Development platform (Gorelick et al., 2017), we are working on the combination with the urban extent extraction approach (Trianni et al., 2015) and the
Table 4
Assessment of Strasbourg study area with the official data.
Reference data PA UA OA Kappa
10 m 80.83% 94.15% 98.79% 0.864 0.5 m 64.04% 97.08% 97.50% 0.760
Table 5
Autothreshold of two water index images by Otsu algorithm to calculate the initial noise samples.
Beijing Yantai Changsha Yangjiang Lyon Strasbourg AWEIsh 0.166 0.452 0.405 0.202 0.154 0.289
MNDWI 0.148 0.195 0.234 0.079 0.021 0.092
Fig. 8. Accuracy assessment with different thresholds to water mapping by conventional AWEI and the proposed method. The proposed approach achieves the
optimal status generally in the default threshold of zero, while the conventional index-based approach tends to have different optimal thresholds according to the different study areas. The vertical black lines indicate the results using automated segmentation thresholds, in which the conventional index-based approach reaches a relatively high Kappa coefficient. But such optimal segmentation thresholds only bring improvement compared with the values nearby and cannot reach to the optimal water mapping results for the proposed approach.
replacement of eCognition object-oriented segmentation with open-source methodology (typically the SLIC superpixel approach (Achanta et al., 2012)).
The other two thresholds in the paper are utilized to draw the possible noise maps by CEM target detection. We recommend a low threshold (default value of 0.4) for the extremely high-albedo objects and a high threshold (default value of 1.2) for the low-albedo areas. The specific thresholds adopted in the experiment for each study area are displayed inTable 6.
6. Conclusions
This study aims to solve the overestimation phenomenon on the urban surface water mapping in an automated way. The proposed ap-proach obtained the initial noise samples by calculating the difference between two typical water index maps and predicted the noise dis-tribution by CEM sparse target detection algorithm. The noise samples considered the different noise sources of the two typical water indices and the misclassification of nonwater bodies because of the hetero-geneous features in an urban scene. In addition, the CEM target de-tection algorithm can distinguish the target of interest from the back-ground using only prior spectral knowledge of the small target. Such noise prediction strategy can be utilized for other object extraction applications in which the overestimation is the main error source.
The results show the possibility of improving the misclassification of nonwater bodies to water bodies, and suppressing the missing water body extraction at the same time. Traditionally, overestimating or un-derestimating water areas with a cutoff threshold setting is unavoid-able. High PA accuracy generally indicates the loss of UA accuracy, and vice versa. The proposed noise suppression approach is utilized in this work to maintain a relatively high PA and to dramatically improve UA to a certain extent. Taking several urban areas in China and France as examples, the proposed noise prediction strategy improved the UA and Kappa coefficient, on average, of 12.47% and 0.07, with a slight de-crease of PA, on average, of 1.19%, compared to the conventional method.
To achieve automation, we introduce an empirical threshold (zero) for water mapping and noise sample selection. Through a comparative assessment with varying thresholds (i.e., −0.2 to 0.3) and an auto-mated threshold, the empirical threshold (zero) presents theoretically and experimentally stable results. The high threshold (possible larger than 0.2) cannot generate enough noise samples for the CEM detection, while the loose threshold (possible lower than −0.1) may bring too much noise that cannot be effectively eliminated.
This paper took Sentinel-2 image as dataset to explore its potential on urban surface water bodies mapping. Sentinel-2 multispectral ima-gery has advantages on spatial resolution and repeated coverage com-pared to conventional freely available Landsat series imagery. Although the spatial resolution has been improved to 10 m, the resolution is still not fine enough to extract the small pools and brooks. The proposed approach reduces the commission errors in the urban surface water mapping using single data image, which benefits for the change de-tection, seasonal water body extraction and flooding mapping. The high repeated coverage of Sentinel-2 also provides the potential for time-series analysis in the monthly scale. Moreover, our current work focuses on the automated extraction of urban extent and the introducing of open-source superpixel segmentation approach, which are the bases of
applying the proposed method in the open-source Google Earth Engine Development platform to realize large-scale and dynamic analysis. Acknowledgements
This work is supported by the National Key Technologies R&D Program of China (No. 2017YFB0503905). The work of X. Yang was supported by the China Scholarship Council (No. 201504490008). Appendix A. Supplementary data
Supplementary data to this article can be found online athttps:// doi.org/10.1016/j.rse.2018.09.016.
References
Achanta, R., Shaji, A., Smith, K., Lucchi, A., Fua, P., Süsstrunk, S., 2012. SLIC superpixels compared to state-of-the-art superpixel methods. IEEE Trans. Pattern Anal. Mach. Intell. 34 (11), 2274–2282.https://doi.org/10.1109/TPAMI.2012.120.
Acharya, T.D., Lee, D.H., Yang, I.T., Lee, J.K., 2016. Identification of water bodies in a Landsat 8 OLI image using a J48 decision tree. Sensors 16.https://doi.org/10.3390/ s16071075.
Besheer, M., Abdelhafiz, A., 2015. Modified invariant colour model for shadow detection. Int. J. Remote Sens. 36 (24), 6214–6223.https://doi.org/10.1080/01431161.2015. 1112930.
Bhardwaj, A., Singh, M.K., Joshi, P.K., Snehmani, Singh, S., Sam, L., Gupta, R.D., Kumar, R., 2015. A lake detection algorithm (LDA) using Landsat 8 data: a comparative approach in glacial environment. Int. J. Appl. Earth Obs. Geoinf. 38, 150–163.
https://doi.org/10.1016/j.jag.2015.01.004.
Brazel, P., Quay, R.A., Myint, S., Grossman-Clarke, S., Miller, A., Rossi, S., 2009. Using watered landscapes to manipulate urban heat island effects: how much water will it take to cool Phoenix? J. Am. Plan. Assoc. 76 (1), 109–121.https://doi.org/10.1080/ 01944360903433113.
Chang, C., Heinz, D.C., 2000. Constrained subpixel target detection for remotely sensed imagery. IEEE Trans. Geosci. Remote Sens. 38, 1144–1159.https://doi.org/10.1109/ 36.843007.
Drusch, M., Del Bello, U., Carlier, S., Colin, O., Fernandez, V., Gascon, F., Meygret, A., 2012. Sentinel-2: ESA's optical high-resolution mission for GMES operational ser-vices. Remote Sens. Environ. 120, 25–36.https://doi.org/10.1016/j.rse.2011.11. 026.
Du, N., Ottens, H., Sliuzas, R., 2010. Spatial impact of urban expansion on surface water bodies—a case study of Wuhan, China. Landsc. Urban Plan. 94 (3), 175–185.https:// doi.org/10.1016/j.landurbplan.2009.10.002.
Du, Y., Zhang, Y., Ling, F., Wang, Q., Li, W., Li, X., 2016. Water bodies' mapping from Sentinel-2 imagery with modified normalized difference water index at 10-m spatial resolution produced by sharpening the SWIR band. Remote Sens. 8 (4).https://doi. org/10.3390/rs8040354.
Feng, M., Sexton, J.O., Channan, S., Townshend, J.R., 2016. A global, high-resolution (30-m) inland water body dataset for 2000: first results of a topographic–spectral clas-sification algorithm. Int. J. Digital Earth 9 (2), 113–133.https://doi.org/10.1080/ 17538947.2015.1026420.
Feyisa, G.L., Meilby, H., Fensholt, R., Proud, S.R., 2014. Automated water extraction index: a new technique for surface water mapping using Landsat imagery. Remote Sens. Environ. 140, 23–35.https://doi.org/10.1016/j.rse.2013.08.029. Fisher, A., Flood, N., Danaher, T., 2016. Comparing Landsat water index methods for
automated water classification in eastern Australia. Remote Sens. Environ. 175, 167–182.https://doi.org/10.1016/j.rse.2015.12.055.
Gao, L., Yang, B., Du, Q., Zhang, B., 2015. Adjusted spectral matched filter for target detection in hyperspectral imagery. Remote Sens. 7, 6611–6634.https://doi.org/10. 3390/rs70606611.
Geng, X., Ji, L., Sun, K., Zhao, Y., 2014. CEM: more bands, better performance. IEEE Geosci. Remote Sens. Lett. 11, 1876–1880.https://doi.org/10.1109/LGRS.2014. 2312319.
Gorelick, N., Hancher, M., Dixon, M., Ilyushchenko, S., Thau, D., Moore, R., 2017. Google earth engine: planetary-scale geospatial analysis for everyone. Remote Sens. Environ. 202, 18–27.https://doi.org/10.1016/j.rse.2017.06.031.
Halabisky, M., Moskal, L.M., Gillespie, A., Hannam, M., 2016. Reconstructing semi-arid wetland surface water dynamics through spectral mixture analysis of a time series of Landsat satellite images (1984–2011). Remote Sens. Environ. 177, 171–183.https:// doi.org/10.1016/j.rse.2016.02.040.
Harsanyi, J.C., 1993. Detection and Classification of Subpixel Spectral Signatures in Hyperspectral Image Sequences. Univ, Maryland.
Huang, X., Xie, C., Fang, X., Zhang, L., 2015. Combining pixel-and object-based machine learning for identification of water-body types from urban high-resolution remote-sensing imagery. IEEE J. Sel. Top. Appl. Earth Observ. Remote Sens. 8 (5), 2097–2110.https://doi.org/10.1109/JSTARS.2015.2420713.
Ji, L., Geng, X., Sun, K., Zhao, Y., Gong, P., 2015. Target detection method for water mapping using Landsat 8 OLI/TIRS imagery. Water 7, 794–817.https://doi.org/10. 3390/w7020794.
Jiang, H., Feng, M., Zhu, Y., Lu, N., Huang, J., Xiao, T., 2014. An automated method for extracting rivers and lakes from Landsat imagery. Remote Sens. 6, 5067–5089.
Table 6
The thresholds for CEM noise prediction of the extremely high albedo and low-albedo built-up areas.
Threshold Beijing Yantai Changsha Yangjiang Lyon Strasbourg Very-high albedo 0.4 0.3 0.4 0.4 0.3 0.4 Low albedo 1.2 1.0 1.2 1.1 1.5 1.4
https://doi.org/10.3390/rs6065067.
Ko, B.C., Kim, H.H., Nam, J.Y., Lamberti, F., 2015. Classification of potential water bodies using Landsat 8 OLI and a combination of two boosted random forest classifiers. Sensors 15, 13763–13777.https://doi.org/10.3390/s150613763.
Li, W., Gong, P., 2016. Continuous monitoring of coastline dynamics in western Florida with a 30-year time series of Landsat imagery. Remote Sens. Environ. 179, 196–209.
https://doi.org/10.1016/j.rse.2016.03.031.
Li, Y., Gong, X., Guo, Z., Xu, K., Hu, D., Zhou, H., 2016. An index and approach for water extraction using Landsat–OLI data. Int. J. Remote Sens. 37, 3611–3635.https://doi. org/10.1080/01431161.2016.1201228.
Ma, H., Qin, Q., Shen, X., 2008. Shadow segmentation and compensation in high re-solution satellite images. IEEE Geosci. Remote Sens. Symp. 2008, 1036–1039.
https://doi.org/10.1109/IGARSS.2008.4779175.
Marwaha, R., Kumar, A., Raju, P.L.N., Murthy, Y.V.N.K., 2014. Target detection algorithm for airborne thermal hyperspectral data. Int. Arch. Photogramm. Remote. Sens. Spat. Inf. Sci. 827–832.https://doi.org/10.5194/isprsarchives-XL-8-827-2014. Mazhari, N., Shafaroudi, A.M., Ghaderi, M., 2017. Detecting and mapping different types
of iron mineralization in Sangan mining region, NE Iran, using satellite image and airborne geophysical data. Geosci. J. 21 (1), 137–148.https://doi.org/10.1007/ s12303-016-0018-9.
McFeeters, S.K., 1996. The use of the normalized difference water index (NDWI) in the delineation of open water features. Int. J. Remote Sens. 17, 1425–1432.https://doi. org/10.1080/01431169608948714.
Mueller, N., Lewis, A., Roberts, D., Ring, S., Melrose, R., Sixsmith, J., ... Ip, A., 2016. Water observations from space: mapping surface water from 25 years of Landsat imagery across Australia. Remote Sens. Environ. 174, 341–352.https://doi.org/10. 1016/j.rse.2015.11.003.
Pekel, J.F., Cottam, A., Gorelick, N., Belward, A.S., 2016. High-resolution mapping of global surface water and its long-term changes. Nature 540 (7633), 418–422.https:// doi.org/10.1038/nature20584.
Singh, K., Ghosh, M., Sharma, S.R., 2015. WSB-DA: water surface boundary detection algorithm using Landsat 8 OLI data. IEEE J. Select. Top. Appl. Earth Observ. Remote Sens. 9 (1), 363–368.https://doi.org/10.1109/JSTARS.2015.2504338.
Sivanpillai, R., Miller, S.N., 2010. Improvements in mapping water bodies using ASTER data. Eco. Inform. 5, 73–78.https://doi.org/10.1016/j.ecoinf.2009.09.013. Sun, X., Li, L., Zhang, B., Chen, D., Gao, L., 2015. Soft urban water cover extraction using
mixed training samples and support vector machines. Int. J. Remote Sens. 36, 3331–3344.https://doi.org/10.1080/01431161.2015.1042594.
Trianni, G., Lisini, G., Angiuli, E., Moreno, E.A., Dondi, P., Gaggia, A., Gamba, P., 2015. Scaling up to national/regional urban extent mapping using Landsat data. IEEE J. Select. Top. Appl. Earth Observ. Remote Sens. 8 (7), 3710–3719.https://doi.org/10. 1109/JSTARS.2015.2398032.
Tulbure, M.G., Broich, M., 2013. Spatiotemporal dynamic of surface water bodies using Landsat time-series data from 1999 to 2011. ISPRS J. Photogramm. Remote Sens. 79, 44–52.https://doi.org/10.1016/j.isprsjprs.2013.01.010.
Verpoorter, C., Kutser, T., Tranvik, L., 2012. Automated mapping of water bodies using Landsat multispectral data. Limnol. Oceanogr. Methods 10 (12), 1037–1050.https:// doi.org/10.4319/lom.2012.10.1037.
Xie, H., Luo, X., Xu, X., Pan, H., Tong, X., 2016. Automated subpixel surface water mapping from heterogeneous urban environments using Landsat 8 OLI imagery. Remote Sens. 8, 584.https://doi.org/10.3390/rs8070584.
Xu, H., 2006. Modification of normalised difference water index (NDWI) to enhance open water features in remotely sensed imagery. Int. J. Remote Sens. 27 (14), 3025–3033.
https://doi.org/10.1080/01431160600589179.
Yamazaki, D., Trigg, M.A., Ikeshima, D., 2015. Development of a global ~90 m water body map using multi-temporal Landsat images. Remote Sens. Environ. 171, 337–351.https://doi.org/10.1016/j.rse.2015.10.014.
Yang, L., Tian, S., Yu, L., Ye, F., Qian, J., Qian, Y., 2015. Deep learning for extracting water body from Landsat imagery. Int. J. Innov. Comput. Inf. Control. 11, 1913–1929.
Yang, X., Zhao, S., Qin, X., Zhao, N., Liang, L., 2017. Mapping of urban surface water bodies from Sentinel-2 MSI imagery at 10 m resolution via NDWI-based image sharpening. Remote Sens. 9, 596.https://doi.org/10.3390/rs9060596.
Yao, F., Wang, C., Dong, D., Luo, J., Shen, Z., Yang, K., 2015. High-resolution mapping of urban surface water using ZY-3 multi-spectral imagery. Remote Sens. 7,
12336–12355.https://doi.org/10.3390/rs70912336.
Zhang, N., Zhou, K., 2017. Identification of hydrothermal alteration zones of the Baogutu porphyry copper deposits in northwest China using ASTER data. J. Appl. Remote. Sens. 11, 015016.https://doi.org/10.1117/1.JRS.11.015016.
Zhang, X., Pazner, M., Duke, N., 2007. Lithologic and mineral information extraction for gold exploration using ASTER data in the south Chocolate Mountains (California). ISPRS J. Photogramm. Remote Sens. 62, 271–282.https://doi.org/10.1016/j. isprsjprs.2007.04.004.
Zhou, Y., Luo, J., Shen, Z., Hu, X., Yang, H., 2014. Multiscale water body extraction in urban environments from satellite images. IEEE J. Select. Top. Appl. Earth Observ. Remote Sens. 7, 4301–4312.https://doi.org/10.1109/JSTARS.2014.2360436.