Demand Forecast for Short Life Cycle Products: Zara Case Study
byTatiana Bonnefoi
B.S. Mechanical Engineering, ITESM, Mexico City, 2005
Submitted to the MIT Sloan School of Management and the MIT School of Engineering in Partial Fulfillment of the Requirements for the Degrees of
Master of Business Administration and
Master of Science in Mechanical Engineering
In conjunction with the Leaders for Global Operations Program at the Massachusetts Institute of Technology
June 2012
© 2012 Tatiana Bonnefoi. All rights reserved
ARCHIVES
MASSACHUSETTS INSTITUTE OF TECHNOLOGY
JUN
28
2012
LIBRARIES
The author hereby grants to MIT permission to reproduce and to
distribute publicly paper and electronic copies of this thesis document in whole or in part in any medium now known or hereafter created.
Signature of Author Certified by Certified by Certified by Accepted by May 11, 2012 MIT School of Engineering, MIT Sloan School of Management
David Simchi-Levi, Thesis Supervisor Professor of Engineering Systems Division and Department of Civil & Environmental
Stephen C. Graves Thesis Supervisor Prof sso of Management cience, Mechanical Engineering & Engineering Systems
/
Warren Seering, Thesis ReaderPxofespee4$)echanigkEngineering and Engineering Systems
"DaVi'd E. Hardt, Chair of Department Committee on Graduate Students Professor of Mechanical Engineering Accepted by
Maura M. Herson, Director of MBA Program MIT Sloan School of Management
Demand Forecast for Short Life Cycle Products: Zara Case Study
byTatiana Bonnefoi
Submitted to the MIT Sloan School of Management and the MIT School of Engineering on May 11, 2012 Fulfillment of the Requirements for the Degrees of
Master of Business Administration and Master of Science in Mechanical Engineering
Abstract
The problem of optimally purchasing new products is common to many companies and industries. This thesis describes how this challenge was addressed at Zara, a leading retailer in the "fast fashion"
industry. This thesis discusses the development of a methodology to optimize the purchasing process for seasonal, short life-cycle articles. The methodology includes a process to develop a point forecast of demand of new articles, the top-down forecast at the color and size level and an optimization module to produce recommendations to define the optimal quantity to purchase and the optimal origin to source
from.
This thesis is the first phase of a two phases purchasing optimization process. The focus of this thesis is: a) the outline of an enhanced purchasing methodology b) the development of the most important input in the system: a point forecast of demand at the article, color, and size level, and c) the development of an IT prototype to automatically manage the purchasing methodology. The second phase of the purchasing optimization process focuses on the optimization module. The optimization module is beyond the reach of this thesis.
Thesis Supervisor: Jr6mie Gallien
Associate Professor of Management Science and Operations London Business School
Thesis Supervisor: Stephen C. Graves
Professor of Management Science, Mechanical Engineering & Engineering Systems, MIT Thesis Supervisor: David Simchi-Levi
Table of Contents
Abstract ...---..--- -- -. ---... 3 Table of Contents...- -... ---... 5 List of Equations...7 List of Figures...8 1. O verview ... 13 1.1 Project overview ... 131.2 Com pany Overview ... 13
1.2 Zara Overview ... 16
1.3 Chapter Sum m ary...22
2. Project O verview ... 22
2.1 Project Background ... 23
2.2 Problem Statem ent and Project Objectives ... 25
2.3 Thesis organization ... 26
2.4 Literature review ... 27
3. The current buying process ... 28
3.1 Current State...28
3.2 Chapter sum m ary...34
4. Im proving the purchasing m ethodology ... 34
4.1 Room for im provem ent...34
4.2 Proposed standard methodology: Point forecast to estimate demand...38
4.3 Proposed standard m ethodology: Inputs... 4 8 4.4 Top-Dow n forecast...56
4.4.2 Size Top-Dow n forecast ...--... ---... 58
4.5 Chapter Sum m ary...---.--..- .. ---...60
5. Architectural design of a tool to automate the proposed purchasing methodology...60
5.1 Purchasing tool prototype: The selling season ... 61
5.2 Purchasing tool prototype: The article ... 63
5.3 Purchasing tool prototype: The category...73
5.4 Chapter Sum m ary...--. . ---... 76
6. Conclusions ...---...-- - - - 77
7. Bibliography...-. -.- -- - -- -- - -- - ...-- - 79
8. Appendix ...-.--..-.---... 80
8.1 Appendix 1: Stores clustering algorithm...80
List of Equations
Equation 1: Days not displaying a reference due to out-of-stock in a store... 43
Equation 2: Weekly selling potential for a given article in a given store ... 44
Equation 3: Weekly demand for a given article in a given store... 44
Equation 4: Deseasonalizing the demand dataset... 45
Equation 5: Store's contribution to the cluster... 46
Equation 6: Estimated deseasonalized demand of a store that did not receive a historical reference.... 46
Equation 7: Estimated demand for a cluster... 46
Equation 8: Seasonalized demand for a new article... 48
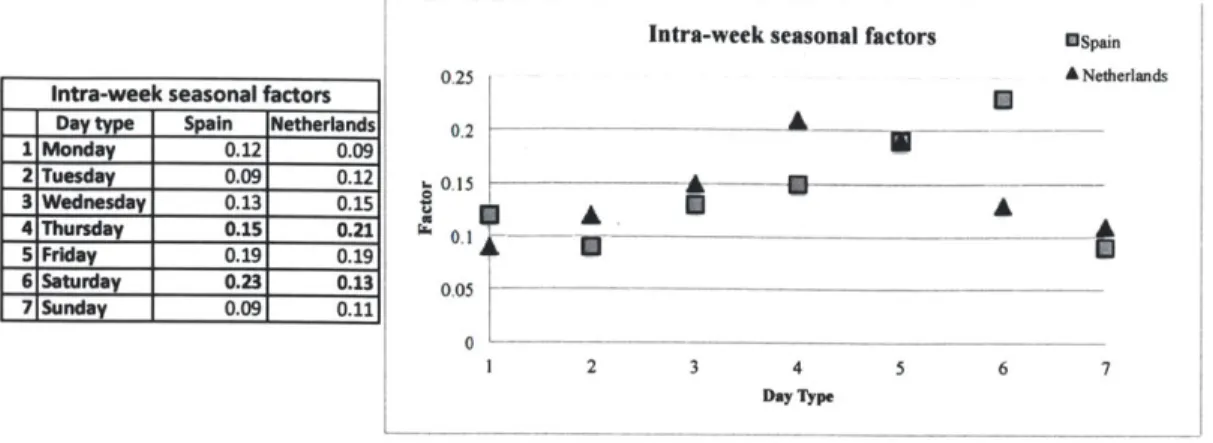
Equation 9: Intra-week seasonal factors... 50
Equation 10: Inter-week seasonal factors per year, per subfamily and per country... 53
Equation 11: Color Confidence for an article per store type... 58
Equation 12: Out-of-stock days for a particular size... 59
Equation 13: Selling potential of a particular size... 59
Equation 14: Weekly demand for a particular size in a given store... 59
List of Figures
Figure 1: The role of a buyer in the organization... 19
Figure 2: In-season selling loop ... 21
Figure 3: Selling and buying cycles ... 21
Figure 4: Purchasing Department Initial Purchasing Process Map ... 34
Figure 9: Purchasing Optimization Process ... 39
Figure 10: Proposed standard methodology: Initial purchasing quantity process map... 40
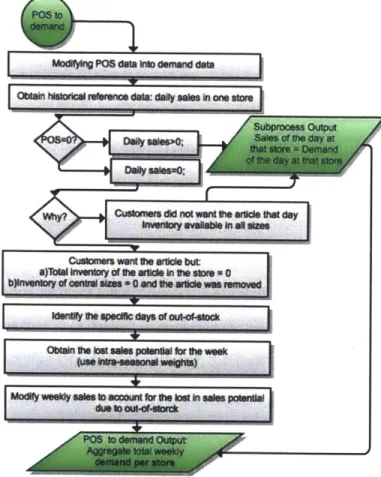
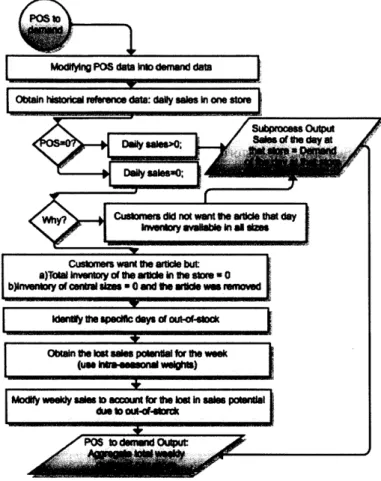
Figure 11: Proposed standard methodology: Converting POS data into demand data process map ... 41
Figure 12: Example of two countries' intra-week seasonality factors using 2010 data ... 51
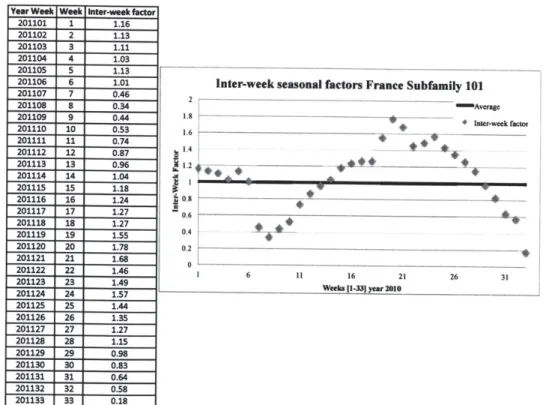
Figure 13: Example of inter- seasonal factors for France using 2010 data... 53
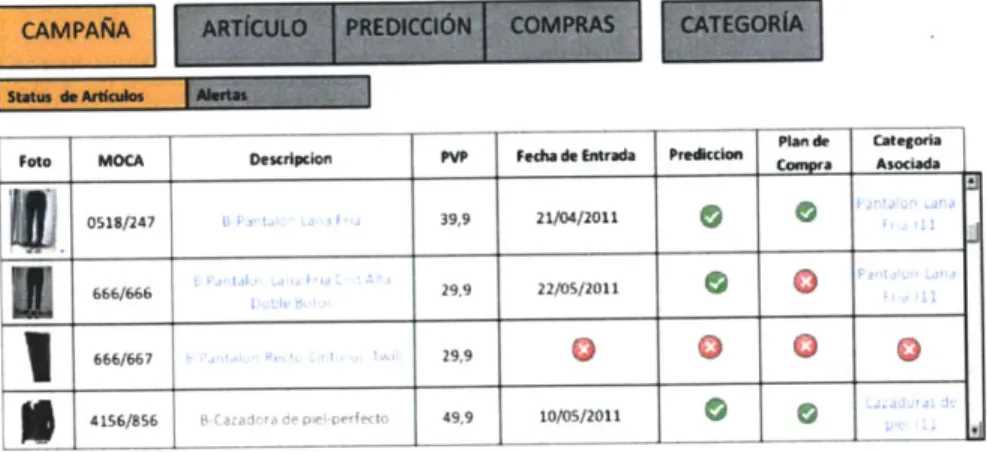
Figure 14: Purchasing tool prototype. Status of the articles offered in the season ... 62
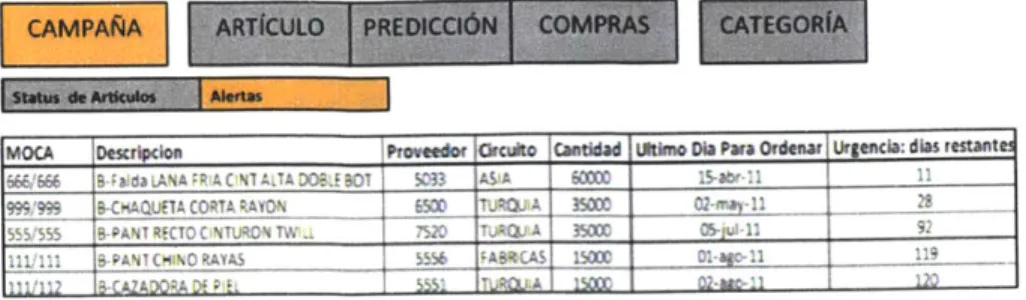
Figure 15: Purchasing tool prototype: Season alerts ... 63
Figure 16: Purchasing tool prototype: Defining a new article ... 64
Figure 17: Purchasing tool prototype: Historical reference ... 65
Figure 18: Purchasing tool prototype: Deseasonalized demand of historical reference ... 66
Figure 19: Purchasing tool prototype: Stores and colors ... 67
Figure 20: Purchasing tool prototype: Sizes partition Generic curve... 68
Figure 21: Purchasing tool prototype: Sizes partition Mirror Curve... 69
Figure 22: Purchasing tool prototype: Selling capacity ... 70
Figure 23: Purchasing tool prototype: Suppliers... 71
Figure 24: Purchasing tool prototype: Exposition stock ... 72
Figure 25: Purchasing tool prototype: Purchasing plan ... 73
Figure 26: Purchasing tool prototype: Defining a category ... 74
Figure 27: Purchasing tool prototype: Expected growth prediction for a category ... 75
List of Tables
Acknowledgements
I would like to thank Zara (Inditex SA Corporation) and the Leaders for Global Operations program at MIT for the opportunity to spend six months working in the fashion industry. I would also like to thank Zara for allowing me to work on a process so critical to their organization and for giving me all the support I needed to be successful.
The work presented in this thesis was made possible by the tireless efforts of the Zara Purchasing and Information Technology staff and the support of my advisors, Jeremie Gallien, Adam Mersereau,
Stephen C. Graves and David Simchi-Levi.
Within Zara I would like particularly like to thank Miguel Diaz and Francisco Babio, the buyers, country managers, controllers, and IT staff without their help understanding the underlying business, the project would not have occurred.
Finally, I would like to thank my family Marco, Lourdes, and Catalina for their endless support and encouragement in following my dreams.
1. Overview
1.1 Project overview
The operation strategy of the companies in the retail industry is delimited by their availability in maintaining the flow of raw materials and finished goods in their supply chains. The continuous operation in the retail sector also depends on the companies' ability to deliver the correct set of products, in the correct place, at the correct time to improve the sales performance in the stores. Therefore, developing and improving the companies' sales forecasting techniques is important in the retail sector. To this end, researchers have developed increasingly sophisticated forecasting techniques, believed to more accurately model the complexities of marketplace conditions'.
This thesis is based on an internship conducted at Zara, the flagship brand of Inditex SA Corporation (2010). The main purpose of this thesis is to propose a standardized improved purchasing methodology that combines the art of buying with the science of sales forecasting. This enhanced methodology is accompanied by a set of tools that facilitates the decision making process in the purchasing
departments. Previous research have consistently show that qualitative forecasting practice (art) are more widely used than quantitative forecasting techniques (science), even though there is an extensive research supporting the superiority of the quantitative forecasting methods in most situations
(Dalrymple, 1987; McCarthy et al., 2006; Mentzer & Cox, 1984;Mentzer & Kahn, 1994; Sparkes & McHugh, 1984; Davis & Mentzer, 2007) they proposed a hybrid purchasing methodology that combines the best of the qualitative and quantitative forecast.
1.2 Company Overview
Inditex SA Corporation, a Spanish company based near the port of La Corufia, Spain, is the world's largest fashion retailer. It has eight store brand names: Zara, Pull & Bear, Massimo Dutti, Bershka, Stradivarius, Oysho, Zara Home, and Uterque. With operations in 82 countries, it has 5,527 stores and more than 92,000 employees. Inditex SA's unique management model, based on innovation and
flexibility, and its vision of fashion, based on creativity and quality designs, together with the capacity to react quickly to market demands, have enabled it to enjoy rapid international expansion and an
outstanding reaction to its various commercial concepts.
In May 2001, Inditex turned into a publicly traded company, valued at $8 billion (69 billion at the time)2. When the public offer occurred, the company made a major effort to make itself known to investors, explaining its structure, its business model, and its organization. The investors showed their confidence by participating in a public share offering that prompted very high levels of
oversubscription.
The fashion retail industry is a volatile environment in which globalization, customization, and speed are the key drivers for success. Within today's financial environment, traditional companies' valuation practices have evolved to more sophisticated and data-driven conventions. In the past, including the operational data, such as inventory data, to valuate a company was not a common practice3. However,
investors today consider that the earnings per share movements in retail companies are strongly correlated with their operations and supply chain performance.
A main goal of this thesis is to standardize the purchasing process in all the sourcing departments of the company, with the future intention of optimizing the overall stocking level of the company. The current situation of the inventory levels at Inditex SA can be summarized as follows: the inventory turnover of the company in 2010 was 4.2 times a year, a 14% decrease compared to 2009; also in 2010 the obtained markups were 145%, an increase of 8% compared to 2009. The inventory turnover and markups combined reflect that the company made more profits per sale on average. The inventory turnover metric can be used as a performance reference of a retailer, as shown in "An Econometric
2 ("Inside Zara," Forbes Global)
3 Fishers and Raman. The New Science of Retailing: How Analytics are Transforming the Supply Chain and Improving Performance. (2010)
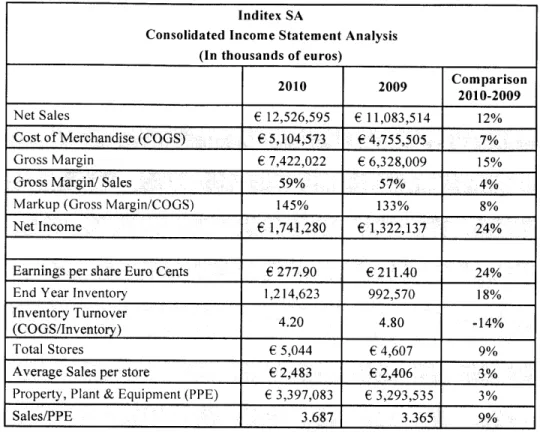
Table 1: 2009-2010 Inditex Group Income Statement Analysis4
Inditex SA
Consolidated Income Statement Analysis (In thousands of euros)
2010 2009 Comparison
2010-2009
Net Sales 6 12,526,595 E 11,083,514 12%
Cost of Merchandise (COGS) C 5,104,573 6 4,755,505 7%
Gross Margin e7,422,022 6 6,328,009 15%
Gross Margin! Sales 59% 57% 4%
Markup (Gross Margin/COGS) 145% 133% 8%
Net Income 6 1,741,280 6 1,322,137 24%
Earnings per share Euro Cents 6 277.90 6 211.40 24%
End Year Inventory 1,214,623 992,570 18%
Inventory Turnover 4.20 4.80 -14%
(COGS/Inventory)
Total Stores 6 5,044 6 4,607 9%
Average Sales per store 6 2,483 6 2,406 3%
Property, Plant & Equipment (PPE) 6 3,397,083 6 3,293,535 3%
Sales/PPE 3.687 3,365 9%
Table I summarizes the most important financial figures from the Inditex SA income statement. From a financial perspective", Inditex SA is clearly a growing and healthy company. A 12% increase in operating revenue has combined with an extraordinary net income performance increase of 24% compared to 2009. All of these growth ratios show the financial stability of the company. One ratio that measures the operative performance of the purchasing group is the profit margin, in 2009 it was required 42% of the profits to cover the COGS, in 2010 the requirement was reduced to 40%. However, a company growing at an accelerated pace faces several operative challenges. The main operative challenges that Inditex SA is experiencing are the following: maintaining a good relationship with suppliers; creating supply chain processes with adequate inventory controls; staying current with
IT technology and document policies; sharing best practices and procedures; and, finally, sustaining the same customer focus while growing the staff inorganically'.
1.2 Zara Overview
The Inditex SA Group is made up of more than 100 companies operating in textile design, manufacturing and distribution. Zara is the best-known brand of the group and the flagship of the company; it represents 70% of the total sales of the company and it has operations in 82 countries, with a network of more than 1,600 stores, mostly owned and operated by the group.
Their latest addition, the new store in downtown Sydney, opened in 2011, breaking the E40M record on the opening night and giving Zara exposure for the first time in Oceania. Until 2010 the only selling channel for Zara was at the retail outlets located on five continents: America, Europe, Asia, Africa and now Oceania. In September 2010, it opened up to online retail; this format is only offered in selected countries, based on the Internet penetration and distribution capabilities, and e-commerce operations in China started in September 2011. In the near future, the online business will become one of the main
retailing channels for the company.6
The core business strategy of Zara is: "Cutting-edge Fashion at Affordable Prices,"7 and their main operation strategy is a combination of Just-in-time manufacturing and a highly vertically integrated structure. The planning cycle for Zara, as for many other fashion retailers, starts a year in advance of the corresponding season. Zara's designing team is formed by 250 designers8, each one of them will create over a 100 designs a year, just half of them will make it to Zara's windows, and just a few designs will become top sellers. Designing appealing garments is just one side of the successful
5 (Fast Growing Companies - Challenges and Solutions, Steve Y. Lehrer, 2011)
6 (http://www.inditex.com/en/whowe are/timeline)
7 (The Fast-Fashion Business Model: An Overview Based on the Zara Case, F. Caro, 2008) 8 (Zara, Case Study. K. Ferdows, M. Lewis, and J.A.D. Machuca, 2003)
business model of Zara; after preparation of the final assortment that will fill the shelves of the store in the next season, the tangible operation of creating more than 14,000 articles a year will take place.
To offer cutting-edge products at affordable prices, Zara follows a "fast fashion" philosophy. That entails, a combination of two factors: first, a short production and distribution lead-times and second, a highly fashionable product design9. In addition, the firm exerts a strong control over almost all the supply chain: design, purchasing, production, distribution, and retailing.
As companies struggle to increase customer value by improving performance, many companies are turning attention to purchasing and supply management. Getting the materials and inputs services from suppliers has a major impact on companies' ability to met customers needs'4. Purchasing is one of the main cost-savings activities in the entire supply management. The ratio COGS (5.105B E) to Net Sales (12.527B E) for Zara was 40% in 2010". That is, for every Euro collected from the sales operations, forty cents go back to the suppliers. Thus, the amount of time and effort that the buyer (person in charge of the purchasing, procuring, and sourcing activities in Zara) spends bargaining over a better deal or building a stronger relation with the suppliers, impacts directly the profitability of the company.
The sourcing strategy at Zara can be subdivided into four different types. The first type is the
procurement qffabrics. This type of procurement refers to the purchase of large volume of fabrics that
are constantly used in the company. These fabrics, are commodities and their market prices commove with the oil price i.e. cotton, cold wool. The commitments for these textiles are made roughly 6-8 months prior to the delivery in stores, and they can be carried as inventory if a strong movement in price is expected. This type of sourcing strategy gives Zara a relevant economy of scales edge. In addition, by having available raw material in their inventories their production time is shorter.
9 (The Value of Fast Fashion: Quick Response, Enhanced Design and Strategic Consumer Behavior, G.P. Cachon and R. Swinney, 2010)
The second sourcing strategy is in house manufacturing. The 35% of Zara's total production is done in the Inditex owned factories, located next to the company's headquarters. Once a design is completed, the garment's patterns cut on site. Then, all the sewing is subcontracted to a network of 400 smaller firms in the surrounding areas of Galicia. Finally, the pieces of cloth are returned to the Inditex factories to be quality-inspected and prepared for shipment. This is the most efficient sourcing method of all, from start to finish the process can take one or two weeks, assuming there is enough fabric in stock, and there are available resources at the sewing contractors. The final quality of the products is very high; the most complicated designs are done in house. Thus, this sourcing method is the most expensive of all. 12
The third sourcing strategy is the proximity sourcing. Between 40-55% of the total production is sourced using the proximity strategy. Most commonly Zara procures the fabric and gives the design specifications and the sewing patterns. A closely monitored third party subcontractor cuts, sews finalizes the assembly, and the inbound transportation of the clothes. The proximity subcontractors are primarily located in Portugal, Turkey and Spain. This type of sourcing strategy will take from start to delivery four to six weeks".
The fourth sourcing strategy is called long circuit. It is a fully subcontracted operation, Zara provides the design and quality inspection, but the third party provides the fabric, patterning, sewing, and inbound transportation of the final assembly of the product. This strategy is used for high volume low fashion design articles i.e. knitwear cardigans. The subcontractors are located in Asia (China, India and Vietnam). The delivery of the final product can take up to 12 weeks and the cost per unit that can be negotiated is the lowest of all sourcing types.
The four sourcing strategies are owned and highly monitored by the different purchasing groups in the company. The first sourcing strategy looks for the most important raw material in the system, the
12(N. Fraiman, M.Singh, and C. Paris. Zara Case. Columbia Business School, 2002) (N. Fraiman, M.Singh, and C. Paris. Zara Case. Columbia Business School, 2002)
textile. This sourcing type can be combined with the other three strategies. The responsible for the fabrics sourcing are specialized textile buyers that are constantly looking for good quality/price deals. The remaining three sourcing strategies are methods to acquire final goods. The buyers make the
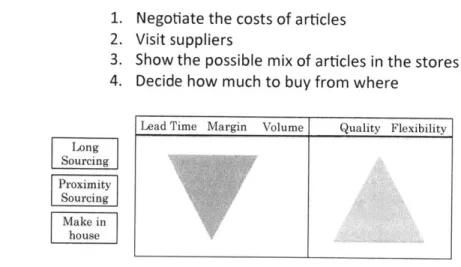
decision of making in house (second sourcing strategy) or outsource from suppliers (third and fourth sourcing strategies). The decision is based on four criteria, ranked in order of importance: production speed, supplier experience (quality of the final product), cost-efficiency and available capacity. Depending on the product mix in the different groups, and the final products available in the stores the buyers will strategically place the final goods orders. That is, buyers will decide to make in house those designs that requires special care or that they need to be deliver into the stores very fast. But they will select to outsource the easy design and high volume products that can bring cost reductions through economies of scales. Figure
I shows the main activities develop in the buyer's role. The figure
also illustrates the trade offs between the different final goods' sourcing origins.1. Negotiate the costs of articles
2. Visit suppliers
3. Show the possible mix of articles in the stores
4. Decide how much to buy from where
Long Sourcing Proximity Sourcing Make in house
Figure 1: The role of a buyer in the organization
Zara is subdivided into three operative departments: "Children" (12% of the total sales), "Men" (15% of the total sales) and "Women" (73% of the total sales). After the products are manufactured, all the
items are inbound transported and stored in one of the two Zara's Distribution Centers (DCs) (La
Coruna Spain and Zaragoza Spain). The inbound transportation methods are three: truck, air or ship. If the sourcing strategy selected by the buyer is making in house, the required inbound transportation method is truck, and the products are same-day-deliver from the local sewing subcontractors to Inditex own factories. If the buyer selected proximity sourcing method, there are two options truck or
airfreight. The recommended transportation method for this sourcing origin is truck. The products that are delivered from Portugal take approximately one week to be delivered. If the product origin is Turkey or Morocco, the journey can take between two to three weeks. Finally, if the sourcing type is long circuit the two options are ship freight and airfreight. The suggested transportation method is ship and it will take between six and eight weeks. These differences in time are key in understanding the differences in Zara's product mix; high fashion items are mostly sourced from proximate suppliers or they will be produced in-house, whereas basic items (with a simple design, easy to manufacture patter and low fashion trendiness), such as a white T-shirt, will most likely come from Asia. Once the items are at the DCs, the manner through which the references get to the stores is the same regardless of where they are sourced from; references are sorted by store at the DCs and trucked to European stores shipped or air freighted to the rest of the world.'4
Zara commits only a portion of its season inventory months in advance. . Once the selling season starts, the total budget is split between different sourcing origins. The rest is in season production. 16
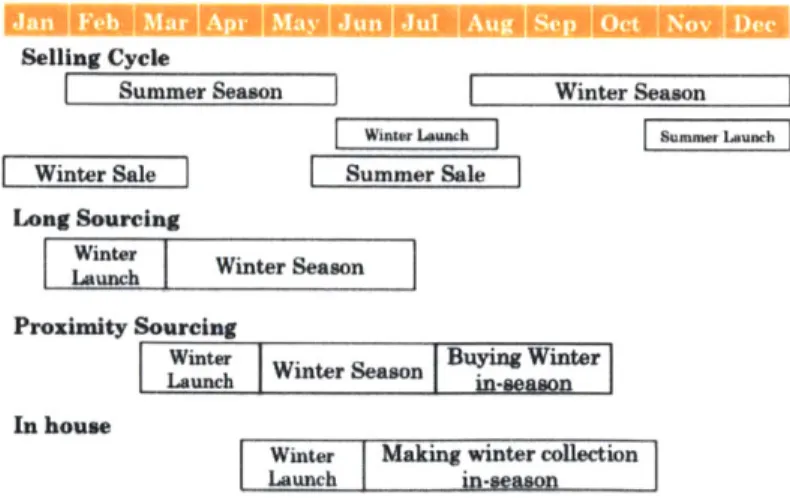
Most of this reminder will be produced in house, just after the ramping up collection in the stores. Figure 2 schematizes the ongoing business cycle that Zara faces after observing the customers' reactions to the first products of the collection. Figure 3 shows how the two most important business
cycles in the company, buying and selling are related. Zara is an organization highly driven by sales performance. The in-season production is the most flexible asset of the company, and it allows the
(Myraida Vega, 2005)
(N. Fraiman, M.Singh, and C. Paris. Zara Case. Columbia Business School, 2002) (N. Fraiman, M.Singh, and C. Paris. Zara Case. Columbia Business School, 2002)
modify the assortment according to the market demand, and they will contain the profit loss of articles that might be not as successful as others; i.e., if a long sleeve T-shirt is not selling well during the summer, they might not distribute to the rest of the world until the next season. On the other hand, if a product shows a strong demand, the sourcing departments will be triggered to look for more volume of
that reference, adjusting ad-hoc to stores' necessity. Customer , Voice Store Fashion Experience Trend Supply Design Chain Product Selection
Figure 2: In-season selling loop
Selling Cycle
Summer Season Winter Season
WinterLaunchSummer Launch
Winter Sale Summer Sale
Long Sourcing
inh Winter Season Proximity Sourcing
Winter Winter Season Buying Winter
Launch i-Be
In house
Winter Making winter collection Launch
Figure 3: Selling and buying cycles
The "Projects Team" led the project on which this thesis is based; this group serves as the systems integrator in the organization. The team is closely related to the three most important functional areas
in the company: operations top management (logistics and budgeting decision planning), product management (buying, assortment, and overall store performance planning), and IT systems. This project is part of a continuous improvement group of projects; the end result will be incorporated into a platform that will record the historical performance of all transactions of the purchasing department.
1.3 Chapter Summary
Inditex SA is one of the lead fashion retailers in the world. Zara, the flagship of the company, accounts for the majority of the success of the group. In the past 10 years the successful implementation of their policy of "Cutting-edge Fashion at Affordable Prices" has penetrated into many geographical regions of the world. The company is growing at an accelerated pace, and one of the biggest challenges is to keep filling the stores with the right products at the right time. The buying teams in the company are responsible for deciding where to buy, how much to buy and when to buy. The main objective of the buying groups is to maximize the limited resources: time, production capacity and budget to satisfying their customers' demands to maximize profits.
2. Project Overview
The focus of this thesis is to define a standardized purchasing methodology for retail short life-cycle articles i.e., fashion cloths. In addition, this thesis defines a process to obtain a point forecast of demand; this forecast is the main input to generate the optimal decision on how much to buy. The point forecast of demand uses historical sales data as baseline information as baseline information. The historical sales are converted into demand data by extracting out of stocks and other supply chain inefficiencies. In addition, the demand data is modified to better represent the market conditions at the moment of the purchase. Finally, this thesis proposes the system architecture to automate the
2.1 Project Background
The cumulative volume sourced and purchased of a clothing item is the bloodstream of Zara, and when Zara started operations the owner itself made the three fundamental decisions: how much to buy, where to source from and when to buy. However, as Zara matured it was impossible for one person to make all the decisions by himself, pushing the organization to create a central purchasing/sourcing department. At the time when Zara served only stores in Spain, the Inditex owed factories produced all the references, and the purchasing group was devoted to sourcing only fabrics and raw material. As Zara gradually evolved into the global retailer that is today, the use of different sourcing origins arose as a cost-reduction strategy, and now an organization of twenty buyers and eight product managers is responsible for all the sourcing activities and suppliers' evaluation to ensure the smooth flow of items to the final customer.'9 The product managers serve as the systems integrators in the company, they are responsible to work with the designers and country managers in selecting the best assortment of products to be launched in the stores, but they are also responsible for trigger the purchasing activities, right after completing the products selections the product manager will coordinate with the buyers to
start the sourcing activities. In addition to the increasing headcount in the buying departments, the number of suppliers and sourcing origins has increased rapidly, and the international agreements and the specific normative specifics between suppliers and the company have evolved into very complex contracts that require legal assistance and careful thought to ensure the continuous flow of materials around the world.2 0
The global reach of Zara's has increased the company's complexity; however, in essence the main job of a buyer is the same as 25 years ago, when it was one person's responsibility. They analyze the features and specifications of the product to be buy, based on the attributes of the article the buyer select the appropriate supplier, to establish the quantity to purchase, and--more important--to bargain the cost and the terms of the delivery of the final product.
The data used in this project come from the Zara "Woman" Section; this section is subdivided into 5 different sourcing groups, and each group faces different challenges.
The different groups develop and sell different products. The most representative classification of articles can be bracketed into four main dimensions: fashion trendiness, sourcing origin, launching date, and customer target. This categorization allows the buyers to estimate the purchase quantity required to fulfill the requirements of the different purchasing departments. The different
categorization of articles combined with the intrinsic characteristics of each purchasing department, creates divers purchasing options for the buyers. The buyers analyze the available sourcing options and, the intrinsic characteristics of the products to be acquired, to make rough estimates of the volumes required in each category. Associating a product with a combination of categories help the buyer estimates the potential acceptance and life of the product in the market, this two characteristics are important when defining the quantity to buy.
The estimation of the acceptance and expected life of the product is done by associating the new article with a historical article that belonged to the same set of categories. The number of combinations that
can be extracted from the different classifications is vast, and each one results in a different bargaining strategy. However, some of the combinations are impossible to execute. That is, to produce in-season an article that targets fashionistas, cannot be produced at China, the article would be delivered to the stores with a delay that the fashionistas is not willing to wait and this can lead to customer
dissatisfactions and in the long term to a bad brand perception. The operation of buying at Zara directly affects the bottom line of the organization, and the top management has observed that is impossible for a buyer to remember all the articles offered at Zara. In addition, the buyers are most likely to remember only successful past items. The observations reflect the opportunity to improve the process by creating a corporate tool that will help buyers decide how much to buy and will keep track
of all the historical transactions of the different groups. Now is the perfect opportunity to define a standard purchasing methodology. A well-understood standard procedure can be captured in an automated tool that will relieve the buyers of the no-value-adding activities such as: the use of multiple
The estimation of the acceptance and expected life of the product is done by associating the new article with a historical article that belonged to the same set of categories. The number of combinations that can be extracted from the different classifications is vast, and each one results in a different bargaining strategy. However, some of the combinations are impossible to execute. That is, to produce in-season an article that targets fashionistas, cannot be produced at China, the article would be delivered to the stores with a delay that the fashionistas is not willing to wait and this can lead to customer
dissatisfactions and in the long term to a bad brand perception. The operation of buying at Zara directly affects the bottom line of the organization, and the top management has observed that is impossible for a buyer to remember all the articles offered at Zara. In addition, the buyers are most likely to remember only successful past items. The observations reflect the opportunity to improve the process by creating a corporate tool that will help buyers decide how much to buy and will keep track of all the historical transactions of the different groups. Now is the perfect opportunity to define a standard purchasing methodology. A well-understood standard procedure can be captured in an automated tool that will relieve the buyers of the no-value-adding activities such as: the use of multiple sources of information i.e., the buyers manage several spreadsheets that contains information of articles from different categories; the use of large databases to extract aggregated numbers i.e. obtaining the aggregated demand for each store in a country requires the retrieval of several files from the database, this activity need to be done overnight to avoid overloading the database; Manual adjustments to capture changes in stores i.e., if the buyer knows that a store with large selling potential will be open soon, he or she will manually include that calculation. By eliminating these non-value-added activities the buyers will have more time focus on the negotiation strategy that directly affects the bottom-line of the company.
2.2 Problem Statement and Project Objectives
Each year Zara purchases more than 14,000 articles. For each one of them, the buyers' decision of how much to purchase has a substantial impact on sales, store assortment, and costs.
Although this task is arguably one of the company's most important operational decisions, at present buyers tend to use relatively informal guidelines for making decisions. This project looks for a more consistent, explicit, and optimum manner in which to decide on purchase volumes.
Given the rapid and inorganic growth of Zara's purchasing departments, it is necessary to capture the essential steps and sequence of the purchasing process in a standardized process. Identify a standard buying process across the organization will facilitate the communication about how the buying process operates. In addition, this standardization will help reduce the variations in the process. And once all the stakeholders in the process understand the steps and the sequence of the process, they can identify the non-value-adding activities and inefficiencies in the process, and contribute to continuously improve the buying process.20
This thesis discusses the results of a qualitative analysis of the different purchasing groups dynamics and proposes a standardized purchasing methodology. The decision-making process at the different purchasing groups at Zara is heterogeneous. That is, the identification, development and selection of alternatives made by the buyer are different across the purchasing departments.2' The main reasons for
these differences are: the seniority of the group of buyer, the complexity and variability inherent to each purchasing group, the set of tools available for each group, the buyers background diversity and the different accessed permissions to top-level information
Having a standardized methodology and a good understanding of the purchasing process can positively impact the following areas:
* Identify, document, and spread best purchasing decision-making practices
- Use IT to relieve buyers of time-consuming and variable manual or spreadsheet-based analysis - Leverage IT and computing power to perform new analyses, leading to better purchasing
decisions
* Help buyers identify and focus their time on the most time-sensitive and difficult decisions
20 (T. H. Davenport. The Benefits of Business Process Standards, 2005)
2 1
work. Chapter 4 opens with the potential areas of improvement required to standardize and automate the process, followed by a description of the proposed new system architecture for the purchasing process. Chapter 5 explains the prototype architecture of a corporate tool that will automate the purchasing process. Chapter 6. Wrap up the thesis with a summary of the purchasing methodology and the conclusion.
2.4 Literature review
Numerous studies analyze and describe the optimization of different process in the retail industry. In the specific space of demand forecast in the fast fashion retail industry some authors have analyze and document their results. Namely Caro and Gallien (2007) studied the problem of optimizing the products assortment of a store as the season progress and more information is available, in this paper they propose a quantitative model to forecast demand reflecting the real situation at the market place. Garro (2011) studied how to forecast demand of new products to optimize the distribution of the assortment in the stores; he proposes a point forecast currently use at Zara's distribution and logistic department. In this document Garro also defines a clustering methodology to group stores, relevant for
forecasting demand with incomplete information. Vega Gonzalez (2009) proposes an inventory management optimization model; she is proposing a prototype tool to be used at the distribution
centers in Zara after the purchasing quantity has been defined by the purchasing teams. Fishers and Raman (2010) in the book The New Science of Retailing: How Analytics are Transforming the Supply Chain and Improving Performance document and exemplify how simple analytic methods can improve the retail operations and have a major impact in the profitability of the companies. Caro and Gallien (2010) quantitatively analyze the inventory behavior of apparel short-lifecycle products including the broken assortment inventory policies at Zara. The focus of this thesis is to propose a standardized purchasing methodology for short-lifecycle and seasonal products. The main input for this
to improve the profitability of a fast fashion company (the optimal purchasing quantity and the profitability assessment are beyond the scope of this study).
3. The current buying process
The first step of this project is to conduct a series of interviews with the buyers from the different purchasing departments. The main objective is to understand the steps, sequence, inputs and outputs of the purchasing process utilized at the different departments. At first glance, each of the departments' processes seemed to have an independent strategy. However, the desired outcome of the process was the same for the groups. The interviews were designed to highlight the similarities and differences among the groups to extract the underling methodology and the particularities for each group.
3.1 Current State
The first question asked to the interviewees was: what is the objective of your work? This question aimed to interpret the desired output of the purchasing process. What are the main deliverables, to whom do they go, and how is the process to be evaluated as successful?24
All the buying departments agreed that there are two main output of the purchasing process. The first and most important output of the system is the order quantity
Q.
This output answers the basic question of how much to buy of a given article; that is, the estimated quantity that they will need to source to cover the existing demand for the article in the stores. The estimated quantity to order of a given article is the number that the buyer will bring to the negotiation table with the supplier; it is the lever of their bargaining position. In addition, knowing the quantity to order will help the buyers decide the required capacity, the amount of fabric and raw materials that they will need to source, and, most important, the percentage of their budget that will be invested in article. They understand the costof sourcing as an opportunity cost; once they have used a portion of the budget and the capacity, those resources cannot be use for producing other articles.
The total quantity to order will be passed to suppliers using disaggregated specifications. Therefore, the two secondary outputs of the system are the following:
* Estimate the disaggregated quantity per color. Once the capacity requirements are met, the
buyers will need to give the supplier detailed specifications of the batch to be produced. Often, the lot to be produced requires dying the same pattern in different colors or tones. For some fabrics this operation can be performed at the end of the manufacturing process, but for many others the dying process needs to be done before cutting the fabric. The buyers are responsible to define the amount of units to order in each color.
* Estimate the disaggregated quantity per size. Just as with the color disaggregation, specifying a
production batch requires breaking down the quantities required in each size. This disaggregation is a two-part output. First it is necessary to decide how many sizes will be offered. Depending on the cutting pattern, expected fit and targeted market, the number of offered sizes can vary from only one up to seven different sizes. The second part is to decide the exact amount required for each size.
The second output of the purchasing process is to define the optimal sourcing strategy; the buyers need to decide where to buy. The available capacity, the scalability, and the sewing skills of the different
suppliers are not constant in time. As a company resource says, "The production capacity of good suppliers is one of the most scarce resources in the world,"2 so it is necessary to book suppliers' capacity at least 6 months in advance. Therefore, having a good estimate of the required capacity will provide the buyer with more information to make the optimal selection of suppliers. A buyer is always hunting for new factories and suppliers that can accommodate their increasing requirements at
affordable prices.
Generating the two principal outputs discussed above requires integrating different pieces of information. The inputs required in the process can be classified into three major groups: historical information, store conditions, and intrinsic characteristics of the new article.
Critical Inputs:
Historical information refers to information from previous seasons that can indicate the potential future performance of a new article in the store.
A comparable reference. This is an item that was sold previously at the Zara stores, for which
the historical performance is known and the past sales data are available in Zara's database. The comparable item is similar to the new article, and each group has a different range of attributes that make an item similar to another; however, in essence all the groups will use this information as the baseline sales prediction.
Store Conditions: relevant information about the store that can modify the required quantity.
e The Network. When deciding how much to buy, the buyers will consider the stores in the
network that will receive the new reference. Given the characteristics of the articles (retail price, fabric, style), part of the assortment is not suitable for Zara's entire network; this input
drastically changes the limits of the purchasing ranges.
* Display in the stores. The merchandizing specifications of a reference are important when
deciding how much to buy. There are two main options: first, a reference located on the walls of the store (usually these articles will be hung and the space is limited) and second, a reference located on tables, (tables can fit a large amount of stock). To provide an attractive display in the store, the stores need a minimum exposition stock (inventory that will allow them to initially display the article, a minimum of one per size per color). This information will give the buyer a volumetric idea of how much space in the store a given reference needs to cover. Some characteristics of the article can influence the order quantity. This list can be extensive but the most influential characteristics for the quantity to be order are three:
- Expected life of the item. The estimated life of a reference can vary depending on the
introduction point in the season, i.e., a reference designed to be featured only at the ramp-up of the season will require less quantity than one intended for the entire length of the season. Some references are considered essentials, and buyers will want them to be in stores for more than
one period; therefore the initial quantity will increase.
e Reorder point option. Along with the introduction point, some of the references will have the
option of being reordered. If this is the case, buyers will tend to buy the minimum quantity to see the performance in the store and then decide if a second ordering point is necessary. - Trendiness. If an article contains an attribute that follows the new trend, this can increase its
demand, so this input needs to be taken into account when deciding the optimal purchase quantity. This is a subjective multiplier that the buyers will apply if they consider the product to be more desired than the rest.
Figure 4 describes the steps follow by buyer from the buying department to decide how much to buy of an article that will be part of new collection. After deciding that an article is going to be bought, the buyer will identify the specific characteristics of the design and amount of time needed for production.
Continuing with the purchasing process, the next step is to select a comparable: a reference with historical sales information and with similar attributes. At this stage it is difficult to find an article with the specific characteristics of the new model. There are two alternatives. The first is using the average total sales information of a group of articles. The second alternative is to use historical data from a single comparable reference. If the buyer selects a comparable, the total quantity sold total quantity purchase for the new article, ignoring the exposition stock required to fill the stores (potential new openings) and also ignoring that sales of the comparable reference represent only the portion of demand that Zara was able to capture; the expected quantity to be purchased for the
The buyers understand that the comparable reference is not always perfect; typically, the buyers will tweak the baseline quantity to account for the variability associated with the network of stores receiving the new article, but they do it without applying a standard quantitative methodology. The first source of variability is the number of stores that will receive the new article. The number of stores receiving the new article compared to the baseline reference can be different. The buyers understand that to fulfill the inventory requirements of the additional stores they need to "bump-up" to the baseline quantity. They also know that the need to order in batches rounded to the thousands. Contrary, if the network of stores receiving the new reference is smaller than the comparable, buyers would not apply any factor.
The next step is to introduce an acceptance factor; the commercial intuition and the consumer understanding of the buyers allows them to sense the expected level of acceptance of a garment, and they bet high or low for the level of acceptance in the article.
To place an order to the suppliers, a buyer must break down the total quantity
Q"
into the color specifics. To make this decision, the buyer will assign a relative weight to each color. Buyers have developed a color categorization trough empirical knowledge. The buyer breaks-down the total quantity to be purchased the first break down is basic higher than non-basic. Then within the group of basic colors the buyer usually assigns equal weights to all the colors.Finally, to select the number of sizes to offer, a "Mirror Curve" will be used. This is a table that indicates the number of sizes offered for a given cutting/volume style and the relative weight for each size. The data comes from a reference with similar fitting characteristics (it is not necessary to have the same expected selling behavior) but it was offered in previous seasons. The "Mirror Curve" is outdated. In the last year Zara's has grown mainly in the emerging markets26. This growth influences the sizing pattern changes by using an outdated reference these changes are not reflected. Similarly to the POS data used to estimate the purchasing quantity at the article level. The size level information by size only reflects the portion of demand that Zara was able to
capture.
Woman Department:
Figure 4: Purchasing Department Initial Purchasing Process Map
Figure 4 shows the general process follow by the different purchasing departments. The different purchasing departments have different necessities that can drive to different specifications in the purchasing process.
3.2 Chapter summary
In the interviews with the purchasing departments, people stated that the two desired outputs of the buying process are the initial quantity to order and, based on this quantity, creating the most appropriate cost and time-efficient sourcing strategy. The inputs of the three mapped processes are similar in essence, but the use of the appropriate historical information combined with the commercial understanding of the customer makes each purchasing process successful and different. The individual purchasing departments at Zara have specific characteristics that make them source final goods and raw material using different methodologies. The different groups have heterogeneous metrics to measure success but all of the departments are focus on final goods availability using the least possible
amount of budget.
4. Improving the purchasing methodology
Analyzing the current state of the different purchasing methodologies leaves room for improvement in the process. This chapter proposes an improved methodology.
4.1 Room for improvement
Section 3.1 explains in detail the different purchasing processes at Zara. Each purchasing department follows its own process and has its own priorities. Besides the heterogeneity in the methodologies, the fundamentals of the purchasing processes can be improved to better reflect the realities of the
1. Forecast demand. None of the three aforementioned purchasing processes involve any explicit
forecasting calculation. The processes systematically use the historical POS data as proxy for demand. That is, the aggregated sales of the comparable reference are used as the point forecast for the new article.
2. Optimal purchasing quantity. There is no evidence in the processes described above that the buyers recognize that the optimal purchasing quantity might be different than the point forecast. The purchasing process occurs in an uncertain environment, the acceptance level of the article in the market, the macroeconomic conditions in the countries, the fashion trend, among others factors can modify the demand level for an article. These uncertain conditions are nowhere recognized in the purchasing process. Likewise, the profitability of an article depends on two factors: the expected revenues and the potential costs. In the process there is no evidence of balance between the costs of
underage and overage costs to select the optimal purchasing quantity.27
3. Convert point ofsales (POS) data into demand data. Zara's POS data is not demand data. The POS data represents the portion of the demand that Zara was able to capture in the selling season. This captured demand differs from the total demand that Zara could have captured. This difference in the aggregate significantly changes the sales potential of an article. Sixty articles sold in the stores were used as data sample set. Table 2 shows the results of this comparison. The total actual amount sold was compared to an estimated sales potential. The estimated sales potential is the amount that an article could have sold if the inventory would have been infinite (Section 4.3 explains the proposed methodology to estimate sales potential). The current methodology estimates the future sales expectations based on the historical POS data, not the demand data, leaving aside a good part of the sales potential. It is necessary to correct the observed sales for the out-of-stock situations and other inefficiencies in the supply chain
4. Table 2: Estimated sales potential with infinite inventory (60 articles sample)
Summary: Relative Error Results 100* [(estimated-actual)/actuall Mean 41% Standard Deviation 35% Maximum 138% Minimum 0% Sample size 60
Summary: Absolute Error Results
Total Sales
[individual pieces of garment] 2,045,339
Total Estimated Sales
[individual pieces of garment] 2,678,870
Lost selling potential [individual units of garment] 633,532
Lost selling potential as percentage of sales 31%
Average price (Euro) C 29.95
Potential Loss in Sales (Euro) C 18,974,275
5. Accountfor growth. In the past 7 years, Zara alone has grown from 1,000 stores to 1,600 stores
around the world. The stores can be classified based on their selling potential into five categories. In descending order they are Top Seller, A, B, C and D. The Top Seller stores built in prime locations around the world. They have a very high rate of sales and they need large amounts of stock to be able to start selling; they close their daily performance summary with weekly sales balances in the tens thousands of Euros and they carry the latest trends of the season, 95 out of the 1,600 stores are considered TOP and they account for the 10% of the total sales. In contrast, D stores are small stores, most of them located in small towns in different countries. They enjoy market power in the shopping malls because they are the only selling option in terms of
fashionable and affordable clothing. The D stores serve a population with a low average income and most likely with a more utilitarian taste. The weekly sales balance in the thousands of Euros; Having these significant differences in stores performance, inventory requirements, and
consumers' tastes makes it necessary to account appropriately for growth when deciding the initial purchasing quantity. In the current use process the buyers account for growth by using the most up-to-date available sales comparable. They claim that using the latest sales data will account for growth in the stores. If they consider the historical sales-comparable is not reflecting the real growth of Zara, they will boost the expected sales by a fix percentage. This method accounts for growth in a suboptimal way; using a fix growth quantity (i.e. 10%) is not reflecting the real selling
potential of the new stores. That is, the selling potential of three D stores is not the same as the selling potential of three Top stores. To account for growth in the company correctly, it is necessary to estimate the selling potential of the sales comparable in the new stores.
6. Selecting the specific network that will receive the article. For many reasons the network of stores
receiving the new article can be different that the comparable reference. Each set of stores has different selling potentials. Using an incorrect selling potential as baseline might result in over or under stock for the new reference. The Woman Collection at the pilot stores has the primarily objective of scouting the performance of the article to identify the trends of the season. Using historical sales data that erroneously indicates sales in all the stores of Zara's network can
introduce error into testing the trend in the piloted stores. After observing the operation, I can state that the "controlled pilot group of stores concept" has evolved into an "all the stores that we can cover" concept. In 2010, 1,428 stores out of 1,600 received at least one article from the Woman Department. Mainly because buyers cannot focus only on the targeted stores, they end-up having excess initial inventory that they send to a larger group of stores. If this new reference is used as baseline for a future reference, the number of stores will be automatically excessive. An automatic tool that selection of the specific network of stores that will receive the new article, associated with the selling potential of each store can be implemented to address this issue.
7. Extrapolate initial sales observations taking into account seasonal effects. The retail industry has
experiences seasonal variations that can result from natural forces, i.e., seasons in a year and human decisions or customs. Many types of economic activities depend on the fluctuations of this seasonality.2 8 As described above, in the current methodology buyers will extrapolate daily sales
to weekly sales by using simplified factors. Similarly they will extrapolate the seasonal factors from the weekly sales without taking into account the importance of the peaks and valleys of the different weeks. In reality, selling 100 units of an article on the first day of sales if that day happens to be a Saturday is not the same as selling them on a Tuesday. In addition, the current
methodology does not take into account the time of the year when the comparable article was launched. That is, the buyer will use the aggregated sales of the historical comparable reference as the baseline for the new item regardless of the weeks when the comparable item was sold. Most likely, the new article might be launch in a different week of the year. Therefore, when using the sales of the comparable item to forecast selling potential for a new article, the comparable sales need to be deseasonalized and reseasonalized for the new article launching date. The seasonal effects have a significant impact on Zara's performance, and they need to be taken into account when deciding how much to buy.
8. Calculate the error terms. A main aim of this case study is to identify those areas that the
purchasing departments can constantly improve. Management at Zara is constantly experimenting to learn more about the work they do. One measurement of improvement in the purchasing process
is how successful the buyers are at forecasting demand; this metric has not been implemented but is approximated by using the number of units that need to be marked down.
9. Automate the process. Zara is updating and robustly enhancing all their IT technologies. Most of
the areas of improvement previously proposed require enhancing the database access and the user interface design that the buying teams use. These system improvements will be incorporated into a corporate tool that is being developed in-house. Chapter 5 describes the preliminary format planned for the purchasing tool.
4.2 Proposed standard methodology: Point forecast to estimate demand
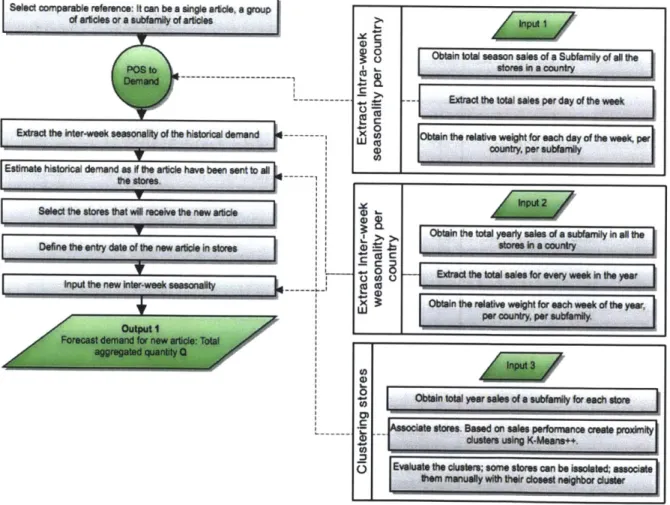
Figure 9 shows the purchase optimization top-level process flowchart. The purchasing optimization process contains 3 modules, inputs, outputs, and the update module. The inputs module collects the required information for the optimization model. It contains four sub-modules, historical information,
demand forecast, exposition stock, and suppliers and transportation costs. The most important of this input is the demand forecast for the article. This thesis focuses specifically on defining a process for the forecast sub-module. The forecast process addresses six out of the eight improvement areas described in Section 4.1. The output module answers the three most important questions for a buyer,
obtains the intra-week seasonality per country. The intra-week seasonality represents the observe peaks and valleys in the weekly selling pattern. That is, the days of the week when a given country has more selling potential. Similarly, the second input is the inter-week seasonality per country. The inter-week seasonality input evaluates the peaks and valleys observed in the yearly selling pattern. That is, the weeks of the year when a country has the highest selling potential. The third input module is the clustering stores module. The main function of this input is to group together the stores with the most similar selling behavior. Section 4.3 describes in detail the calculation of the three inputs modules.
t
Select co r abl reference It con be a si e a
dd , a gp
, of arlicies or a subfiamily of articles I Z 1.
0 0 0
0 0
Figure 6: Proposed standard methodology: Initial purchasing quantity process map
The left portion of Figure 10 shows the point forecast process. After selecting the historical
information use as baseline data, the process in Figure 10 highlights the sub-module POS to Demand. Figure 11 explains in detail the sub-module that converts the POS data into demand data. The output of
Obtain total season salsa of a Subfamily of all the utores in a country
Obti tot yal ye a * a'vb~anfy for e.ch store
stores. Base on sales pefomance asl proxkiy
dusteae using K-Meanw++.
Evaluat th dusters; some stores can be isoisted; am
this sub-module is the demand dataset for the new article. Once obtained the demand dataset, it is modify to include the stores' situation at the launching date of the article. The number and type of stores receiving the new article, the intra-and inter-week seasonality affecting during the launching period of the new item characterize the stores' conditions. These conditions give each article a different selling potential their calculations is explain in detail bellow in this section.
MoINg PM dit dmwnd data
ObtIn
C ad rcs data Oiy ssinonestore
Figure 7: Proposed standard methodology: Converting POS data into demand data process map
The first step in the improved methodology is to obtain the baseline information. All the purchasing departments at Zara use the historical sales information of a comparable reference as the baseline demand forecast for a new article. Following the same logic, a comparable historical reference will be