HAL Id: inserm-00704602
https://www.hal.inserm.fr/inserm-00704602
Submitted on 5 Jun 2012HAL is a multi-disciplinary open access archive for the deposit and dissemination of sci-entific research documents, whether they are pub-lished or not. The documents may come from teaching and research institutions in France or abroad, or from public or private research centers.
L’archive ouverte pluridisciplinaire HAL, est destinée au dépôt et à la diffusion de documents scientifiques de niveau recherche, publiés ou non, émanant des établissements d’enseignement et de recherche français ou étrangers, des laboratoires publics ou privés.
Depression in elderly persons subject to childhood
maltreatment is not modulated by corpus callosum and
hippocampal loss.
Karen Ritchie, Isabelle Jaussent, Florence Portet, Philippe Courtet, Alain
Malafosse, Jerome Maller, Chantal Meslin, Alain Bonafé, Emmanuelle Le
Bars, Nicolas Menjot de Champfleur, et al.
To cite this version:
Karen Ritchie, Isabelle Jaussent, Florence Portet, Philippe Courtet, Alain Malafosse, et al.. De-pression in elderly persons subject to childhood maltreatment is not modulated by corpus callo-sum and hippocampal loss.. Journal of Affective Disorders, Elsevier, 2012, 141 (2-3), pp.294-9. �10.1016/j.jad.2012.03.035�. �inserm-00704602�
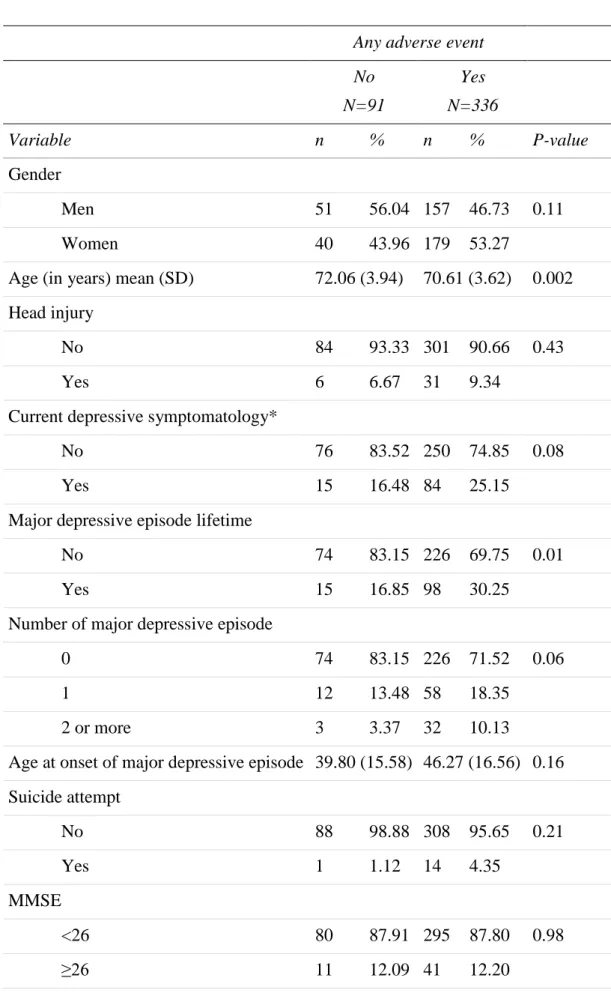
Table 1. Differences between subjects having experienced or not experienced an adverse
childhood life event on demographic and clinical variables
Any adverse event No N=91 Yes N=336 Variable n % n % P-value Gender Men 51 56.04 157 46.73 0.11 Women 40 43.96 179 53.27
Age (in years) mean (SD) 72.06 (3.94) 70.61 (3.62) 0.002 Head injury
No 84 93.33 301 90.66 0.43
Yes 6 6.67 31 9.34
Current depressive symptomatology*
No 76 83.52 250 74.85 0.08 Yes 15 16.48 84 25.15
Major depressive episode lifetime
No 74 83.15 226 69.75 0.01 Yes 15 16.85 98 30.25
Number of major depressive episode
0 74 83.15 226 71.52 0.06
1 12 13.48 58 18.35
2 or more 3 3.37 32 10.13
Age at onset of major depressive episode 39.80 (15.58) 46.27 (16.56) 0.16 Suicide attempt No 88 98.88 308 95.65 0.21 Yes 1 1.12 14 4.35 MMSE <26 80 87.91 295 87.80 0.98 ≥26 11 12.09 41 12.20
Any adverse event No N=91 Yes N=336 Variable n % n % P-value Nart Score 21.01 (5.62) 21.49 (5.87) 0.48 Alcohol (g/day) <12 15 16.48 49 15.03 0.24 12-36 62 68.13 246 75.46 >36 14 15.38 31 9.51
Table 2. Associations between sociodemographic variables, clinical characteristics and corpus
callosum (CC) area ratio, and hippocampal (HC) volume ratio.
CC area ratio HC volume ratio
Variable Correlation coefficient or mean (SD) p-value Correlation coefficient or mean (SD) p-value
Age (in years) -0.22 <.0001 -0.14 0.004
NART Score -0.05 0.38 0.02 0.70
Gender
Men (n=208) 0.58 (0.09) 0.001 5.64 (0.76) 0.05 Women (n=219) 0.61 (0.09) 5.78 (0.66)
Lifetime major depressive episode
No (n=300) 0.59 (0.09) 0.14 5.65 (0.70) 0.06 Yes, currently (n=8) 0.58 (0.06) 6.00 (0.70)
Yes, in the past (n=105) 0.61 (0.09) 5.81 (0.73) Serious events after 18 yrs
No (n=271) 0.59 (0.09) 0.20 5.72 (0.72) 0.04 Yes (n=74) 0.58 (0.10) 5.53 (0.67)
Recent events - last 2 yrs
0 (n=171) 0.60 (0.10) 0.91 5.70 (0.72) 0.11 1 (n=139) 0.60 (0.09) 5.64 (0.74)
2 or more (n=103) 0.60 (0.09) 5.83 (0.66) Lifetime head injury
No (n=385) 0.60 (0.10) 0.02 5.72 (0.71) 0.42 Yes (n=37) 0.57 (0.08) 5.62 (0.70)
Parents had problems with alcohol
No (n=384) 0.60 (0.09) 0.15 5.71 (0.71) 0.72 Yes (n=43) 0.62 (0.11) 5.67 (0.74)
Table 3. Association of adverse events with corpus callosum (CC) area ratio and hippocampal (HC)
volume ratio adjusted for age, sex and head injury
Whole sample CC area ratio HC ratio
Variable mean (SD) p-value mean (SD) p-value Any adverse event
No (n=91) 0.58 (0.11) 0.43 5.54 (0.87) 0.07 Yes (n=336) 0.59 (0.15) 5.70 (1.15)
Physical and / or sexual abuse
No (n=91) 0.58 (0.16) 0.90 5.69 (1.42) 0.40 Yes (n=13) 0.58 (0.10) 5.90 (0.86)
Verbal abuse from parents
No (n=91) 0.58 (0.15) 0.45 5.69 (1.21) 0.35 Yes (n=28) 0.60 (0.10) 5.85 (0.83)
Humiliation, mental cruelty or excessive physical mistreatment
No (n=91) 0.57 (0.14) 0.65 5.58 (1.23) 0.31 Yes (n=39) 0.58 (0.10) 5.75 (0.90)
Mental disorder in parents
No (n=91) 0.57 (0.14) 0.05 5.60 (1.11) 0.13 Yes (n=79) 0.60 (0.13) 5.78 (1.01)
Poverty, financial difficulties
No (n=91) 0.58 (0.14) 0.07 5.58 (1.08) 0.02 Yes (n=108) 0.60 (0.14) 5.84 (1.06)
Parents too often shared their problems with children
No (n=91) 0.58 (0.15) 0.50 5.59 (1.26) 0.56 Yes (n=58) 0.59 (0.13) 5.67 (1.09)
Death of parent
No (n=91) 0.57 (0.14) 0.44 5.58 (1.14) 0.51 Yes (n=77) 0.56 (0.13) 5.65 (1.06)
Experienced war/ catastrophe
No (n=91) 0.58 (0.12) 0.53 5.55 (0.92) 0.06 Yes (n=246) 0.59 (0.15) 5.72 (1.14)