HAL Id: hal-01460761
https://hal-amu.archives-ouvertes.fr/hal-01460761
Submitted on 17 Feb 2017HAL is a multi-disciplinary open access archive for the deposit and dissemination of sci-entific research documents, whether they are pub-lished or not. The documents may come from teaching and research institutions in France or abroad, or from public or private research centers.
L’archive ouverte pluridisciplinaire HAL, est destinée au dépôt et à la diffusion de documents scientifiques de niveau recherche, publiés ou non, émanant des établissements d’enseignement et de recherche français ou étrangers, des laboratoires publics ou privés.
Effects of GABAA kinetics on cortical population
activity: computational studies and physiological
confirmations
Sandrine Chemla, Frédéric Chavane
To cite this version:
Sandrine Chemla, Frédéric Chavane. Effects of GABAA kinetics on cortical population activity: computational studies and physiological confirmations. Journal of Neurophysiology, American Physi-ological Society, 2016, 115 (6), pp.2867 - 2879. �10.1152/jn.00352.2015�. �hal-01460761�
Effects of GABA
Akinetics on cortical population activity: computational
studies and physiological confirmations
Sandrine Chemla1 and Frédéric Chavane2
1Canadian Centre for Behavioural Neuroscience, University of Lethbridge, Lethbridge, Alberta, Canada; and2Institut de
Neurosciences de la Timone, UMR 7289 Centre National de la Recherche Scientifique and Aix-Marseille Université, Marseille, France
Submitted 8 April 2015; accepted in final form 22 February 2016
Chemla S, Chavane F. Effects of GABAAkinetics on cortical population activity: computational studies and physiological confir-mations. J Neurophysiol 115: 2867–2879, 2016. First published Feb-ruary 24, 2016; doi:10.1152/jn.00352.2015.—Voltage-sensitive dye (VSD) imaging produces an unprecedented real-time and high-reso-lution mesoscopic signal to measure the cortical population activity. We have previously shown that the neuronal compartments contribu-tions to the signal are dynamic and stimulus-dependent (Chemla S, Chavane F. Neuroimage 53: 420 – 438, 2010). Moreover, the VSD signal can also be strongly affected by the network state, such as in anesthetized vs. awake preparations. Here, we investigated the impact of the network state, through GABAAreceptors modulation, on the VSD signal using a computational approach. We therefore systemat-ically measured the effect of the GABAA-mediated inhibitory post-synaptic potentials (IPSPs) decay time constant (G) on our modeled VSD response to an input stimulus of increasing strength. Our simulations suggest that Gstrongly modulates the dynamics of the VSD signal, affecting the amplitude, input response function, and the transient balance of excitation and inhibition. We confirmed these predictions experimentally on awake and anesthetized monkeys, com-paring VSD responses to drifting gratings stimuli of various contrasts. Lastly, one in vitro study has suggested that GABAAreceptors may also be directly affected by the VSDs themselves (Mennerick S, Chisari M, Shu H, Taylor A, Vasek M, Eisenman L, Zorumski C. J
Neurosci 30: 2871–2879, 2010). Our modeling approach suggests that
the type of modulation described in this study would actually have a negligible influence on the population response. This study highlights that functional results acquired with different techniques and network states must be compared with caution. Biophysical models are pro-posed here as an adequate tool to delineate the domain of VSD data interpretation.
VSD signal; biophysical model; network state; GABAA receptor; experimental validation
VOLTAGE-SENSITIVE DYE IMAGING(VSDI) offers the possibility to
visualize in real-time the cortical network activity of large neuronal population with high spatiotemporal resolution (Grin-vald et al. 1999; Grin(Grin-vald and Hildesheim 2004; Chemla and Chavane 2010b). This makes it an ideal technique to study the dynamics of cortical processing at the mesoscopic level. The technique is based on voltage-sensitive dyes (VSDs), which bind to the cells membrane and transform linearly variations of membrane potential into variations of fluorescence. The re-corded VSD signal is therefore a complex signal that combines a large amount of intermingled components (including all
layers of the circuitry, all cell types, i.e., excitatory, inhibitory, and glial, and all neuronal compartments, i.e., somas, axons, and dendrites), whose relative contributions are difficult to disentangle from each other (see Chemla and Chavane 2010b for a review on the subject).
To understand the multicomponent origin of the VSD signal, we developed a detailed biophysical model (Chemla and Cha-vane 2010a) based on known neural properties of the visual cortical network and adjusted to reproduce the dynamics of experimental VSD signal (Reynaud et al. 2007, 2012). Al-though the size of the cortical column is limited to approxi-mately one single pixel of optical imaging, it provided us with a detailed reconstruction of the signal and its dynamics. The model suggested that inhibitory cells, spiking activity, and deep layers contributions are playing a small although nonneg-ligible role in the overall signal (20%), while 60% of the signal comes from the dendritic activity of excitatory neurons in superficial layers [see DISCUSSION in Chemla and Chavane
(2010a) for explanation on the origin of this nonlinear predic-tion]. Importantly, we showed that those contributions were dynamically modulated with time and thalamic input strength. However, VSDI studies are done in a variety of experimental and arousal conditions. One concern is therefore that VSD signal origin may not be identical in those studies since different network states could affect the relative contribution of the various components to the VSD signal. Actually, anesthesia seems to affect differently evoked potentials and VSD re-sponses (Devonshire et al. 2010). Hence one may question how much VSD signal is comparable across those studies per-formed on various arousal states, for instance, in awake (Slovin et al. 2002; Chen et al. 2006; Reynaud et al. 2012) vs. anesthetized (Grinvald et al. 1994; Sharon and Grinvald 2002; Chavane et al. 2011) animals. Lastly, another recent concern is that VSD molecules, in themselves, seems to affect GABAA receptors, resulting in a potential prolongation of inhibitory postsynaptic current (IPSC) decays by 32⫾ 5% (Mennerick et al. 2010). Although this in vitro study has not been replicated in vivo, it is worth considering such an effect on the VSD signal from a theoretical perspective.
In this study we therefore investigated how cortical popula-tion dynamics, as measured by VSDI, are affected by differ-ences of network state and VSD-mediated GABAA receptor modulation. For this purpose, we manipulated a single param-eter in our model (seeMATERIALS AND METHODS), the decay time
constant of GABAA-mediated IPSCs (G), since affected by most anesthetics (see Table 2 andRESULTS). Here we reveal that
G strongly affects the neuronal response dynamics and con-Address for reprint requests and other correspondence: S. Chemla, Canadian
Centre for Behavioural Neuroscience (CCBN); Univ. of Lethbridge, 4401 Univ. Dr., Lethbridge, Alberta T1K 3M4, Canada (e-mail: sandrine.chemla@univ-amu.fr).
trast response function as would be measured by VSDI. The predictions of our model were confirmed in VSDI experiments made in V1 of five monkeys at different arousal states (see
MATERIALS AND METHODS). Finally, we show that the
VSD-mediatedGprolongation suggested by Mennerick et al. (2010) would actually lead to minor changes of the VSD signal, having negligible consequences on the population signal.
MATERIALS AND METHODS
Biophysical Model Implementation and GABAAReceptor
Modulation
In Chemla and Chavane (2010a), we proposed a detailed biophys-ical and realistic cortbiophys-ical column model with compartmental neurons, which allows us to compute linearly the VSD signal. More precisely, this column comprised 180 compartments (up to 10) Hodgkin-Huxley neurons (small pyramidal in layer 2/3, spiny stellate in layer 4 and large pyramidal in layer 5 are excitatory and represent 80% of the cells, while inhibitory smooth stellate interneurons in each layer represent the remaining 20%) and has a horizontal area of 50⫻ 50 m, corresponding to one pixel of optical imaging. Recurrent con-nectivity between those neurons was inspired by Binzegger et al. (2004) while lateral interactions were tuned in strength and synapses numbers to fit excitatory and inhibitory distributions, respectively, from Buzás et al. (2001) and Buzás et al. (2006), enabling us to simulate the dynamics induced by a hypercolumn of ⬃750 m. Synaptic background activity similar to in vivo measurements for a large network was introduced in the form of two stochastic ionic conductances (i.e., Ornstein-Uhlenbeck equations) using the model of Destexhe et al. (2001). Finally, thalamic afferent inputs to layer IV cells are simulated using random spike trains whose rate was manip-ulated (from 0 to 100 Hz) to study the influence of different cortical regimes on the VSD signal. Importantly, individual input-output relationships (F–I curves) of excitatory and inhibitory neurons have been initially fitted to reproduce intracellular recordings from Nowak et al. (2003), and in a second step the recurrent network of neurons has been tuned to reproduce the contrast response function (CRF) of excitatory and inhibitory V1 neurons in vivo (Contreras and Palmer 2003). The resulting biophysical model is thus a balanced local network of excitatory and inhibitory neurons, background activity and horizontal interactions, that behaves realistically in response to dif-ferent levels of activity (thalamic inputs), both at the single neuron and the global network level (see the schematic representation of the model in Fig. 1).
The VSD signal is computed by linearly integrating, for each layer
L, the level of depolarization (V) of each compartment (i), membrane
surface (S), and staining (): VSD⫽
兺
L
VSDLwith VSDL⫽L
兺
i
ViSi
This first assumption assumes that the dye, which has a lipophilic and a lipophobic part (Grinvald et al. 1999), stains all membranes inde-pendently of the neuron type (Grinvald and Hildesheim 2004), as evidenced from two-photon imaging (Denk et al. 1994; Yuste et al. 1997; Kuhn et al. 2008; Homma et al. 2009) or single photon confocal imaging (Fine et al. 1988; Ferezou et al. 2006). Importantly, dye attenuation (Fig. 1, color gradient) was taken into account to calculate the compartments’ contributions across layers (supragranular, granu-lar, and infragranular layers). Note that as we restricted our stimula-tion durastimula-tion to a few hundred of milliseconds, the dye signal would be less likely to be contaminated by changes of slow hemodynamic intrinsic signals (see Shoham et al. 1999) that contribute to the fading of the fluorescent signal with cortical depth. Light scattering is another factor but its amplitude is an order of magnitude smaller (see Grinvald et al. 1999). We used the distribution of fluorescence intensity ( parameter) estimated by Lippert et al. (2007), i.e.,2⫽ 0.95,4⫽
0.05, and 5 ⫽ 0. The model has been implemented using both
NEURON (Hines and Carnevale 1997) and neuroConstruct (Gleeson et al. 2007) softwares (see Chemla and Chavane 2010a for more details). We used this cortical column modelization to study the effect of modulating one biophysical parameters on the VSD signal, e.g.,G.
Anesthetic-mediated or VSD-mediated modulation of GABAA
re-ceptor kinetics was investigated by manipulating the decay time constant of GABAA-mediated IPSCs, respectively, either considering
that all GABAAreceptors are affected or only receptors of neurons
stained by the dye, i.e., neurons in superficial layers. In our model, the synaptic interactions are modeled by using the general equation that describes transmitter-activated ion channels in the Hodgkin-Huxley formalism (Hodgkin and Huxley 1952):
Isyn
共
t兲
⫽ gsyn共
t兲共
V⫺ Esyn兲
, (1)where Isynis the synaptic current, gsyn(t) is a time dependent
conduc-tance that will increase at the arrival of a presynaptic spike, V is the postsynaptic membrane potential, and Esynis the reversal potential of
the considered channel. The parameter Esynand the function gsyncan
thus be used to characterize different types of synapses, e.g., AMPA and GABAAfor excitatory and inhibitory synapses respectively in this
model.
More particularly, we used the simplified kinetic model of GABAA
synaptic receptors proposed by Destexhe et al. (1998), which uses the following two-states diagram:
C⫹ Tº
 ␣
O, (2)
where C and O represent respectively the closed and open states of the channel, T represents the concentration of neurotransmitter molecules, assuming to be released in a brief pulse at each arrival of a presynaptic spike, and ␣ and  are voltage-independent forward and backward rate constants. If r is defined as the fraction of the receptors in the open state, it is then described by the following first-order kinetic equation:
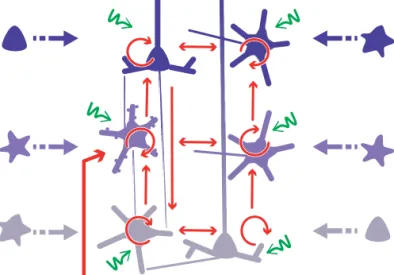
Fig. 1. Biophysical model implementation: model representation with recurrent network (red arrows, for clarity only the main connections are represented) connecting 6 populations of neurons (excitatory: pyramidal and spiny stellate cells; and inhibitory: smooth stellate cells) in the 3 main layers of the cortical structure, background activity (green arrows) simulating realistic synaptic bombardment to embed the column into a larger network, lateral connections between neighboring columns (blue dashed arrows), and input signals from the thalamus (large red arrow). The model offers the possibility to compute the voltage-sensitive dye (VSD) signal with a linear formula taking into account the dye concentration (blue gradient), and the membrane potential at each compartment. [Reprinted from Neuroimage, Vol. 53, Chemla and Chavane, “A biophysical cortical column model to study the multi-component origin of the VSDI signal,” Pages 420 – 438, Copyright (2010), with permission from Elsevier.]
dr
dt⫽␣
关
T兴共
1⫺ r兲
⫺r (3)The postsynaptic current of GABAAreceptors is given by:
IGABA
A⫽ GGABAAr
共
V⫺ EGABAA兲
, (4)where GGABA
A is the maximal conductance of Cl
⫺ channels and
EGABA
Aits reversal potential (EGABAA⫽ ECl⫺⫽ ⫺70 mV). In this
framework,Gcorresponds to the inverse of the parameter.
Parametric Analysis and Statistical Procedure
For the majority of cortical cells,Gfalls within a range from 2 to
10 ms (Otis and Mody 1992; Mody et al. 1994; Nusser et al. 2001; Mody and Pearce 2004). LongerG⬎10 ms can be found but under
nonphysiological conditions such as in neuronal cultures (Mennerick et al. 2010; Chisari et al. 2011), in vitro studies at room temperature (Kapur et al. 1997; Sceniak and MacIver 2008), or studies under barbiturates anesthesia (Mathers et al. 2007). More seldom inhibitory postsynaptic currents with decay time constants ⬎20 ms have also been reported for neurogliaform cells that mediate the so-called third form of GABAA-receptor-mediated inhibition GABAA,slow(see
Ca-pogna and Pearce 2011 for a review on the subject). In this study, we limited the range ofGwithin the physiological values of 2 to 20 ms.
Table 1 summarizes this range (G⫽ 1/), as well as the conditions
in which they are found in the literature.
To assess differences in VSD signal parameters, before and after changes inG, we ran model simulations in the following: 1) for each
trial, the model configuration (including cell positions, network con-nections, background noise, and thalamic inputs) is generated once and, except for the parameterG, is kept in all other aspects constant; 2) from one trial to the other, the model configuration is recalculated.
We then obtained sets of samples (100 trials) on which we can perform two-samples Wilcoxon signed-rank test analyses with P⬍ 0.01 considered significant to compare their means pairwise. To investigate the effect of anesthetic-mediated modulation, we made pairwise comparisons between G⫽ 2 ms and higher values (see
range of Gvalues in Table 1). To investigate the effect of
VSD-mediated modulation, we made pairwise comparisons between each GandG⫹ 32%. All the following results have been plotted using
the statistical software package R (https://www.r-project.org/, 2008) and its wilcox.test function (with argument paired⫽ TRUE). We used a boxplot representation for VSD parameters distribution to graphi-cally visualize the median, the 25 and 75% quartiles, and the mini-mum and the maximini-mum of the data set. We also superimposed a one-dimensional scatter dot violin-like plot of the data (closely packed, nonoverlapping gray points) to give additional precision of the distribution (see Fig. 2, C–E, Fig. 3A, and Fig. 4, B and C).
Experimental Procedures
The experiments were conducted on five monkeys (3 male Macaca
mulatta and 2 female M. fascicularis) in three different protocols:
awake (n ⫽ 2), anesthetized (n ⫽ 2), and awake with two arousal states that serves as his own control (n⫽ 1). Experimental protocols have been approved by the Marseille Ethical Committee in Neurosci-ence (Approval A10/01/13, Official National Registration 71-French Ministry of Research). All procedures complied with the French and European regulations for animal research, as well as the guidelines from the Society for Neuroscience.
Surgical preparation and VSDI protocol. All protocols started with
head holder and chamber implantation over the right hemisphere. Sub-sequently the dura-mater of the primary visual cortex (V1) was removed surgically and a silicon-made artificial dura-mater was inserted under aseptic conditions to insure a good preparation and an optimal optical access to the cortex (Arieli et al. 1995). Before recordings, the cortex was stained for 3 h with the VSD RH-1691 (Optical Imaging) prepared in artificial cerebrospinal fluid (aCSF) at a concentration of 0.2 mg/ml and filtered through a 0.2-m filter. After this staining period, the chamber was rinsed thoroughly with filtered aCSF to wash off any supernatant dye, the artificial dura-mater was inserted back in position, and the chamber was closed with transparent agar and cover glass. Subsequently, optical signals were recorded from a focal plane⬇300m below the cortical surface using a Dalstar camera (512⫻ 512 pixels resolution, frame rate of 110 Hz) driven by the Imager 3001 system (Optical Imaging). Excitation light was provided by a 100-W halogen lamp filtered at 630 nm and fluorescent signals were high-pass filtered at 665 nm. The surgical preparation and VSDI protocol have been described in detail in Reynaud et al. (2012).
Behavioral task in awake and control protocols. Monkeys (n⫽ 3)
were trained to fixate a red target presented in the center of the screen for the entire duration of the trial (799 ms). We monitored the eye positions (sampling rate: 1 kHz, ISCAN ETL-200 Eye Tracking System) using the REX package under the QNX operating system (Hays et al. 1982) and both online behavioral control and image acquisition were heartbeat triggered. A trial was successful when the monkey maintains his gaze on the red target within a window of 2° diameter. As expected from previous studies (e.g., Busettini and Frölich 2014), fixational behaviors were similar in awake vs. drowsy states, presenting similar median distances to the fixation point (0.39 and 0.37°, respectively) and similar median absolute deviation (0.53 and 0.33°, respectively). As a reward, a drop of mashed apple was delivered to the monkey just after the end of the trial. An intertrial interval of 8 s was set for dye bleaching prevention.
Anesthetized protocol. Monkeys (n⫽ 2) were initially anesthetized
with intramuscular ketamine (10 mg/kg), midazolam (0.2 mg/kg), and robinul (0.05 mg/kg). Then, continuous anesthesia was induced with an intravenous propofol bolus (2.5 mg/kg) and maintained with slow intravenous propofol infusion (0.3 mg·kg⫺1·min⫺1), while monkeys were artificially ventilated. Eyes were dilated using atropine and contact lenses were placed to prevent drying. During the experimental protocol, physiological parameters, i.e., temperature, heart frequency, concentration of expired carbon dioxide, and oxygen saturation level, were monitored continuously and collected every 30 min. At the end of experimental recordings, the propofol infusion was stopped and the animal recovered in a very short time (15 min on average).
Table 1. Range of-values (hence G) used in this study
, ms⫺1
G, ms Conditions
0.5 2 Physiological (e.g., CTX/HPC pyramidal cells at 37°C)
0.4 2.5
0.2 5
0.1 10
0.05 20 Nonphysiological (room temperature or under
barbiturates)
GABAA,slow(e.g., NGFC)
0.02 50–75 HPC neurons in culture (Mennerick et al. 2010)
Row 6 reports the-value of Mennerick et al. (2010), not tested in this study. CTX, cortex; HPC, hippocampus; NGFC, neurogliaform cell.
Drowsiness state induction in control protocol. The drowsy state of
the animal (n⫽ 1) was induced by intranasal administration of 0.2 ml midazolam (7-chloro-imidazo, 0.1 mg/kg). Midazolam is a short-acting (short elimination half-life: 2– 6 h) hypnotic-sedative drug with anxiolytic and amnestic properties. From the benzodiazepines class of tranquilizer drugs, the pharmacologic effects of midazolam are me-diated through a majority of GABAAreceptors (those containing␣1-, ␣2-,␣3-, or␣5-subunits, see Sigel 2002 for a review) and as a positive
allosteric modulator (i.e., ligand binding to allosteric sites of GABAA
receptors causing increased efficiency of the main site) potentiates the inhibitory effect of the available agonist GABA (see Table 2), thereby leading to a calming and anxiolytic effect. To estimate the cerebro-spinal fluid concentration of the injected dose (Dmidazolam⫽ 0.9 mg),
we proceeded in the following way. We deduced from Walbergh et al. (1991) that⬃15% of midazolam nasal administration is found in the plasma (Pplasma ⬇ 0.15). In a second step, the cerebrospinal fluid
concentration should be of 30% of the plasma concentration (Henry et al. 1997; Maurer et al. 2005; PCSF⬇ 0.3). If we assume the same
proportion in the monkey, the CSF concentration was estimated with the following formula:
Dmidazolam⫻ Pplasma⫻ PCSF
Mmidazolam⫻ VCSF ⬇ 8M
where monkey CSF volume VCSF ⬇ 15 ml and midazolam molar
mass Mmidazolam⫽ 325.78 g/mol.
Visual stimulation. The visual stimuli consisted of drifting gratings
(FS⫽ 3 cpd, FT ⫽ 3 Hz) displayed on the screen, either full-field (24°) or locally (1 or 2°) centered on (⫺1°, ⫺2°) from the center of the fixation. Six different contrast levels (mean luminance set to 15 cd/m and Michelson contrast between 2.5 and 80%) were used for the full-field gratings (6 full-field conditions), while only 80% contrast was used for the two local stimulation conditions (done in the control protocol only). In addition, two blank conditions, i.e., where no visual stimulus was presented on the screen, were presented to the monkey. The stimuli were computed online using VSG2/5 libraries (VSL v8) on Matlab and were displayed on a 22 inch CRT monitor at a resolution of 1,024 ⫻ 768 pixels, a refresh rate of 100 Hz and at a viewing distance set to 57 cm.
Data analysis. Stacks of images were stored on hard-drives for
offline analysis with MATLAB R2014a (MathWorks), using the Opti-mization, Statistics, and Signal Processing Toolboxes. The evoked re-sponse to each stimulus was computed in four successive basic steps. First, the recorded value at each pixel was divided by the average value before stimulus onset (“frames 0 division”) to remove slow stimulus-independent fluctuations in illumination and background fluorescence levels. Second, this value was subsequently subtracted by the value
τon e d uti l p ma ua et al P e d uti l p ma hc t o n A/ D
A
C
E
D
τoff τoff τonB
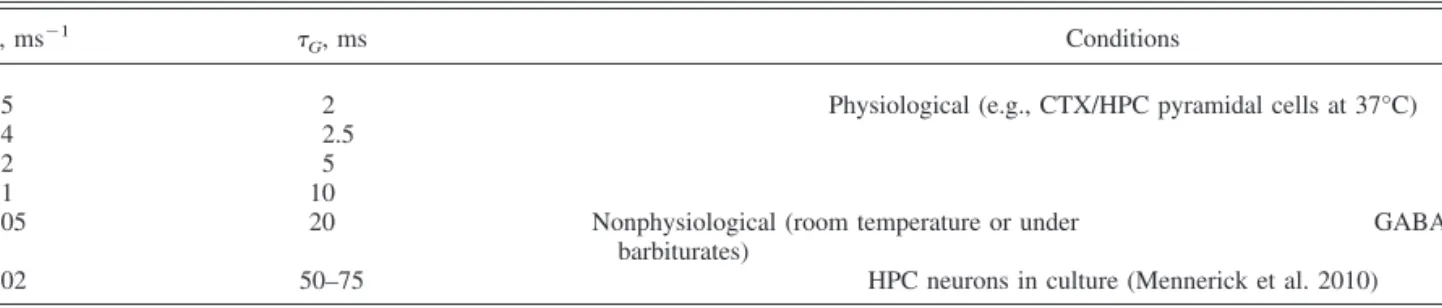
* * * * * * * * τG (ms)Fig. 2. Effects ofGmodulation on the VSD signal dynamics. A: averaged (100 trials) time course of the modeled VSD signal in response to a 600 ms static
Gaussian luminance stimulus (40 impulses/s, stimulus onset at t⫽ 0) for the different values ofG(gray scale). B: onset (left) and offset (right) of the modeled
VSD responses, after normalization with respect to their maximum.onandoffof each VSD trials have been computed using an exponential fitting (dotted lines,
seeMATERIALS AND METHODS, Eq. 5). Box-plot diagrams of the rising time constant parameteron(C); the decay time constant parameteroff(D); and the plateau
amplitude (E) of the modeled VSD response as a function ofGare shown. *Significant differences with the conditionG⫽ 2 ms (P ⬍ 0.01, seeMATERIALS
AND METHODS).
A
B
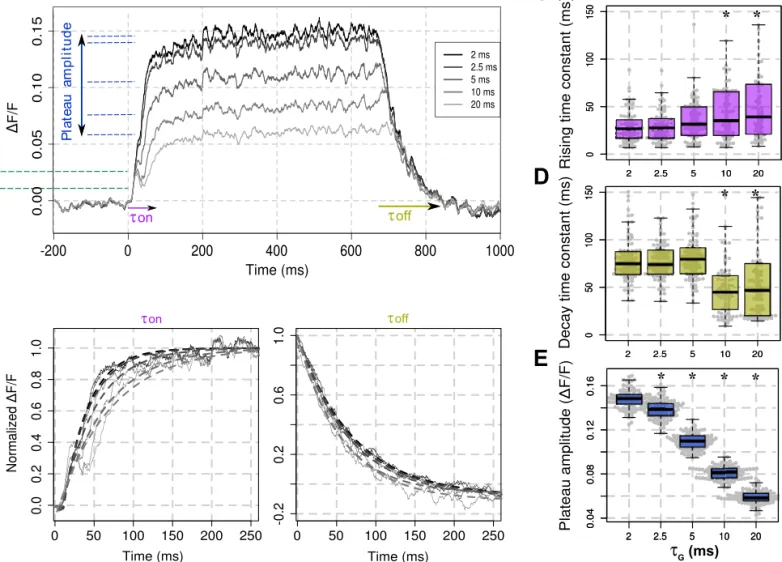
Ecells Icells Ecells Icells * * * τG (ms)Fig. 3. Towards an understanding of the deceleration-acceleration (DA) notch formation. A: box-plot diagram of the DA notch amplitude of the modeled VSD signal plotted in Fig. 2A for the different values of DA. *Significant differences with the conditionG⫽ 2 ms (P ⬍ 0.01). B: onset of the VSD signal time courses
decomposed into excitatory cell activity (Ecells, burgundy lines) and inhibitory cells activity (Icells, orange lines), normalized to the maximum total VSD response, and plotted for 5Gvalues at top (2, 2.5, 5, 10, and 20 ms). The corresponding time courses of the difference between Ecell and Icell activities are
plotted in black at bottom. Corresponding vertical dashed lines indicate times of local maxima computed from response onset marked by the solid black lines.
Rmax I50 Rmax 2
A
B
* * * * * * *C
Fig. 4. Effects ofGmodulation on the input response
function of the VSD signal. A: the modeled VSD signal, averaged over 600 ms at steady state, is plotted as a function of thalamic input rate, for the 5 consid-ered values ofG(gray scale, different markers). Each
trace has been fitted with a Naka-Rushton function
(seeMATERIALS AND METHODS, Eq. 6). Box-plot
dia-grams of Rmax(B) and I50(C) as a function ofGare
shown. *Significant differences with the conditionG
⫽ 2 ms (P ⬍ 0.01).
obtained for the blank condition (“blank subtraction”) to eliminate most of the noise due to heartbeat and respiration (Shoham et al. 1999). Third, a linear detrending of the time series was applied to remove residual slow drifts induced by dye bleaching (Chen et al. 2008; Meirovithz et al. 2009). Finally, the response is averaged within a region of interest (ROI) in V1 (7,269 pixels equivalent to a region radius of 1.4 mm). The rationale of this average is to increase the signal-to-noise while keeping the dynamics the same. Indeed, we presented full-field stimuli that will generate similar dynamics for all pixels in the ROI. To check for this assumption, we did a correlation analysis between this averaged response and the response of each individual pixel of the ROI and demonstrate that the averaged time course is highly corre-lated with all pixels (median values of R2from 0.87 to 0.97 for the
lowest and the highest contrast condition, respectively). Thus the averaged dynamics is indeed a good physiological measure to be compared with the model’s single pixel, better than an experimental single pixel that will be a noisier representative of the same dynamics.
Data Fitting
Rising and decay time constants of the simulated and physiological VSD responses (respectively, Fig. 2, C and D, and Fig. 5, A and B) are quantified using an exponential fitting (Eq. 5), respectively, on the onset and the offset epochs (calculated from the moment the signal starts to, respectively, rise, i.e., time 0 in Fig. 2B, left, and decline, i.e.,
time 0 in Fig. 2B, right) of the response normalized to its maximum: Fexp
共
t兲
⫽ a ⫹ k共
1⫺ e⫺共t⫺offset 兲兲
共
tⱖ offset兲
(5) where a denotes the offset, k the amplitude, offset the temporal offset, and the time constants of the fit.Note that we also tested two other fitting procedures to check whether the deceleration-acceleration (DA) notch dynamics influence the evaluation of changes in the onset time constants. In the first one, we performed the exponential fit only through the start of the response (not shown), while in the second one we used a linear combination of an exponential and a difference of Gaussian (DoG) functions (see Eq.
6) to separate the DA notch component from the exponential
dynam-ics (data not shown):
F
共
t兲
⫽ Fexp共
t兲
⫹ kk2冉
e ⫺冉
t⫺冉
tc⫺offset2 2冊冊
2 2 ⫺ e ⫺冉
t⫺冉
tc⫹offset2 2冊冊
2 2冊
(6) where2denotes the variance of each Gaussian functions, while k2and tcare respectively the amplitude and the time of the center point
of the DoG. Both procedures gave very similar results than the simple exponential fit (comparison ofonvalues when applying, respectively,
Eq. 6 vs. Eq. 5: ranging from 30.3⫾ 15.7 vs. 28.6 ⫾ 16.2 ms for
G⫽ 2 ms to 60.9 ⫾ 35.3 vs. 51.8 ⫾ 40.6 ms for G⫽ 20 ms).
Nevertheless, we used the former procedure for computing rising time constants of our experimental data (Fig. 5D) to get rid of variability in the dynamics of the experimental DA notch.
Input response function are fitted to a Naka-Rushton equation (Eq.
7), where R denotes the response of the cell and I the input levels (Fig.
4, B and C). Rmax, I50, and n are, respectively, the maximum response
rate, the semisaturation input rate, equivalent to the semisaturation contrast C50of the CRF (Fig. 5H, experimental conditions) and the
exponent of the input response function.
R
共
I兲
⫽ Rmax In
I50n ⫹ In (7)
RESULTS
Effects of G Modulation on the Cortical Population
Dynamics as Measured by the VSD Signal
First we argue that, among many parameters,Gis a simple though key parameter to account for the effect of anesthesia. The effect of general anesthetics on the GABAAreceptor has been studied extensively (MacIver et al. 1991; Orser et al. 1998; Banks and Pearce 1999; Li and Pearce 2000; Hemmings et al. 2005; Mathers et al. 2007; Ogawa et al. 2011). Table 2 reports the effect of most general anesthetics used in VSD studies on GABAA-mediated IPSCs decay time constant and amplitude, as well as the possible underlying mechanism on Table 2. Effect of general anesthetics on GABAA-mediated IPSCs decay time constant and amplitude
Anesthetics
IPSC Decay Time Constant (G)
IPSC
Amplitude Underlying Mechanisms on GR References
Isoflurane ⫹⫹ – Direct action on postsynaptic GR to
block IPSCs but 2 different sites for amplitude and decay mechanisms
Banks and Pearce 1999
Isoflurane ⫹⫹ ⫹⫹ More channel opening Hemmings et al. 2005
Isoflurane ⫹ 0 Presynaptic site Ogawa et al. 2011
Halothane ⫹⫹ 0 Prolong Cl⫺channel currents via an
increase of intracellular calcium
MacIver et al. 1991
Halothane ⫹⫹ – Direct action on postsynaptic GR Banks and Pearce 1999
Halothane ⫹⫹ – Reduce the agonist unbinding rate Li and Pearce 2000
Barbiturates 0 ⫹⫹ Increase probability of long (stable)
vs. short openings
MacDonald et al. 1989
Barbiturates ⫹⫹ 0 Prolong Cl⫺channel currents via
direct action on GR
MacIver et al. 1991
Barbiturates ⫹⫹ ⫹⫹ Direct action on GR Mathers et al. 2007
Propofol ⫹⫹ ⫹⫹ Decrease GR desensitization but
unknown mechanisms
Orser et al. 1998
Propofol ⫹⫹ 0 Enhance gating of the GR by
GABA
Hemmings et al. 2005
Ketamine 0 0 — Hemmings et al. 2005
Benzodiazepines ⫹⫹ 0 Increase the agonist binding rate MacDonald et al. 1989
Benzodiazepines ⫹⫹ ⫹⫹ Reduce the agonist dissociation rate Mellor and Randall 1997
GR⫽ GABAAreceptors; IPSC, inhibitory postsynaptic current.⫹⫹, Prolongation at clinically relevant concentrations; ⫹, prolongation at nonclinically
relevant concentrations; –, reduction at clinically relevant concentrations; 0, no changes at clinically relevant concentrations or not mentioned in the literature. The ketamine anesthetic is only informative as it mainly acts through NMDA receptors.
GABAAreceptors (see Weir 2006 for a review). Most of them enhance GABAA-mediated inhibition by prolonging G in a dose-dependent manner (Table 2, 2nd column). However, the kinetic mechanisms underlying this common effect remain controversial (see Table 2, 4th column, as an example of several possible mechanisms found in the literature). The modulation of IPSCs amplitude is in contrast less consistent between studies: a modulation has been only reported in about half of the considered studies and the direction of the modu-lation (increase or decrease) is not clear (Table 2, 3rd column). We therefore only considered the modulation of G as the simplest key parameter to model the effect of anesthetics.
VSD signal dynamics depend on G. What are the main
effects of G modulation on the VSD response dynamics? Figure 2A shows the temporal evolution of the modeled VSD signal for various values of the parameterGfrom 2 to 20 ms, in response to a 600-ms thalamic input. Note that the fractional signal (⌬F/F) depends on an arbitrary linear transformation from the level of depolarization to the amount of fluorescence (see Chemla and Chavane 2010a for more details). First, we quantified on each trial the modeled response rising and decay time constants, respectively, on and off (see MATERIALS AND METHODS, Eq. 5, Fig. 2B). A small but significant increase (Fig.
2C, on) and decrease (Fig. 2D, off) were observed only for valuesⱖ10 ms when compared with the time constants of the VSD response obtained for G ⫽ 2 ms (see MATERIALS AND METHODS, Wilcoxon signed-rank test with P ⬍ 0.01). On the
contrary, we observed a strong decrease in plateau amplitude of the VSD response with G(Fig. 2E), the amplitude being significantly smaller for allGvaluesⱖ 2.5 ms when compared
with the VSD response amplitude obtained forG⫽ 2 ms (P ⬍ 0.01).
Another striking feature of the response dynamics revealed when increasing G by the model in Fig. 2A, dashed green lines, is that the VSD signal shows an early transient deceler-ation of the VSD signal: the so-called DA notch (Sharon and Grinvald 2002). Our model shows that the notch amplitude increases withG(Fig. 3A), only significantly forGvaluesⱖ 5 ms compared with the notch amplitude obtained forG⫽ 2 ms (P⬍ 0.01). Sharon and Grinvald (2002) hypothesized that the DA notch is related to the transient increase of disynaptic cortical inhibition following excitatory thalamic input. Using our model, we plotted the onset of the decomposed signal time course arising from excitatory and inhibitory neurons when increasingG(see Fig. 3B, top, vertical dashed lines mark local maxima of the responses that have been normalized to the maximum global VSD response), as well as the time course of the difference between excitatory and inhibitory contributions to the VSD signal (Fig. 3B, bottom). We observe different dynamics for excitatory and inhibitory cells activity, respec-tively, denoted Ecells and Icells in the following. For large value of G, we observe that Ecells start to descelerate and eventually decrease at a time when Icells continues to rise (Ecells reach a local maximum at 17.1 ⫾ 0.49 ms after response onset forG⫽ 5 ms, 14.3 ⫾ 0.13 ms forG⫽ 20 ms and a local minimum at 24.5⫾ 0.36 ms forG⫽ 5 ms, 31.3 ⫾ 0.27 ms for G ⫽ 20 ms), resulting in a decrease of the net recurrent excitatory activity. This decrease thereafter reduces the drive to inhibitory cells, which themselves reduces consequently. Lastly, Icell activity becomes less prominent (Icells reach a local 50 ms 5 10−4 Anesthetized Awake Time Δ F/F 7 8 9 10 11 12 13 x 10−4 Rmax ( Δ F/F) 0 1 2 3x 10 −4 Notch Amplitude ( Δ F/F) 2 4 6 8 10 12 c50 (%)
Rising time constant (ms) Awake Anest Awake Anest Awake Anest Awake Anest 50 ms 5 10−4 1 10 100 0 0.5 1 1.5x 10 −3 Contrast (%) Δ F/F
A
C
D
E
G H
10 20 30 40 50 60 70 0 Time (ms) 50 100 150 200 0 0.4 0.2 0.6 0.8 1 1.2 -0.2 Awake Anesthetized 60 70 80 90 100 110Decay time constant (ms)
normalized Δ F/F Awake Anest
B
OnsetF
Fig. 5. Experimental VSD data. A, left: onset of averaged experimental VSD responses obtained in awake (solid line) and control (dashed line) protocols (3 awake monkeys) in response to full-field drifting gratings at high contrasts. Right: onset of averaged experimental VSD responses obtained in anesthetized (solid line) and control (dashed line) protocols (3 anesthetized monkeys) in response to full-field drifting gratings of high contrasts. B: offset of the averaged experimental VSD responses (2 awake monkeys and 3 anesthetized monkeys). Same color/linestyle code as in A. C: experimental contrast response function for awake (black lines) and anesthetized (gray lines) states. Each trace has been fitted with a Naka-Rushton function (seeMATERIALS AND METHODS, Eq. 6). Dashed lines correspond to the contrast response function of the same monkey enrolled in the control protocol, i.e., before (black, awake state) and after (gray, drowsy state) midazolam administration. Boxplot diagrams revealing the difference in rising time constant (D); DA notch amplitude (E); decay time constant (F); Rmax(G); and C50(H)
between awake (black) and anesthetized (gray) conditions are shown.
maximum at 22.8⫾ 0.81 ms after response onset forG⫽ 5 ms, 25.5⫾ 1.01 ms forG⫽ 10 ms, 19.5 ⫾ 0.15 ms forG⫽ 20 ms and a local minimum at 25.8⫾ 1.35 ms after response onset for G ⫽ 5 ms, 37.1 ⫾ 1.29 ms forG ⫽ 20 ms) allowing Ecell activity to increase again thanks to the constant thalamic input. This phase-shift between Ecells and Icells is well captured by the time course of the difference between excitatory and inhibitory VSD signals (Fig. 3B, bottom), which shows a biphasic behavior, Icell activity becoming strong enough (negative values) to tran-siently slow down the global (Ecells⫹ Icells) population signal. This general effect is becoming stronger for higher inhibition, hence higherG. This suggests that the DA notch arises from the precise timing of balanced excitation and inhibition, these bal-anced dynamics being phase shifted by the changes of GABAA kinetics. Our results therefore predict that this notch should mostly occur in anesthetized preparations (Gⱖ 5 ms).
VSD input response function depends on G. The above
results were obtained at a given thalamic input rate, i.e., 40 impulses/s (ips), but we have shown that the origin of the VSD signal changes with input rate (Chemla and Chavane 2010b). Figure 4A shows the input response function of the VSD signal for eight different thalamic rates (from 0.1 to 100 ips) and for various values of the parameter G. Figure 4 shows a gradual change of the input response function when increasingG. The maximum response rate Rmax(Fig. 4B) and the semisaturation input rate I50 (Fig. 4C) were extracted with a Naka-Rushton function (Eq. 6). Naturally, Rmax (Fig. 4B) exhibits the same tendency than the plateau amplitude (Fig. 2E, P⬍ 0.01). In the other hand, the significant increase in I50forGvaluesⱖ5 ms (Fig. 4C, P ⬍ 0.01) suggests that the operating range of the input response function will shift towards higher input rate when increasing anesthesia level.
Experimental validation of the model predictions. In
sum-mary, our model makes predictions on the dynamics and the contrast response function of the VSD signal following an increase of G, presumably mediated by anesthetics. To test these predictions, we compared the VSD signals measured in monkey V1 in awake and anesthetized conditions, in response to full-field drifting gratings presented at various contrasts (see
MATERIALS AND METHODS, Fig. 5). Experimental data from five
monkeys were pooled: two in awake behaving protocols (Reynaud et al. 2012), two in semichronic anesthetized exper-iments, and a last monkey that served as his own control since both states were tested on the same session (administration of midazolam, i.e., a positive GABAA modulator, during a be-having session).
Figure 5, A and B, shows the averaged time course of VSD signals in normal conditions (black) or with a pharmacological agent increasingG(gray), the dashed line corresponding to the same monkey before or after midazolam administration. Our VSD experimental data confirm that anesthesia, most likely through GABAA receptor potentiation, reduces response am-plitude, increases the response time constanton, and decreases the decay time constant off in agreement with the model predictions (Fig. 2). Remarkably, although the DA notch was not detectable in awake conditions for all three monkeys (Fig. 5A, left), inducing anesthesia or a drowsy state (dashed curve) unveiled for all monkeys a clear DA notch (Fig. 5A, right). Note that DA notch was also unveiled by midazolam admin-istration in response to local drifting grating stimulation (not shown).
In four of these monkeys, we also measured the CRF (Fig. 5C) in awake conditions (black) and anesthetized (gray), the dashed line being for the same monkey before (black) and after (gray) midazolam injection. The measured contrast response functions clearly confirmed the model prediction, i.e., a de-crease of the amplitude and the contrast sensitivity when the animal is anesthetized (gray curves shift to the right and down, Fig. 5C).
Not only were those predictions confirmed qualitatively but also quantitatively, when applying a direct comparison with the model temporal dynamics. More precisely, in this paragraph, we will compare how muchGhas to be increased in the model (from reference G ⫽ 2 ms) to account for the changes observed experimentally on various parameters of the response dynamic. Physiological VSD dynamics exhibits, respectively, an 85 and a 32% difference inonandoffbetween awake and anesthetized conditions (on: 34⫾ 16.5 ms in the awake state vs. 63 ⫾ 9.9 ms in the anesthetized state, Fig. 5D; off: 104.1⫾ 8.4 ms in the awake state vs. 70.4 ⫾ 10.9 ms in the anesthetized state, Fig. 5F) consistent with the difference generated by the model when increasingGabove 10 ms (on: 81% forG⫽ 20 ms, Fig. 2C;off: 40% forG⫽ 10 ms, Fig. 2D). The amplitude of the DA notch observed only in the anesthetized condition is⬃20% of the VSD signal amplitude (i.e., 1.5 10⫺4⫾ 9.5 10⫺5, Fig. 5E), consistent with the model prediction when increasingGabove 10 ms (i.e.,Gⱖ 10 ms, Fig. 3A). Regarding the contrast response function parameters, Fig. 5G reports a 25% difference in Rmax(1.2 10⫺3⫾ 1 10⫺4 in the awake state vs. 0.9 10⫺3⫾ 2.1 10⫺4in the anesthetized state), very similar to the model prediction when increasingG above 5 ms (25% for G ⫽ 5 ms, Fig. 4B). Finally, Fig. 5H shows a 196% difference in physiological C50(3.05⫾ 1.15% in the awake state vs. 9.03⫾ 2.65% in the anesthetized state), whereas the model predicted an increase of only 40% in I50 when increasing G to the most extreme values (Fig. 4C). Please note that this absolute comparison of visual contrast to the models’ thalamic input rate is delicate and not fully relevant. Nonetheless, such difference is reduced if one com-pare the C50values in the same animal for two arousal states, revealing a 64% increase between awake and drowsy state of the animal (C50⫽ 4.2 before vs. 6.9 after midazolam admin-istration, Fig. 5C, dashed lines). This comparison of values between computational predictions and experimental observa-tions suggests that increasingGfrom 2 to 10 ms in the model is likely to correspond to the awake-anesthetized state change in our experimental conditions. Accordingly, midazolam ad-ministration at 8 M (see MATERIALS AND METHODS) should
prolong the IPSCs decay time constant by⬃400% (i.e., about the difference betweenG⫽ 2 ms andG⫽ 10 ms), consistent with what could be extrapolated from a previous study (Verbny et al. 2005).
Quantification of VSD-Mediated GABAAReceptor Function
Potentiation
Lastly, we wanted to take advantage of our model to test the impact that the VSD RH1691 can itself have on GABAA -mediated IPSCs (Mennerick et al. 2010). Indeed, these last authors showed in vitro a prolongation of IPSCs by 32⫾ 5% measured in the presence of 0.3 M RH1691. Whether such effect exists in vivo still need to be confirmed. Furthermore, the
effect disappears after washout of the dye, which is the normal imaging condition. However, because of the importance for the interpretation of VSD signals, we wanted to probe what would be the effect of such extreme-worst-case prolongation of the GABAA-mediated IPSCs on the VSD signal. Figure 6A shows that a 32% modulation of Ghas actually only a mild global effect [red curves with modulation (fmod), gray-scale curves without modulation (f)] on the temporal evolution of the VSD signal, tested for different initial values ofG(2, 2.5, 5, 10, and
20 ms, top row). To unravel the effect, we computed the normalized difference of amplitude values [Fig. 6A, middle and
bottom rows, df⫽ (fvsd⫺ f)/f]. At lowGvalues, the decrease of signal amplitude by VSD-like modulation of GABAA re-ceptor is peaking transiently to a value of about 10% of the signal amplitude at 35 ms, converging to a steady-value of 5% at 100 ms after stimulus onset, for both 10 and 40 ips input rate (Fig. 5A, middle and bottom rows). This effect diminishes when increasing the initialGto fully disappear forGvalues
A
τG (ms) τG (ms) τG (ms) τG (ms) τG (ms) Normalized difference in Rmax (%) Normalized difference in 150 (%)B
D
* ** * ** * Normalized difference in time constant (%)Normalized difference in notch amplitude (%)
τon τoff
C
** * *
Normalized difference in plateau amplitude (%) 40 ips
10 ips
10 ips
40 ips
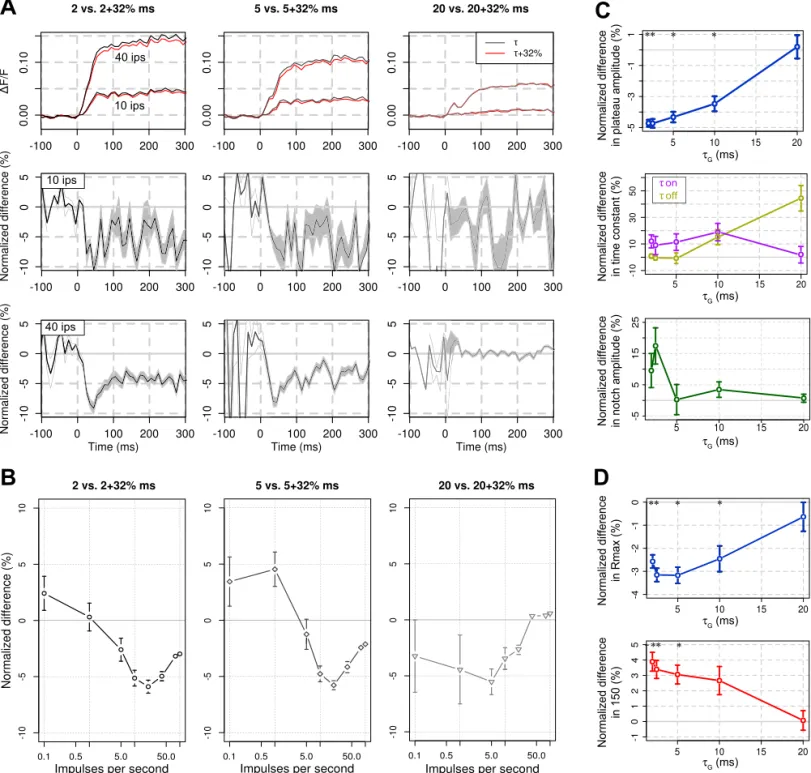
Fig. 6. RH1691 specific effects on the modeled VSD signal. A, top: VSD responses before (gray-scale traces) and after (red traces) a 32% modulation ofG(2,
5, and 20 ms are plotted in columns) for 2 thalamic input rates (10 and 40 ips). Corresponding normalized differences [df⫽ (fmod⫺ f)/f] are plotted at bottom,
where shaded gray areas represent means⫾ SE. B: similarly to the VSD dynamics, normalized differences of the input response function of the VSD signal are computed and plotted here for the three different values ofG(2, 5, and 20 ms, gray-scale and markers). C: statistical effect of a 32% prolongation ofGon the
principal VSD time course characteristics. The normalized differences in plateau amplitude (blue), time constants (onandoff, pink and yellow), and notch
amplitude (green) are respectively shown in top, middle, and bottom. D: statistical effect of a 32% prolongation ofGon the input response function parameters.
The normalized differences in Rmax(blue) and I50(red) are, respectively, shown at top and bottom. Error bars are means⫾ SE. *Significant differences (see
MATERIALS AND METHODS, P⬍ 0.01).
longer than 10 ms (Fig. 6A, bottom row,G⫽ 20 ms). Figure 6B confirms this significant effect for the transient peak am-plitudes of the normalized difference observed for values of input rateⱖ5 ips (P ⬍ 0.01) but also reveals that the effect is maximal for intermediate input rate of 5–20 ips.
To gauge the functional impact of the 32% modulation of G, we computed the normalized difference on the different characteristics of the VSD time course (see Fig. 2), and the input response function parameters (see Fig. 4), and assessed the statistical significance of those paired differences (see
MATERIALS AND METHODS, Wilcoxon signed-rank test with P ⬍
0.01). We conclude that a small (⬃3 to 5%) yet significant effect on VSD plateau amplitude (Fig. 6C, top), Rmax, and I50 (Fig. 6D) exists for the first three or four initial values of G. This effect decreases to 0% difference forG⫽ 20 ms. On the contrary, the effect on VSD notch amplitude and rising and decay time constants (Fig. 6C, middle and bottom) is not statistically significant for any of the G values [mean differences: 6.28 ⫾ 3.24% (P⫽ 0.38) for the notch amplitude, 10.39 ⫾ 6.24% (P ⫽ 0.32) foron, 11.84⫾ 4.49% (P ⫽ 0.46) foroff].
DISCUSSION
The novel finding reported in this paper, using a computa-tional cortical column model, is the provision of a means of investigating the origin of the effect of GABAA receptor modulation on the cortical population dynamics, as measured by the VSD signal, as well as specifically looking at the RH1691 VSD-mediated effect on the VSD signal dynamics. We show that increasing Gdecreases plateau amplitude and
Rmax while it increases I50 and the DA notch. All these predictions were clearly confirmed qualitatively and quantita-tively by experimental recordings in the awake state or after injection of an anesthetic to the animal. Our simulations also suggest that the putative RH1691-dependent slow down of GABAA (Mennerick et al. 2010) would modulate the VSD signal but only by ⬍5%. This latter result was nonetheless important to estimate because RH1691 is one of the most used VSD in vivo for the past 15 yr. If the dye action on GABAA would have impacted more strongly the population physiolog-ical response, this could have had major scientific implications. Therefore, it was very important to quantify how much the VSD-induced GABAA slow down (Mennerick et al. 2010) could affect the global VSD signal. Our results unveil that the effect is negligible, clarifying this important issue.
Our general approach is based on three assumptions: 1) the anesthesia level affects GABAA kinetics; 2) enhancing GABAA synaptic inhibition, i.e., prolonging G, affects the network activity; and 3) the VSD signal is sensitive enough to detect those changes in network activity. We will discuss the relevance of these assumptions below.
The effects of anesthetics on brain activity and their under-lying mechanism of action have been of growing interest (Simons et al. 1992; Antkowiak 1999; Heinke and Koelsch 2005; Loepke and Soriano 2008; Alitto et al. 2011; Haider et al. 2013). The anesthesia level affects the inhibitory network in part by prolonging G (Table 2). Our model predicts that this will slow down the rising time constant and fasten the decay time constant of VSD responses. A prediction verified exper-imentally. This opposite effect may be surprising at first glance but underlies the fact that onset and offset are subtended by
different mechanisms, an active recruitment of recurrent net-works followed by a relaxation from sustained activity to return to spontaneous state. This is actually reinforced by results obtained by Bair et al. (2002) and Sit et al. (2009), who have also observed, using single-unit activity in anesthetized monkeys and VSDI in awake monkeys respectively, that onset and offset dynamics obey to different rules, the first one depending on stimulus properties and the latter one not. How-ever, the most striking effect we observed when increasingG is a reduction in response amplitude of the global VSD signal confirming several experimental studies using other recordings in V1 of rodents (Vizuete et al. 2012), cats (Ikeda and Wright 1974; Villeneuve and Casanova 2003), and S1 of squirrel monkeys (Chen et al. 2005), with various anesthetic agents (e.g., desflurane, halothane, isoflurane, and urethane) but also in lateral geniculate nucleus neurons of macaque monkeys (Alitto et al. 2011). Therefore, the two first assumptions we made are reasonable. Importantly, this reduction in amplitude with anesthesia was also observed for sensory-evoked VSD responses with anesthesia in the rat barrel cortex (Devonshire et al. 2010), demonstrating that the VSD signal can capture such changes in network activity. Actually there is now a large set of evidence coming from different laboratories and across many experimental conditions that clearly shows that the VSD signal reflects linearly changes of membrane potential (Cohen et al. 1974; Petersen and Sakmann 2001; Petersen et al. 2003; Ferezou et al. 2006) and nonlinearly changes in spiking rate (Arieli et al. 1995; Jancke et al. 2004; Chen et al. 2012) but also with local field potential or EEG (Arieli et al. 1996; Civillico and Contreras 2005) with a high sensitivity. There-fore, our third assumption is also verified.
The second characteristic of the VSD dynamics affected by the anesthesia level is the semisaturation input rate I50of the input response function, equivalent to the semisaturation con-trast C50of the CRF. Although less abundant, the literature is also consistent with our result. Ikeda and Wright (1974) re-ported an increase in contrast threshold of neurons in the cat V1 under increasing halothane anesthesia. In the monkey, similar observation can only be done across studies when comparing C50values from Geisler and Albrecht (1997) (anes-thetized, C50⬇ 43) and from Nassi et al. (2014) (awake, C50⬇ 28). This effect is specific to the cortex (Alitto et al. 2011). Note that the absolute values of semisaturation constant are different from our experimental values, which is expected since VSD mainly reflects subthreshold activity (Chemla and Chavane 2010).
Another major feature of the VSD response dynamics re-vealed in this study is the early and transient DA notch. Our simulations suggest that the DA dynamics reflect the transient decorrelation in the time course of excitatory and inhibitory cells activities with increasing anesthetic level (Fig. 3B). The VSD literature on mammals is in line with this prediction since DA notch have been reported in the anesthetized cat (Sharon and Grinvald, 2002; Onat et al. 2011a,b) but never observed in the awake behaving monkey (Slovin et al. 2002; Chen et al. 2006; Meirovithz et al. 2010; Reynaud et al. 2012). This dynamics is consistent with rapid sequences of excitation followed by inhibition classically observed in primary sensory areas, e.g., in visual (Anderson et al. 2000), auditory (Wu et al. 2008), or somatosensory (Wilent and Contreras 2004) cortexes, which are very likely to be involved in rapid processing of
cortical responses (Reynaud et al. 2012). Our model acts in a high conductance state (see Chemla and Chavane 2010a, their
MATERIALS AND METHODS) and supports the existence of a
tran-sient shunting mode of inhibition at response onset (Borg-Graham et al. 1998), shaping sensory processing (Monier et al. 2003; Ozeki et al. 2009; Isaacson and Scanziani 2011). This transient increase of inhibition at stimulus onset has also been proposed to reduce trial-to-trial response variability in both anesthetized and awake state (Monier et al. 2003; see Church-land et al. 2010 for a review). Our result suggests that the exact early interplay between excitation and inhibition, a fundamen-tal processing of transient thalamic inputs, is affected by anesthesia and directly reflected in the DA notch characteristic of the VSD signal. The recent paper of Kozyrev et al. (2014) further supported this hypothesis by showing that high-fre-quency repetitive transcranial magnetic stimulation diminishes the DA notch by weakening intracortical inhibition.
Although in full accordance with the literature, we further tested our model predictions experimentally. Consequently, we have measured V1 response to a contrasted drifting grating in awake and anesthetized monkeys in different animals but also a control on the same animal. In the latter, to closely match to the sole manipulation of the parameterGused in our simula-tions, we used an anesthetic agent specific for the GABAA receptor, e.g., midazolam, unlike more general anesthetics classically used in VSDI studies, e.g., isoflurane that also target various other proteins. In the anesthetized protocol, we used an intravenous infusion of propofol, whose main action on GABAergic IPSCs duration has also been reported (see Table 2). Note that testing the general effect of the anes-thesia would probably also result in cognitive impairment that is not supposed to affect the very low-level properties and simple behavioral task (fixation) we tested here. The main effects of GABAA modulation as predicted by our model were all clearly confirmed by experimental data. Importantly, varying the contrast of the visual stimuli now provides preliminary missing data in monkey, directly com-paring the effect of anesthetics (e.g., benzodiazepines in this study) on the contrast response function during the same experiment.
In conclusion, this computational study provides a tool to draw more accurate comparisons of VSD signals across arousal states. As any measure of neuronal response, VSD dynamics is strongly affected by anesthetics levels. One specific feature of the VSD signal, the DA notch, could actually be used as a probe to inspect the early desynchronization between excita-tion and inhibiexcita-tion. Further experiments further scrutinizing this link will be needed. Importantly, our study showed that the effect of the RH1691 dye itself on the functioning of the network is negligible. However, other VSDs, such as the di-4-ANEPPS, might have a stronger impact (Mennerick et al. 2010; see also Grandy et al. 2012). In a next stage, inspecting the impact of excitatory conductances modulations (AMPA, NMDA) may also reveal fundamental aspects of network dynamics (Rangan et al. 2005). This study underlines that care should be taken when comparing functional results acquired across different network states with various techniques. We argue here that realistic biophysical models are an important tool to guide both the interpretation and the relevance of experimental data.
ACKNOWLEDGMENTS
We are grateful to Alain Destexhe, Hamutal Slovin, Amiram Grinvald, and Andrew Meso for helpful discussions on this work. We are indebted to Alexandre Reynaud and Sebastien Roux for help in acquiring new experimen-tal data. The semichronic anesthesia experiments were possible through the great help and advice given by Ivan Balansard, Luc Renaud, and Lionel Velly. Please note that, following pertinent advice by reviewers, the experimental component of this paper was done in a revision stage, hence independently of the model’s predictions that have not changed from the initial submission.
Present address of S. Chemla, Institut de Neurosciences de la Timone (INT), UMR 7289 CNRS & Aix-Marseille Université, 27 Bd Jean Moulin, 13385 Marseille Cedex 05, France.
GRANTS
We acknowledge funding from the European Community (FET Grants FACETS FP6-015879 and BrainScaleS FP7-269921) and the ANR BalaV1 (ANR-13-BSV4-0014-02).
DISCLOSURES
No conflicts of interest, financial or otherwise, are declared by the author(s).
AUTHOR CONTRIBUTIONS
S.C. and F.C. conception and design of research; S.C. and F.C. performed experiments; S.C. analyzed data; S.C. and F.C. interpreted results of experi-ments; S.C. prepared figures; S.C. drafted manuscript; S.C. and F.C. edited and revised manuscript; S.C. and F.C. approved final version of manuscript.
REFERENCES
Alitto HJ, Moore BD, Rathbun DL, Usrey WM. A comparison of visual
responses in the lateral geniculate nucleus of alert and anaesthetized ma-caque monkeys. J Physiol 589: 87–99, 2011.
Anderson JS, Carandini M, Ferster D. Orientation tuning of input
conduc-tance, excitation, and inhibition in cat primary visual cortex. J Neurophysiol 84: 909 –926, 2000.
Antkowiak B. Different actions of general anesthetics on the firing patterns of
neocortical neurons mediated by the gabaa receptor. Anesthesiology 91: 500 –511, 1999.
Arieli A, Shoham D, Hildesheim R, Grinvald A. Coherent spatiotemporal
patterns of ongoing activity revealed by real-time optical imaging coupled with single-unit recording in the cat visual cortex. J Neurophysiol 73: 2072–2093, 1995.
Arieli A, Sterkin A, Grinvald A, Aertsen A. Dynamics of ongoing activity:
explanation of the large variability in evoked cortical responses. Science 273: 1868 –1871, 1996.
Bair W, Cavanaugh JR, Smith MA, Movshon JA. The timing of response
onset and offset in macaque visual neurons. J Neurosci 22: 3189 –3205, 2002.
Banks M, Pearce R. Dual actions of volatile anesthetics on GABAAIPSCs:
dissociation of blocking and prolonging effects. Anesthesiology 90: 120 – 134, 1999.
Binzegger T, Douglas R, Martin K. A quantitative map of the circuit of cat
primary visual cortex. J Neurosci 24: 8441– 8453, 2004.
Borg-Graham LJ, Monier C, Frégnac Y. Visual input evokes transient and
strong shunting inhibition in visual cortical neurons. Nature 393: 369 –373, 1998.
Busettini C, Frölich MA. Effects of mild to moderate sedation on saccadic
eye movements. Behav Brain Res 272: 286 –302, 2014.
Buzás P, Eysel UT, Adorján P, Kisvárday ZF. Axonal topography of
cortical basket cells in relation to orientation, direction, and ocular domi-nance maps. J Comp Neurol 437: 259 –285, 2001.
Buzás P, Kovács K, Ferecskó AS, Budd JM, Eysel UT, Kisvárday ZF.
Model-based analysis of excitatory lateral connections in the visual cortex.
J Comp Neurol 499: 861– 881, 2006.
Capogna M, Pearce R. GABAA,slow: causes and consequences. Trends
Neurosci 34: 101–112, 2011.
Chavane F, Sharon D, Jancke D, Marre O, Frégnac Y, Grinvald A. Lateral
spread of orientation selectivity in V1 is controlled by intracortical cooper-ativity. Front Syst Neurosci 5: 1–26, 2011.