Cell-Matrix Interactions: Collagen-GAG Scaffold Fabrication,
Characterization, and Measurement of Cell Migratory and Contractile
Behavior via Confocal Microscopy
byBrendan A. Harley S.M., Mechanical Engineering
Massachusetts Institute of Technology, 2002 S.B., Engineering Sciences
Harvard College, 2000
Submitted to the Department of Mechanical Engineering in Partial Fulfillment of the Requirements for the Degree of
Doctor of Science in Mechanical Engineering at the
Massachusetts Institute of Technology June 2006
C 2006 Massachusetts Institute of Technology All rights reserved
,A A A IA
Signature
of Author ...
...
...
Department of Mechanical Engineering May 12, 2006
! IZ- J
Certified by ...
Lorna J. Gibson Matoula S. Salapatas Professor of Materials Science and Engineering
/ Thesis Supervisor
Accepted by ... ...
Lallit Anand Chairman, Department Committee on Graduate Students Department of Mechanical Engineering
MASSACHUSETTS INSTITUTE OF TECHNOLOGY
JUL 1 4 286
LIBRARIES
Dedicated to:
My family, friends, colleagues, and all those who have taught, inspired, and shared the experience with me along the way.
Cell-Matrix Interactions: Collagen-GAG Scaffold Fabrication,
Characterization, and Measurement of Cell Migratory and Contractile
Behavior via Confocal Microscopy
byBrendan A. Harley
Submitted to the Department of Mechanical Engineering On May 12, 2006 in Partial Fulfillment of the Requirements for the Degree of Doctor of Science in
Mechanical Engineering
Abstract
Three-dimensional, collagen scaffolds are an analog of the extracellular matrix and are used for many tissue engineering applications. While material and microstructural properties significantly affect overall scaffold bioactivity, the specific influence of construct mechanical properties, composition, and pore microstructure is unknown. In this thesis, experimental and theoretical approaches are employed to systematically examine the independent effect of extracellular features on cell behavior within a series of standardized, well-characterized, collagen-glycosaminoglycan (CG) scaffolds, providing valuable information for designing biomaterials with improved physiological relevance. This thesis also aims to provide experimental and theoretical approaches appropriate for characterizing and describing a wide range of porous biomaterials and for quantifying the effect of extracellular cues on cell behavior within these biomaterials.
CG scaffolds are fabricated via freeze drying. Novel thermal processing conditions were developed to produce two homologous series of uniform, mechanically isotropic CG scaffolds, one with varying pore size and constant stiffness and the other with constant pore size and varying stiffness. The thermal processing conditions and the resultant scaffold microstructure have been modeled using an isothermal coarsening heat transfer model within a conductive mold with interface resistance, allowing fabrication of future scaffolds with engineered microstructures. The mechanical properties, specific surface area, and permeability of the scaffolds have been experimentally measured and theoretically described using a cellular solids framework appropriate for modeling many porous biomaterials. This thesis research has produced a standardized series of CG scaffolds appropriate for quantitative in vitro cell behavior assays. An experimental methodology for measuring cell-generated
contractile forces and cell motility is described and implemented; the independent effect of scaffold pore size and stiffness on the magnitude and kinetics of cell motility within the scaffolds was determined via confocal microscopy. Slight changes in the extracellular environment appreciably
influence cell behavior. Significant effects of cell density, cell type, scaffold microstructure, and scaffold stiffness were observed: cell migration speed increased with decreasing pore size or increasing cell density and increased asymptotically with scaffold stiffness. An improved measurement of the contraction force generated by single dermal fibroblasts (Fc = 26 + 13 nN) within the CG scaffold has also been made.
Thesis Supervisor: Loma J. Gibson
Title: Matoula S. Salapatas Professor of Materials Science and Engineering
-3-Acknowledgements
At the conclusion of this thesis it is important to acknowledge that there have been many people along the way who have enriched and made this work possible. I have enjoyed and truly relished my time at MIT and this has been in no small part due to all those who I have shared the experience with. The nature of my research and thesis has been highly collaborative so there are a multitude of people, facilities, and resources that have made significant contributions.
I first wish to express my deepest gratitude to Prof. Lorna Gibson, who has served as my advisor, doctoral thesis committee chair, and mentor. She gave me the resources and freedom to explore this research topic and guided the development of my experimental, theoretical, and analytical skills. Her experience, insight, and guidance were critical components of my development as an engineer and academic and I truly appreciate the commitment she made to my intellectual and academic maturation.
I would also like to thank Prof. Ioannis Yannas who served as the advisor of my master's thesis and then served as a second advisor and as an active member of my doctoral thesis committee. He constantly reminded me of the importance of understanding the clinical applications of my research and has been one of my most trusted resources throughout my graduate experience.
I am also grateful to Prof. Paul Matsudaira and Prof. Peter So, who served as members of my thesis committee. Although I've only managed to absorb a fraction of their knowledge of biology and imaging, I appreciate their insight and the resources they made available to me throughout this project. I have also been extremely lucky to have the presence of Dr. Myron Spector as a third advisor throughout my time at MIT; his advice and expertise contributed significantly to the development of my experimental and analytical skills. Additionally, I would like to thank Prof. Merton Flemings and Prof. Chris Schuh for their assistance in creating the thermal models to describe CG scaffold fabrication (Chapter 3); what started as a small class project blossomed into a significant technical portion of this thesis with their assistance and encouragement.
A number of collaborators contributed significantly to the technical content of this thesis. I would like to thank Prof. Fergal O'Brien (Royal College of Surgeons in Ireland, Ireland) for his assistance with the initial fabrication, microstructural characterization, and experimental measurements of the specific surface area and permeability of the CG scaffolds (Chapters 2 and 4); Dr. Andrew Lynn (University of Cambridge, UK) for originating and spearheading the mineralized CG scaffold project (Appendix B); and Prof. Alessandro Sannino (University of Lecce, Italy) for helping to develop the spinning protocol to fabricate tubular CG scaffolds (Appendix A). All three have been, are, and will be friends, colleagues and trusted resources. I truly look forward to all we can cook up together over a generation of research and collaboration.
I owe special thanks to Hyung-Do Kim and Dr. Muhammad Zaman for their assistance with all things biological (and moving!) in this thesis (Chapter 6); their help in designing the fluorescent staining protocols, running the confocal microscope, and performing the three-dimensional image processing made the 3D cell tracking experiments possible. I would also like to acknowledge Prof. Krystyn Van Vliet, Kristin Myers, Alan Schwartzman, Prof. Simona Socrate, and the NanoMechanical Technology Laboratory for the facilities and assistance that aided in the mechanical characterization of the CG scaffolds (Chapter 5). Their work, eagerness to help, and friendship have been invaluable and have played a significant role in both this thesis and my academic experience.
I would also like to thank the members of the Fiber and Polymers Lab, Cellular Solids Lab, and the Socrate Lab at MIT as well as the V.A. Tissue Engineering Lab. Particularly, Debbie, Scott, Ramille, Abel, Eric, Karolina, Ricardo, Zach, Asha, Anastassia, Casey, Mark, Toby, Matt, Janet, Juwell, and Yihvan for their friendly conversations, technical assistance, and invaluable support throughout my six years at MIT.
The DuPont-MIT Alliance, the National Institutes of Health (Grant No. DE-13053), the Cambridge-MIT Institute, and the MIT-Whitaker Health Science Fund Fellowship provided financial support for this research.
-5-As much as I have enjoyed my time in lab, I am truly fortunate to have received so much support from my family. I want to thank my parents, Karen and Brendan, for playing an active role in my education, for providing the opportunity to continue my education to this point, and for assisting me along the way: from help learning my multiplication tables in the third grade to help proofreading my doctoral thesis. I also want to thank my brothers Peter and Colin for the hours of Lego fun and other adventures we had together as we grew up. It would have been impossible to reach this point without their help and support.
Most of all, I want to thank my wife, Kathryn Clancy, for being my partner, counselor, and cheerleader. It is so easy to bury your head in work and not notice or appreciate the humanity and world around you. This is my third dissertation we have been through together and I truly notice and appreciate all that she has done over the years to help me become the academic and human I am proud to be. Not only have you read virtually everything - including this tome - I have written and acted as my most trusted resource, confidant, and sounding board for things academic and not, you have also lead by example as a gifted academic, union organizer, campaigner for social justice, and partner. Thank you for your support, kindness, friendship and, most of all, for helping me realize that work was not nearly the most important facet of my life.
Table of Contents
A b stract... 3 Acknowledgements ... 4 'Fable of Contents ... 7 List of Figures ... 13 List of Tables ... 22 List of Equations ... 25Chapter 1. Introduction and Background: Measurement of Cell Traction, Contraction, and Motility ... 31
1.1. The extracellular matrix and extracellular matrix analogs ... 31
1.2. Mammalian response to injury... 33
1.2.1. Defect Scale ... 34
1.2.2. Regeneration versus Repair ... 34
1.2.3. Tissue Triad ... 36
1.2.4. Methods to Treat Loss of Organ Function ... 38
1.2.4.1. Transplantation... 38
1.2.4.2. A utografting... 39
1.2.4.3. Permanent Prosthetic Device ... 39
1.2.4.4. Stem Cells ... 40
1.2.4.5. In Vitro Synthesis ... 41
1.2.4.6. Induced In Vivo Organ Synthesis (Induced Regeneration) ... 42
1.3. Biological length scales ... ... 42
1.4. Studies of cell motility, traction forces, and contraction ... 43
1.4.1. Cell motility and traction forces on 2D substrates ... 44
1.4.2. Experimental measurement of cell behavior in 3D constructs ... 45
1.5. Measuring cell-mediated contraction and migration in 3D collagen-GAG scaffolds ... 47
1.5.1. Choice of experimental construct ... 48
1.5.2. Choice of cell types ... 49
1.6. Thesis organization ... 50
Chapter 2. Fabrication of Collagen-GAG Scaffolds with Uniform, Controllable Microstructures ... 53
2.1. Introduction... 53
2.2. Freeze-drying: A Technological Overview ... 56
2.3. Materials and Methods ... 63
2.3.1. Preparation of collagen-glycosaminoglycan copolymer suspension ... 63
2.3.2. Quenched solidification ... ... ... 64
2.3.3. Effect of mold dimensions and stiffness ... 64
2.3.4. Constant cooling rate solidification: Effect of varying the solidification rate ... 65
2.3.5. Fabrication of CG scaffold with different pore sizes ... ... 67
2.3.6. CG scaffold crosslinking... 68
-7-2.3. 7. Analysis ofpore structure ... ... 68
2.3.8. Environmental scanning electron microscopy ... 70
2.3.9. Micro computed-tomography ... 70
2.3.10. Statistical analysis ... 71
2.4. R esults... 71
2.4.1. Influence ofpan size on pore size ... ... 71
2.4.2. Control of the rate offreezing of the CG suspension ... 73
2.4.3. Constant cooling rate solidification: Influence of rate offreezing on pore microstructure ... 75
2.4.4. Pore structure and anisotropy ... ... 79
2.4.5. Micro CTAnalysis ... 79
2.4.6. Constant cooling rate solidification: Influence offinalfreezing temperature on pore microstructure ... 81
2.5. D iscussion... 85
2.6. Conclusions... 90
Chapter 3. Coarsening-Mediated Solidification is Responsible for Defining the Pore Microstructure of Collagen-GAG Scaffolds: Experimental and Thermal Modeling R esults ... 92... 92
3.1. Introduction... 92
3.2. Fabrication of collagen-glycosaminoglycan scaffolds via lyophilization ... 96
3.2.1. Preparation of the collagen-glycosaminoglycan (CG) co-polymer suspension ... 96
3.2.2. Fabrication of CG scaffold with different pore sizes. ... 97
3.2.3. Thermal conditions during CG scaffoldfabrication ... 98
3.3. Quantitative modeling of CG suspension solidification ... 103
3.3.1. Predominant heat transfer process responsible for solidification ... 103
3.3.2. Biot number and interface resistance ... ... 107
3.3.3. Model of CG suspension solidification in a conductive mold with interface resistance ... 107
3.3.4. Predictive isothermal coarsening model to describe scaffold mean pore size ... 112
3.4. Discussion and Conclusions ... ... 117
Chapter 4. Cellular Solids Modeling of Collagen-GAG Scaffolds: Specific Surface Area, Permeability, and Mechanics ... 121
4.1. Introduction... 121
4.2. Cellular solids model of CG scaffolds ... ... 129
4.3. Materials and Methods ... 132
4.3.1. Fabrication of collagen-GAG scaffolds... 132
4.3.2. CG scaffold crosslinking... 133
4.3.3. CG scaffold specific surface area study... 133
4.3.3.1. Cellular solids model of CG scaffold specific surface area ... 133
4.3.3.2. Experimental measurement of CG scaffold specific surface area via cell attachment .. 135
4.3.4. CG scaffoldpermeability study... 137
4.3.4.2. Experimental measurement of CG scaffold permeability ... 139
4.3.5. Statistical analysis ... 141
4.4. Results . ... 142
4.4.1. Cell adhesion and cellular solids model calculated CG scaffold specific surface area 4.4.1. . Effect of pore si...e on adhesion... ... .. ... ... ... 142
4.4.1.1. Effect of pore size on adhesion ... 142
4.4.1.2. Effect of seeding time on adhesion ... 143
4.4.1.3. Cellular solids specific surface area calculation vs. cell attachment ... 143
4.4.2. CG scaffold permeability: Cellular solids model vs. experimental measurement .... 144
4.4.2.1. Experimental measurement of CG scaffold permeability ... 144
4.4.2.2. Cellular solids model vs. experimental measurement of CG scaffold permeability ... 145
4.5. D iscussion... 148
4.6. C onclusions... 152
Chapter 5. Mechanical Characterization of Collagen-GAG Scaffolds ... 154
5.1. Introduction . ... 154
5.2. Cellular solids description of CG scaffold mechanical properties ... 156
5.3. Materials and Methods ... 161
5.3.1. Fabrication of CG scaffolds with different pore sizes ... 161
5.3.2. Fabrication of CG scaffolds with different degrees of crosslinking... 162
5.3.3. Fabrication of CG scaffolds with different relative densities ... 165
5.3.4. Mechanical characterization of CG scaffolds ... 165
5.3.5. Mechanical characterization of individual struts of CG scaffold ... 170
5.3.6. Statistical analysis ... 172
5.4. Results ... 173
5.4.1. Unconfined compression tests on CG scaffolds ... 173
5.4.2. CG scaffold linear elastic modulus: Effect of mean pore size ... 176
5.4.3. CG Scaffold Linear Elastic Modulus: Scaffold isotropy ... 177
5.4.4. CG scaffold linear elastic modulus: Effect of crosslinking density ... 178
5.4.5. CG scaffold linear elastic modulus: Effect of relative density ... 179
5.46. CG scaffold compressive buckling stress, strain, and collapse modulus ... .. 181
5.4. 7. CG scaffold linear Poisson 's ratio: Effect of mean pore size ... 182
5.4.8. CG scaffold tensile modulus ... 183
5.4.9. CG scaffold strut modulus ... 184
5.5. D iscussion... 185
5.6. C onclusions... 197
Chapter 6. Quantifying Cell Migration and Contraction Behavior in a Series of Characterized Collagen-GAG Scaffolds ... 199
6.1. Introduction... 199
6.2. Materials and Methods ... 201
6.2.1. CG scaffolds with independently variable mean pore size, linear elastic modulus . 201 6.2.2. CG scaffold crosslinking... 202
6.2.3. NR6fibroblast and DU1 45 prostate cancer cell culture techniques ... 203
-9-6.2.4. Confocal imaging of CG scaffold and cell population ... 204
6.2.5. Three-dimensional image analysis ... ... 208
6.2.6. Calculation of cell-mediated contractionforce generated within a CG scaffold ... 212
6.2.6.1. Free-floating contraction assay ... 212
6.2.6.2. Individual cell contraction assay ... 217
6.2. 7. Statistical analysis ... 221
6.3. Results ... 222
6.3.1. CG scaffold microstructural and mechanical properties ... ... 222
6.3.2. Confocal imaging of cell-scaffold interactions ... 225
6.3.3. Time-lapse cell tracking within CG scaffolds ... 227
6.3.4. Cell motility in CG scaffolds: Effect of cell type (NR6 vs. DU-145) ... 232
6.3.5. Cell motility in CG scaffolds: Effect of seeding density ... 233
6.3.6. Cell motility in CG scaffolds: Effect of scaffold mean pore size ... 233
6.3.6.1. Motile fraction ... 233
6.3.6.2. Wind-Rose plot ... 234
6.3.6.3. Mean cell migration speed ... 235
6.3.7. Cell motility in CG scaffolds: Effect of scaffold stiffness ... 236
6.3.8. Cell contraction in CG scaffolds: Measurement of cell-mediated contractionforce238 6.3.8.1. Free-floating contraction assay ... 238
6.3.8.2. Individual cell contraction assay ... 240
6.4. Discussion ... 244
6.5. Conclusions ... 255
Chapter 7. Conclusions ... 257
7.1. Thesis Conclusions ... 257
7.2. Future Work ... 262
Appendix A. Fabrication of Novel Scaffolds for Diverse Tissue Engineering Applications I: Tubular Scaffolds with a Radial Pore Microstructure Gradient Fabricated via Spinning ... 266
A. 1. Introduction ... 266
A.2. Materials and Methods ... 270
A.2. 1. Fabrication of collagen-glycosaminoglycan (CG) scaffolds via lyophilization ... 270
A.2.2. Experimental Spinning Procedure ... 271
A. 2.3. CG scaffold relative density and specific surface area ... 273
A. 2.4. CG scaffold crosslinking ... 274
A.2.5. Morphological Analysis ... 275
A.3. Results ... 275
A.4. Discussion ... 280
Appendix B. Fabrication of Novel Scaffolds for Diverse Tissue Engineering
Applications II: Fabrication of a mineralized collagen-GAG scaffold ... 286
B. 1. Introduction ... 286
B.2. Materials and Methods ... 294
B. 2.1. Preparation of mineralized collagen-glycosaminoglycan co-polymer suspension.. 294
B.2.2. Fabrication of CGCaP scaffold via lyophilization ... 295
B. 2.3. CGCaP scaffold crosslinking ... 296
B. 2.4. Hydrolysis of Brushite to OCP ... 297
B. 2.5. Pore structure characterization via microCT and mercury porosimetry ... 298
B. 2.6. Pore structure characterization and compositional analysis via SEM ... 298
B.2. 7. X-ray diffraction analysis of CGCaP co-precipitates ... 299
B.2.8. Mechanical analysis of CGCaP scaffolds ... 299
B. 2.9. Statistical analysis ... 300
B.3. Results ... 301
B. 3. 1. pH control over CGCaP suspension ... 301
B.3.2. CaP phase within CGCaP triple-co-precipitate suspension ... 302
B.3.3. CGCaP scaffoldpore structure ... ... 302
B. 3.4. CGCaP scaffold mineral distribution ... 304
B. 3.5. XRD analysis of CGCaP suspension, fieeze-dried CGCaP suspension, and CGCaP scaffolds with different cross-linking ... 305
B. 3.6. Mass fraction of CGCaP suspension andJfeeze-dried composite scaffold ... 306
B.3. 7. Hydrolytic conversion of CGCaP composite scaffold CaP phase Jiom brushite to OCP ... 307
B. 3.8. Mechanical characterization of CGCaP scaffold ... 309
B.4. Discussion ... 311
B.5. Conclusions ... 314
Appendix C. Collagen-GAG Scaffold Fabrication and Characterization Protocols ... 3 15 C.1. Collagen-Glycosaminoglycan (CG) Suspension Protocol ... 316
C.2. Collagen-GAG Scaffold Fabrication: Constant Cooling Lyophilization Protocol - Long Version ... 318
C.3. Collagen-GAG Scaffold Fabrication: Constant Cooling Lyophilization Protocol - Short Version . ... 321
C.4. Dehydrothermal Crosslinking Protocol ... 322
C.5. -Ethyl-3-(3-Dimethylaminopropyl)Carbodiimide (EDAC) Crosslinking Protocol ... 323
C.6. Type I Collagen-GAG Tubular Scaffold Fabrication Protocol: Spinning Method ... 325
C.7. CG Scaffold Glycolmethacrylate Embedding Protocol ... 327
C.8. Sectioning the Embedded CG Scaffold Samples Protocol; Aniline Blue Staining Protocol ... 32 9 C.9. CG Scaffold Pore Size Analysis Protocol: Image Acquisition and Linear Intercept Analysis ... 330
C.10. CG Scaffold Mechanical Characterization Protocol - Scaffold Mechanical Tester ... 337
C. 11. CG Scaffold Mechanical Characterization Protocol - Zwick Mechanical Tester ... 343
-11-Appendix D. Cell Culture Protocols ... 345
D. 1. Incubator Disinfection Protocol ... 346
D.2. Complete MEM-a medium for NR6 fibroblasts ... 347
D.3. NR6 Fibroblast Thawing Protocol ... 349
D.4. NR6 FB Cell Feeding Protocol ... 350
D.5. NR6 FB Cell Passaging Protocol ... 351
D.6. NR6 FB Cell Freezing Protocol ... 353
D.7. Preparing CMFDA Fluorescent Stain Stock . ... 354
D.8. Preparing Alexa Fluor Fluorescent Stain Stock . . ... 355
D.9. Alexa Fluor Fluorescently Stained Collagen-GAG Scaffold for Confocal Microscopy 356 D.10. Seeding CMFDA Fluorescently Stained Cells into Collagen-GAG Scaffolds for Confocal Microscopy ... 357
D. 11. CG Scaffold Digestion via Dispase Protocol ... 359
Appendix E. Confocal Microscopy and Three-Dimensional Image Analysis Protocols ... 360
E. 1. Ultraview Live Cell Imager RS3 Confocal Microscope Operation Protocol ... 361
E.2. Three-dimensional Image Analysis Protocol: Imaris XT . ... 365
Appendix F. Material and Equipment Resources . . ... 368
List of Figures
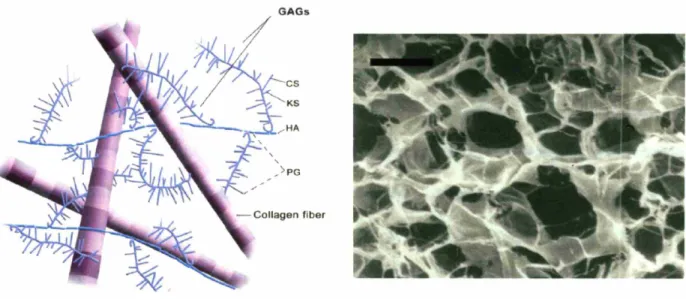
Figure 1.1. Figure 1.2. Figure 1.3. Figure 1.4. Figure 2.1. Figure 2.2. Figure 2.3. Figure 2.4. Figure 2.5. Figure 2.6. Figure 2.7. Figure 2.8.Characteristic organization of the extracellular matrix in tissues and organs (left). Collagen-glycosaminoglycan tissue engineering scaffold (ECM analog, right). Scale bar: 100 Im. (Yannas, Lee, et al., 1989; Yannas, 2001).
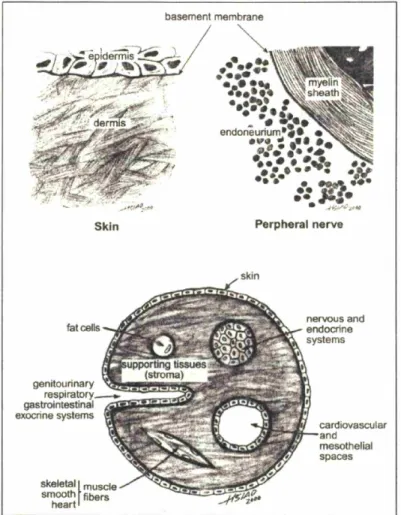
... 32 Schematic of the tissue triad structure observed in mammalian tissue
(Yannas, 2001) ... 37 Experimental measurement of cell traction forces on flexible substrates
from local substrate deformation (Beningo and Wang, 2002) ... 44 Study of cell motility in a 3D Matrigel construct (Zaman, Trapani, et al., In
preparation, 2006) ... 46
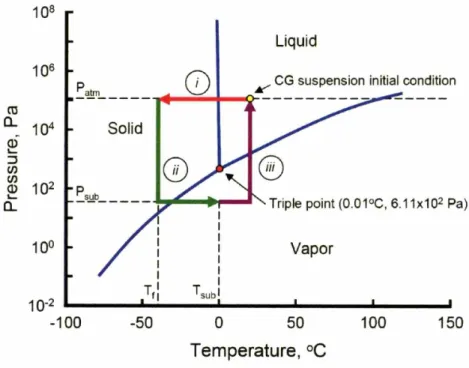
Phase diagram of freeze drying process to produce CG scaffolds ... 58 Freeze dryer temperature and pressure profiles during CG scaffold
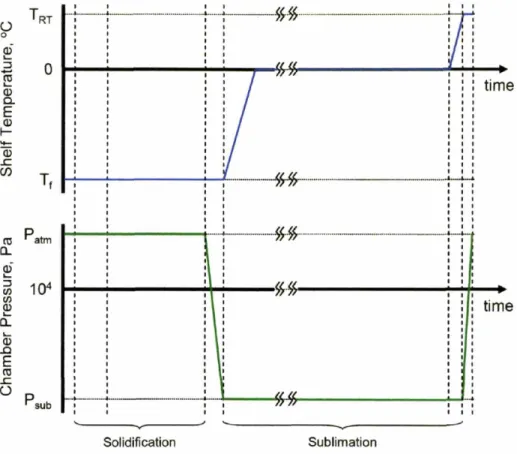
fabrication via quenching ... 60 Freeze dryer temperature and pressure profiles and relevant period of ice
crystal growth and sublimation during CG scaffold fabrication via constant
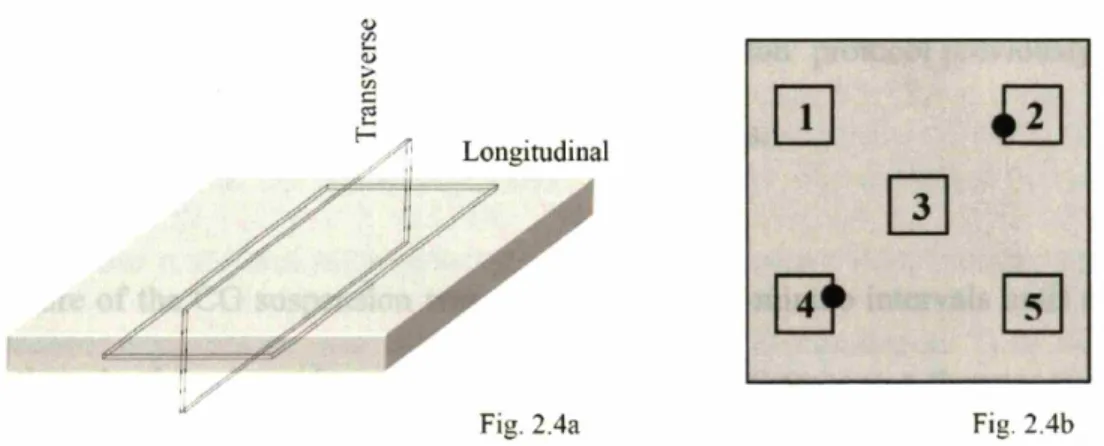
cooling technique ... 62 Schematic of CG scaffold sampling locations. Orientation of longitudinal
and transverse planes used during pore size analysis (Fig. 2.4a) as well as the locations where samples were removed for analysis via the fixed selection protocol (1-5) and the location () of the thermocouples during
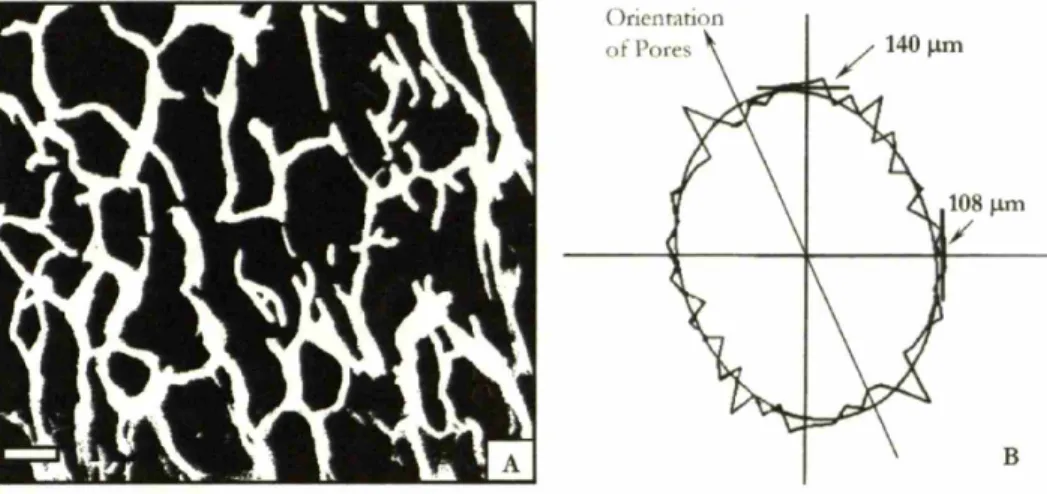
measurement of the freezing kinetics of the CG suspension (Fig. 2.4b) ... 65 Linear intercept analysis of CG scaffold pore microstructure. Characteristic
pore microstructure (scale bar: 100 gm) (A) and best-fit ellipse as reported by linear intercept analysis performed by Scion Imaging software (B) of a CG scaffold fabricated via quenching. The average mean pore size and pore
aspect ratio was 124 gm and 1.3 (ellipsoidal pores) (Freyman, 2001) ... 70 The effect of pan size and stiffness on scaffold mean pore size and
homogeneity (proxy: CV). No 'hotspots' due to variable nucleation were found in scaffolds manufactured in the smaller stainless steel pan, and those scaffolds showed a smaller mean pore size with increased scaffold
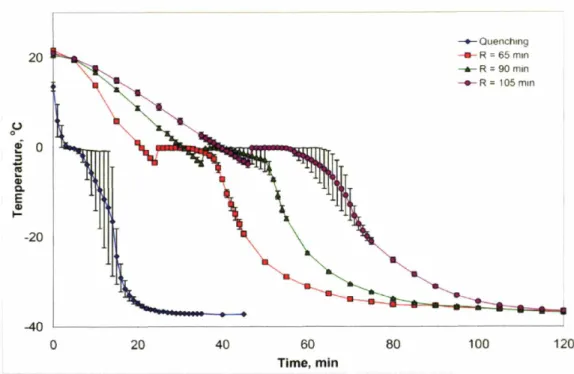
hom ogeneity ... 72 CG suspension thermal profiles during solidification. Average temperature
of the CG suspension during freezing for the four freezing curves (R = length in minutes of the constant cooling period during the freezing
process) ... 74 A series of longitudinal images selected via 'Fixed' selection protocol from
a single CG scaffold sheet produced using the quenching (Fig. 2.8a) and the constant cooling rate technique that displayed the greatest freezing rate homogeneity (0.9°C/min) (Fig. 2.8b). The constant cooling rate technique produced pores with a more uniform size and structure at each sample point
-(locally), and also a more homogeneous nature throughout the scaffold
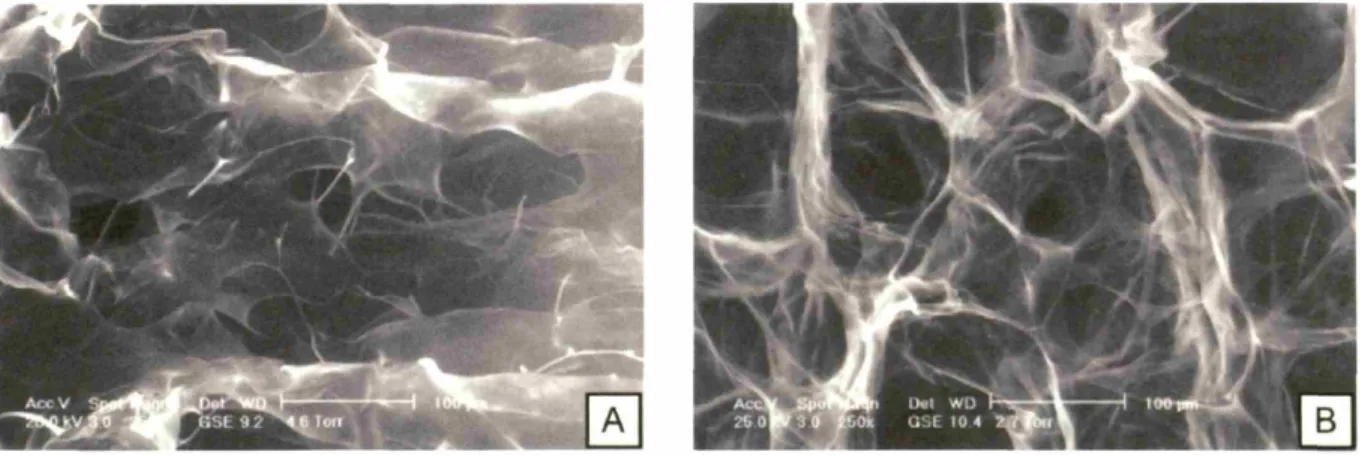
(globally). Scale bar = 300gm ... 75 Figure 2.9. ESEM micrographs of CG scaffolds produced using the quenching
technique in the large pans (Fig. 2.9a) and the constant cooling rate technique (0.9°C/min) in the small pans (Fig. 2.9b) (Pek, Spector, et al.,
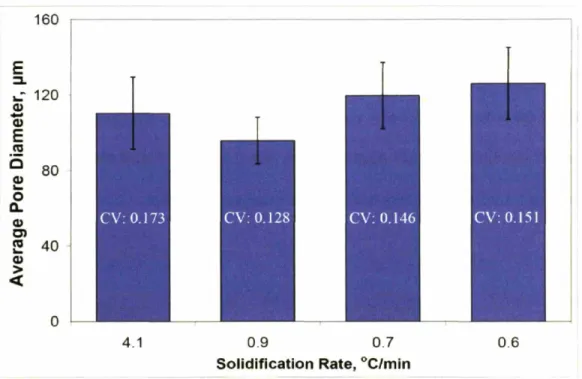
2004) .. ... 76 Figure 2.10. Average pore size for scaffolds fabricated with the quenching (4.1°C/min)
and the constant cooling rate technique (0.9, 0.7, 0.6°C/min) in the small
stainless steel pans ... 77 Figure 2.11. Sheet-to-sheet variability of the mean pore size of three CG scaffolds
produced with an average shelf freezing rate of 0.9°C/min ... 78 Figure 2.12. Analysis of the consistency of the pore microstructure at five locations (A
-E) within a single CG scaffold sheet in the longitudinal and transverse planes for scaffolds produced using quenching (Fig. 2.12a) and the constant cooling rate technique (0.9°C/min) (Fig. 2.12b). Scaffolds manufactured via quenching have mean pore sizes of 114.9 ± 17.7 and 102.7 + 18.6 m, while scaffolds produced via constant cooling have mean pore sizes of 96.8 ± 11.1 and 94.5 ± 13.9 tm in the longitudinal and transverse planes,
respectively ... 80 Figure 2.13. Average temperature of the freeze dryer shelf (Fig. 2.13a) and the CG
suspension (Fig. 2.13b) during freezing for the four constant cooling rate
freezing protocols ... 82 Figure 2.14. Effect of final freezing temperature on CG scaffold mean pore size.
One-way analysis of variance (ANOVA) showed that final freezing temperature has a significant effect on the mean pore size (p < 0.001) of CG scaffolds
produced using this freeze-drying technique. ... 83 Figure 2.15. Light micrographs (transverse plane) of CG scaffolds fabricated at four
distinct final freezing temperatures. Scaffolds fabricated at a lower final
freezing temperature exhibit a smaller mean pore size. Scale bar = 100 nm... 84
Figure 3.1. SEM image of collagen-GAG (CG) scaffold, mean pore size 95 m,
99.4% porosity (Pek, Spector, et al., 2004) ... 93 Figure 3.2. Average temperature of the freeze dryer shelf (Fig. 3.2a) and the CG
suspension (Fig. 3.2b) during the four constant cooling rate freezing
protocols ... 99 Figure 3.3. Average temperature of the CG suspension (Error bar: Half the difference
between two temperature readings) during solidification for scaffolds
fabricated using the quenching and constant cooling rate thermal processes ... 100 Figure 3.4. Local solidification time (ts) and the shelf thermal profile (To(t)) during
solidification. The region denoted "local solidification time" corresponds to time for solidification value given in Table 3.2. Regression of the shelf
temperature over that region determined To(t) (Table 3.4) ... 102 Figure 3.5. Schematic of the three modes of heat transfer during the freezing process:
Figure 3.6. Figure 3.7. Figure 3.8. Figure 3.9. Figure 3.10. Figure 4.1. Figure 4.2. Figure 4.3. Figure 4.4. Figure 4.5. Figure 4.6. Figure 4.7. Figure 4.8.
through the pan into the chamber atmosphere (green), or convection into
the chamber atmosphere (blue). ... 105 Temperature distribution in the mold (pan, freeze dryer shelf, To(t)) and the
CG suspension during solidification via the temperature ramping protocol
in a conductive mold with interface resistance. ... 108 Experimentally observed vs. calculated (via conductive mold with interface
resistance model) CG suspension solidification times ... 111 Relationship between the measured local solidification time and the
scaffold mean pore size for CG scaffold system ... 114 Comparison between measured local solidification time and scaffold mean
pore size and prediction made using the isothermal coarsening model (Eq. 3.15, solid line) (Fig. 3.9a). Relationship between local solidification time and mean dendrite arm spacing (size) in Al-Cu(4.5%) (Eq. 3.15, solid line)
(Fig. 3.9b) ... 116
Thermal and pressure profiles of CG scaffold fabrication via constant cooling rate technique. Freeze dryer temperature and pressure profiles, CG suspension thermal profile, and relevant period of ice crystal nucleation (i),
coarsening (ii - iii), and sublimation (iv - v) ... 119
The geometry and packing of the hexagonal prism (left) and tetrakaidecahedral (right) unit cells. The tetrakaidecahedral unit cell has
been used to model the CG scaffold microstructure. ... 132 The device utilized in this study to measure the CG scaffold permeability
(fluid mobility) (Waller, McMahon, et al., 2004) ... 140 Percentage of MC3T3 cells attached to the CG scaffolds at 24 and 48 hours
post seeding... 143 Attached cell number plotted against specific surface area showing a strong
linear relationship at 24 (solid line) and 48 hours post seeding (dashed line).
... 144
Experimentally measured scaffold permeability (fluid mobility) as a
function of pore size and applied compressive strain ... 145 Power regression between scaffold permeability (fluid mobility) (K) and
mean pore size (96 - 151 gpm) for all four levels of applied compressive strain (0 - 40%), testing the relationship proposed by the cellular solids
m odel: K a d2 ... 146 Power regression between scaffold permeability (fluid mobility) (K) and
applied compressive strain (: 0 - 40%) for all four scaffold variants (Mean pore size: 96 - 151 m), testing the relationship proposed by the cellular
solids model: K a (1 - ... 146
Comparison between the experimental results (Kmeas) obtained and the predicted values obtained from the mathematical model (Kaj,) for CG
scaffold permeability (fluid mobility) under varying compressive strains ... 148
-Figure 5.1. Figure 5.2. Figure 5.3. Figure 5.4. Figure 5.5. Figure 5.6. Figure 5.7. Figure 5.8. Figure 5.9. Figure 5.10. Figure 5.11.
Schematic uniaxial stress-strain curve for an elastomeric cellular solid in compression showing linear elastic, collapse plateau, and densification regimes as well as the linear elastic modulus (E) and plateau stress (Gel)
(Gibson and Ashby, 1997) ... 158 An axisymmetric unit cell with R = 1 (el = e2 = e3 = 1) (Fig. 5.2a); an
axisymmetric unit cell with R = 1.5 (el = e2 = 1; e3 = h) (Fig. 5.2b) ... 160
Crosslinking mechanism between collagen and GAG induced by dehydrothermal treatment (Fig. 5.3a) and by carbodiimide treatment (Fig. 5.3b) (Yannas and Tobolsky, 1967; Lee, Grodzinsky, et al., 2001; Lynn,
2005) ... 164
Custom mechanical testing device built on the NanoTest600 Micro/Nanoindenter motor platform using a precision load cell; all tests were performed at a strain rate of dc/Pt = 0.001/sec to a maximum strain:
Ema, = 0.95 ... 168
Experimental arrangement to perform bending tests on individual CG scaffold struts (Fig. 5.5a). Simplified beam bending system utilized to calculate CG scaffold strut modulus (Es) in terms of experimentally
measured parameters (dt, d2, Kcantilever) (Fig. 5.5b) ... 171
Characteristic stress-strain curves observed for the dry (Fig. 5.6a, b) and hydrated CG scaffold variants (Fig. 5.6c, d) showing the full stress-strain curves for the entire compression test (: 0 - 0.95, Fig. 5.6a, c) and increased detail of the linear elastic region (: 0 - 0.60, Fig. 5.6b, d). Distinct linear elastic, collapse plateau, and densification regimes were observed for the CG scaffolds (regimes approximately demarked by individually shaded regions) regardless of scaffold mean pore size, relative
density, crosslinking density, loading direction, or level of hydration ... 173 Calculation of the linear elastic modulus (E*), the elastic collapse stress and
strain (el*, el ), and the collapse plateau modulus (Aa/Ae) for a typical
compression test ... 174 Linear elastic modulus (E*) of the dry (Fig. 5.8a) and hydrated (Fig. 5.8b)
CG scaffold variants (96 - 151 m mean pore size; DHT crosslinking;
0.006 relative density)... 176
Normalized E of structurally homogeneous CG scaffold (96 glm mean pore size; DHT crosslinking; 0.006 relative density; dry) from tests in three orthogonal directions. E* for each of the three axes (E , E, E z ) was normalized by the modulus from the standard test direction (E z * = 208 ±
41 Pa) ... 178
Normalized E* of structurally homogeneous CG scaffold sheet (96 ,um mean pore size; 0.006 relative density; hydrated) with samples crosslinked using each of the five crosslinking treatments (Table 5.2). E for each of the
crosslinking treatment (ENX*, EDHT105/24*, EDHT120/48*, EEDACI:1:5, EEDAC5:2:1*)
was normalized by the standardized crosslinking treatment (EDHT105/24* = 208 41 Pa). The normalized stiffness of each treatment is displayed above
each data bar ... 179 Normalized E* of CG scaffolds (Tf = -400C; DHT crosslinking; dry)
Figure 5.12. Figure 5.13. Figure 5.14. Figure 5.15. Figure 5.16. Figure 5.17. Figure 5.18. Figure 5.19.
for each of the relative densities (Eo006 , E.0 09o, E0012 , E0.018 ) was
normalized by the standard relative density (Eooo06 , 1.0x = 208 + 41 Pa).
Normalized regression curve from Eq. 5.8 is also plotted ... 180 Side-view of CG scaffold (121 gim mean pore size; DHT crosslinking;
0.006 relative density; hydrated) under uniaxial compressive strain at c: 0.00 (left), 0.20 (Linear-elastic, collapse plateau regime transition, middle), and 0.40 (collapse plateau regime, right). The yellow dashed line
corresponds to the initial scaffold dimensions ... 182 Characteristic stress-strain curve observed for the hydrated CG scaffold
variants (96 m mean pore size; 0.006 relative density; DHT crosslinking; hydrated; x-y plane loading) under tensile testing showing initial elastic regime followed by stiffening characteristic of cellular solids under tensile
loading ... 183
Characteristic load-unload curve for bending tests performed via AFM on
individual CG scaffold struts ... 184 Open-cell and closed-cell model predications and experimental results for a
comparison of the normalized scaffold density (p* /s) and modulus (E*/Es). The open-cell model predicts the relationship (E*/Es) (p /ps)2; the
closed-cell model predicts the relationship (E*/Es) - 0.32 (p/lp,)' for low relative densities (Gibson and Ashby, 1997; Simone and Gibson, 1998). The
relationship (E*/Es)- (p*/)09518 was found for the experimental results ... 187 Open-cell and closed-cell model predications and experimental results for a
comparison of the normalized scaffold density (p*/ps) and collapse stress
(oel*/Es). Cellular solids relationships from Gibson and Ashby, 1997 ... 188 SEM images of CG scaffolds with three distinct relative densities (p*/ps:
0.006, 0.012, 0.018) at low (20x: Fig. 5.17a/c/e) and high (100x: Fig. 5.17b/d/f) magnification. Non-uniform solid content distribution, regions of reduced density denoted by red ellipses and regions of increased density denoted by yellow ellipses, is observed in the higher density (p*/Ps: 0.012, 0.018) CG scaffolds. Some SEM images (Fig. 15a/c/e) courtesy of Janet
Leung (M IT) ... 189
CG scaffold "air side" vs. "pan side." SEM images taken normal to the "air side" (Fig. 5.18a, 5.18c) and "pan side" (Fig. 5.18b, 5.18d) surface showing higher density scaffold (brighter image under backscatter detector) and the presence of some closed cells on the "air side." Cross sectional SEM images of CG scaffold showing "aid side" (Fig. 5.18e, region defined by yellow arrows) and "pan side" scaffold surface (Fig. 5.18f). Scale bars: 1
mm (Fig. 5.18a, 5.18b, 5.18e, 5.18f), 100 gm (Fig. 5.18c, 5.18d) ... 193
Mechanistic explanation for the observed discrepancy between the elastic modulus of the CG scaffolds under compressive loading normal to the plane of the scaffold sheet (Fig. 5.19a), tensile loading in the plane of the scaffold (Fig. 5.19b), and compressive loading in the plane of the scaffold
sheet (Fig. 5.19c) ... 194
-17-Figure 6.1. Figure 6.2. Figure 6.3. Figure 6.4. Figure 6.5. Figure 6.6. Figure 6.7. Figure 6.8. Figure 6.9. Figure 6.10. Figure 6.11. Figure 6.12. Figure 6.13.
The two intracellular reactions of the CellTracker Green CMFDA reagent (the non-reacted form of CMFDA is shown in the left-most image). Although the dye may react with intracellular glutathione first, the product is nonfluorescent until acted upon by intracellular esterases, shown here as
the first reaction (Zhang, Olson, et al., 1992) ... 205 Multiple experimental volumes, each 246 x 364 x 100 gim, were imaged at
15 minute intervals during cell tracking experiments (Fig. 6.2a). Within each volume, 101 images were taken at 1 m spacing (colored planes) to
assemble a three-dimensional description of cell motility (Fig. 6.2b) ... 208 Conventional Wind-Rose plot for meteorological applications of wind
conditions at airports in the southeastern United States
(Westinghouse_Savannah_River_ Company, 2002) ... 211 Experimentally observed free-floating contraction of CG scaffolds (Fig.
6.4a, left); cylindrical coordinate representation of scaffold contraction (Fig. 6.4a, right). Representative scaffold volume described by Cartesian
coordinates (Fig. 6.4b) ... 213 Material constants associated with the linear elastic and collapse plateau
regimes of the CG scaffolds considered for the free-floating contraction
assay ... 215
Elastic buckling in the cell edges of an open-cell foam (Fig. 6.6a) (Gibson and Ashby, 1997) and for a hexagonal honeycomb (Fig. 6.6b) (Gibson and
Ashby, 1997; Onck, Andrews, et al., 2001) ... 218 Application of a critical buckling load (Fc) to a scaffold strut within an
idealized CG scaffold network (left). Deformed configuration of the idealized CG scaffold strut; the three attached struts prevent rotation of the buckling strut edges (middle). Simplified model of CG scaffold strut buckling where the scaffold strut is retrained at its ends with a rotational
spring (right) ... 219 Linear elastic modulus (E*) of the CG scaffold variants (96 - 151 pm mean
pore size; DHT105/24 crosslinking; 0.006 relative density; hydrated) ... 222 Normalized E* of structurally homogeneous CG scaffold sheet (96 m
mean pore size; 0.006 relative density; DHT105/24, EDACI:1:5,
EDAC5:2:1 crosslinking; hydrated)... 224 Multi-dimensional studies of cell behavior using the CG scaffold variants ... 224 Three-dimensional reconstruction of NR6 FBs within a CG scaffold (121
im mean pore size; 0.006 relative density; DHT crosslinking) at four
distinct angles of rotation (i - iv). Field of view: 246 x 364 x 100 jim ... 226 Three-dimensional reconstruction of NR6 FBs within a CG scaffold (121
gm mean pore size; 0.006 relative density; DHT105/24 crosslinking). Increasingly selective regions (bottom left, right, respectively) from the full
imaged volume (246 x 364 x 100 jim field of view, top) are shown ... 227
Time lapse fluorescent images (0, 1.5, 3, 4.5, 6, 7.5 hours: 1 - 6) of NR6
FB distribution in CG scaffold (96 gim mean pore size; 0.006 relative
Figure 6.14. Figure 6.15. Figure 6.16. Figure 6.17. Figure 6.18. Figure 6.19. Figure 6.20. Figure 6.21. Figure 6.22. Figure 6.23. Figure 6.24. Figure 6.25. Figure 6.26. Figure 6.27. Figure 6.28. Figure 6.29.
Time lapse three-dimensional reconstructions (0, 1.5, 3, 4.5, 6, 7.5 hours: 1
- 6) from Figure 6.13 of NR6 FBs distribution in CG scaffold (96 gim mean
pore size; 0.006 relative density; DHT105/24 crosslinking) ... 229 Spot tracking technique to measure cell migration speed and display
individual cell movement in 3D within a CG scaffold variant (96 gm mean pore size; 0.006 relative density; DHT105/24 crosslinking) from Figure 6.14. A single time point (2.5 hours) is shown, but the color coded cell tracks (blue -* white) indicate movement of each spot during the entire
experimental period (0 -, 10 hours) ... 230 Average migration speed (Mean ± SEM) of NR6 FBs vs. DU-145 prostate
cancer cells ... 232 Average migration speed (Mean i SEM) of NR6 FBs seeded at distinct
densities (1 E5: 1 x 10⁵ cells/scaffold, 5E5: 5 x 10⁵ cells/scaffold) ... 233
Effect of scaffold mean pore size on motile fraction of NR6 FBs ... 234 Effect of scaffold mean pore size on distribution of NR6 FBs motility, as
depicted via a Wind-Rose plot (x, y, z axes: ± 50 glm). Image and analysis
courtesy of Hyung-Do Kim, MIT ... 235 Effect of scaffold mean pore size on the average migration speed (Mean ±
SEM) of NR6 FBs ... 236 Independent effect of scaffold crosslinking treatment on the average
migration speed (Mean ± SEM) of NR6 FBs . ... 237 Effect of scaffold strut stiffness on the average migration speed (Mean +
SEM) of NR6 FBs ... 238 Measurement of synovial cell contraction of CG scaffolds. Temporal
change in CG scaffold diameter (d) for unseeded and synovial cell seeded scaffolds (Fig. 6.23a). Calculated radial strain (r) applied to CG scaffold by synovial cells (dseeded - dunseeded) using free-floating contraction assay
(Fig. 6.23b) ... 239 Calculated radial strain (rr) applied to CG scaffold by NR6 FBs using
free-floating contraction assay... 240 Time lapse light microscopy images of individual dermal fibroblasts (Fig.
6.25a, 6.25b) buckling a CG scaffold strut. Red dotted line highlights the FB while the blue dotted line identifies the strut the FB is buckling. Scale
bars: 50 gm ... ... 243 Cellular solids description of changes in scaffold strut thickness and length
with changes in mean pore size ... 248 Tetraikaidecahedral unit cell (left). Comparative length scale of NR6 FBs
vs. mean pore size ... 250 Correlation between observed NR6 FB migration speed with the spacing
(Fig. 6.28a) and density of strut junctions (Fig. 6.28b) ... 252 Comparison of cell-mediated contraction process resulting in rapid
detachment from the scaffold strut due to focal adhesion - ligand rupture using confocal (left) and light (right) microscopy techniques. The
associated focal adhesion "pad" is highlighted in both sets of images ... 254
-19-Figure A.1. Figure A.2. Figure A.3. Figure A.4. Figure B.1. Figure B.2. Figure B.3. Figure B.4. Figure B.5. Figure B.6.
Schematic of the spinning apparatus ... 273 SEM images of the tube cross section. a) Full cross section: R = 0 rpm, Ts =
0 min., Tf = 1 min., b) full cross section: R = 5000 rpm, Ts = 1 min., Tf = 1 min., c) full cross section and higher magnitude image of the cross section central area: R = 5000 rpm, Ts = 3 min., Tf = 1 min., d) bottom half of the cross section: R = 5000 rpm, Ts = 5 min., Tf = 1 min., e) upper half of the
cross section: R = 30000 rpm, Ts = 15 min., Tf = 2 min ... 277 Cross-sectional SEM images of the tube wall: R = 30000 rpm, Ts = 15 min.,
Tf = 2 min. (100x) b) Higher magnification (200x) image of the internal and central portion of the tube wall, showing the highly aligned pore structure, c) Increased magnification (500x) image of the internal portion of the tube wall, d) Higher magnification (500x) image of the external portion of the tube wall, showing significantly smaller pores with a greater solid
volume fraction ... 279 Potential outcomes of in vivo study of cell migration during peripheral
nerve regeneration ... 284
pH variation of CGCaP suspension due to calcium phosphate (CaP wt% 20, 40, 60, 80%) and GAG content (GAG:collagen mass ratio of 0.00, 0.09, 0.18). The collective average pH for all CGCaP suspension is 3.23 +0.06,
comparable to the target pH of 3.2 (dashed line) ... 301 CaP phase map schematically representing the CaP phase for the
CaP/collagen suspension found at each of the 36 combinations of pH and
temperature tested ... 302 SEM images of gross scaffold morphology (Fig. B.3a) and local pore
microstructure (Fig. B.3b) of the CGCaP scaffold. An open-cell foam-like
structure with interconnected pores is observed ... 303 Cross sectional X-ray microtomographic of the CGCaP scaffold at two
distinct locations (Fig. B.4a, B.4b); a homogeneous pore structure and mineral distribution is observed throughout the thickness of an 8.5 mm
thick scaffold. Scaffold cross-section diameter: 9.25 mm ... 304 EDX analysis of scaffold disks show an even distribution of both calcium
(Ca) and phosphorous (P) throughout the CGCaP scaffold. Scale bar: 1 mm.
... 305
XRD analysis of CGCaP suspension and freeze-dried CGCaP constructs before and after crosslinking. Fig. B.6a. XRD patterns for brushite content of CaP phase in CGCaP suspension (direct precipitation suspension) and following freeze-drying. No effect of freeze-drying was observed on the mineral content or character. Fig. B.6b. XRD patterns for (i) uncrosslinked CGCaP composites, (ii) EDAC crosslinked and (iii)DHT crosslinked composite scaffolds.. Note that the XRD pattern for the DHT crosslinked composite shows characteristic peaks of monetite with virtually no trace of brushite while EDAC crosslinked composites shows characteristic peaks
Figure B.7. Figure B.8. Figure B.9. Figure C.1. Figure C.2. Figure C.3. Figure C.4. Figure C.5. Figure C.6. Figure C.7. Figure C.8. Figure C.9.
Observed vs. predicted CaP mass fraction in CGCaP suspension and
freeze-dried CGCaP composite ... 307 Conversion of CGCaP composite Ca phase from brushite to OCP. Fig. B.8a.
Progression of hydrolytic conversion of EDAC crosslinked CGCAP composite (80% wt% CaP - brushite, GAG:collagen weight ratio 0.09). Fig. B.8b. Time for full conversion of brushite to OCP for all mass fractions of CaP (0 - 80 wt%). Note: Full conversion assessed by extinction of brushite
peak at 11.6° 20 ... 308 Compressive stress-strain curves for dry and hydrated (PBS) CGCaP
scaffolds. Fig. B.9a. Behavior of EDAC-crosslinked mineralized collagen/GAG scaffolds under compressive loading in the dry state. Fig. B.9b. Behavior of EDAC-crosslinked mineralized collagen/GAG scaffold
under compressive loading in the hydrated state ... 310
Schematic of the spinning apparatus used to fabricate tubular CG scaffolds ... 326 Image (left) and schematic (right) of the 25 gm load cell used to perform
unconfined compression test on the CG scaffold (Images from Transducer
Techniques) ... 338 Schematic of the aluminum bracket that attaches directly to the
M icro/Nanoindenter motor stage ... 338 Schematic of the intermediary bracket that attaches directly to the 25 gm
load cell (Transducer Techniques, Figure C.2) and to the
Micro-Nanoindenter motor stage through the bracket shown in Figure C.3 ... 339 Schematic of the aluminum base plate that attaches to the base of the
Micro/Nanoindenter and provides a stable surface on which to perform
mechanical tests ... 339 Schematic of the aluminum sample holder that sits on the base plate (Figure
C.5) and holds to CG scaffold disk for unconfined compression tests ... 340 Schematic of the low-mass compression platten that attaches to the 25 gm
load cell and is used to perform unconfined compression tests ... 340 Front panel of the custom LabVIEW VI used to acquire load data during
mechanical characterization of the CG scaffolds using the
M icro/Nanoindenter motor stage ... 341 Rear panel of the custom LabVIEW VI used to acquire load data during
mechanical characterization of the CG scaffolds using the
M icro/Nanoindenter motor stage ... 342
-Freezing rate of CG suspension and the liquid-solid transition time during
solidification ... 74 Mean pore size and relative density of the four CG scaffold variants ... 85
Table 3.1. Mean pore size and relative densities of CG scaffolds fabricated at different
final freezing temperatures (Mean + StDev) ... ... 96 Table 3.2. Thermal processing conditions, average suspension freezing rate, and the
solidification time for the CG suspension during processing ... 102 Table 3.3. Relevant parameters for modeling CG suspension solidification time with
quenching ... 104 Table 3.4. Temperature of the freeze dryer shelf (To(t), Fig. 3.4) during CG
suspension solidification ... 109 Table 3.5. CG suspension material properties and constant of proportionality (A') for
the calculation of scaffold mean pore size (d) using the isothermal
coarsening model (Flemings, 1974; Poirier and Geiger, 1994) ... 115
Table 4.1. Permeability of a variety of tissue engineering scaffolds as reported in the
literature ... 127 Table 4.2. CG scaffold variants utilized for permeability and specific surface area
investigation ... 133 Table 4.3. Experimentally measured (Kmeas, Mean ± StDev) and cellular solids model
derived (Kcalc) fluid mobility of the four CG scaffold variants under four levels of compressive strain ( = 0, 14, 29, 40%). Units for K are 1 x 10⁻¹⁰
m 4 /N s . ... 147
CG scaffold variants utilized for permeability and specific surface area
investigation ... 161 Results of mechanical characterization of CG scaffold variants. Except for
the specific parameter being tested in each section, all scaffold characteristics were kept constant (96 gm mean pore size; 0.006 relative density; DHT105/24 crosslinking; dry; z-axis compression). Results are reported as Mean t StDev for the tests of the effect of mean pore size (dry and hydrated). All other results are reported as normalized Mean ± CV; the standard values reported in the top row of each test results (shaded, italicized) correspond to other italicized data series (i.e., DHT105/24 for the test of the effect of crosslink density). , **, and *** denote distinct,
statistically significant results ... 175 Average (Mean St. Dev.) mechanical properties of the CG scaffold
variants (results independent of mean pore size). The 151 m mean pore size scaffold showed a statistically significant increase in linear elastic
List of Tables
Table 2.1. Table 2.2. Table 5.1. Table 5.2. Table 5.3.modulus and collapse stress; these values, likely due to scaffold structural
anisotropy, were not used to calculate average mechanical values ... 177 Table 5.4. Poisson's ratio (Mean StDev) over the linear elastic regime for the dry
CG scaffold variants (96 - 151 gim mean pore sizes; DHT crosslinking;
0.006 relative density) with four distinct mean pore sizes ... 183 Table 5.5. Comparison of normalized scaffold density (p*/Ps) and modulus (E*/Es, Es =
762 35.4 MPa) for CG scaffold variants. A comparison between the experimental results (meas) and those predicted using a low-density,
open-cell m odel (m odel) ... 186
Table 6.1. CG scaffold variants utilized for permeability and specific surface area
investigation ... 202 Table 6.2. Average (Mean St. Dev.) mechanical properties of the CG scaffold
variants (96 - 151 m; 0.006 relative density; DHT105/24 crosslinking;
hydrated) .. ... 223 Table 6.3. Average cell migration speeds within the CG scaffold variants. Except for
the specific parameter being tested in each section, all scaffold characteristics were kept constant and are specified in the header of each experiment. Results are reported as Mean, StDev, and SEM for each migration speed. , *, and denote distinct, statistically significant results
compared to the first value in each experimental group ... 231 Table 6.4. Calculations of Fc from light micrograph images. References are provided
for all images analyzed ... 244
Fabrication conditions and gross morphological structure of the five different types of scaffolds fabricated using the spinning technique. The top four devices are part of a homologous series while the fifth device
represents a more severe spinning protocol. ... 276 Relative density and specific surface area of the five different types of
scaffolds fabricated using the spinning technique ... 280
Freeze dryer program to fabricate CG scaffolds with a 96 m mean pore
size ... 319 Freeze dryer program to fabricate CG scaffolds with a 110 m mean pore
size ... 319
Freeze dryer program to fabricate CG scaffolds with a 121 m mean pore
size ... 319
Freeze dryer program to fabricate CG scaffolds with a 151 m mean pore
size . ... 319
Typical dehydrothermal crosslinking conditions used on CG scaffolds ... 322 Calibration scales for Scion Image for the camera/microscope assembly in
8-102 ... 330 23 -Table A.1. Table A.2. Table C.1. Table C.2. Table C.3. Table C.4. Table C.5. Table C.6.
Table D.1. MEM-a medium recipe for the parental NR6 fibroblast cell line (without G418 in the medium) or for NR6 fibroblasts expressing WT EGFR (with
List of Equations
Equation 3.1. Equation 3.2. Equation 3.3. Equation 3.4. Equation 3.5. Equation 3.6.AT
kl w Tsuspen -TshelfQ dcondpan A-= Ax kAx+ Ax ...
AT Tsuspen
T-aTi
Qcond,panside
=k.A
=k.2.(l.M
+w.M).
ue rAx Ax
105
106
Qconvect = hA(Tuspen -Tshef
)
=h
(Tpen-Tshelf ) ... 106Bi =
Ax
I(n7
k
qlxo = k. TM - TsM
... 109ql
X=o
=h (Ts - To (t)) ...
109 Equation 3.7. ql x = ql X=Ms TM - TO(t) 1/h+M/k ... Equation 3.8. q x=Ms Equation 3.9.dM
= p'.Hf
dT
110
d T ...
p'-H
am
TM -To (t)/h + M/k' ... ... ... 11011h
+ Mlkl
Equation 3.10.J(PH
.[TM -TO
(t)])at
= 1 +0p'.Hf
k' ... 110 Equation 3.11.h
tc
P'Hf
0
- T
O(t))t =
M+
h
M
2
2 k ' ...
Equation 3.12. Equation 3.13. Equation 3.14. d3 - d 3 = A tc ... 113 d3 A t ... 113 d"n
A -t .. . . . ... 113 25 -110 111 .vLP
.Hf *CL
.(-k).m
Equation 3.15. tc o.DL TL Equation 4.1. Equation 4.2. Equation 4.3. Equation 4.4. Equation 4.5. Equation 4.6.k
K=k
PU ... 124 P.=$F = 1- pVF ...
130
SA 3.5... 134 SA 0.258... 134
d = 2.78 · 1 ... 135 SA 0.718 V d ... 135 V d Equation 4.7. Equation 4.8. k = A)d 2 I J,O3K= -. d2.
At ... 137 =A"d 2 . 1- ... ... 137 / Equation 4.9. Equation 4.10. domss (- - )...
...
138
k
2
2.785
(1 )2 2 ( P )2 138 Equation 4.11.K=A(
285
d
2.785 ... 138 Equation 4.12.k=Qp
A...140
AP.A
Equation 4.13.k= 324.8(Q..
1-u)
r
2p
... 141 L 3 - .9 3 .. . = , JI I. -L4 - ZX _4 ... I II Q ·Y( 1P~~~~s1"
k _ 324.8(Q. 1) Equation 4.14. K =
-
32
r
2P
Equation 5.1. Equation 5.2. Equation 5.3. Equation 5.4. Equation 5.5. Equation 5.6. Equation 5.7. Equation 5.8. Equation 5.9. ... 141-
-I - cc-=C 1-' 157Ps
V Ms
13 1 ... *E 2RjE
2R.2
Erel = - ) 3* .161... ... 161 1+ d = dt- d2 ... 170 F = Kanilever d2 (5.6a) F= 3 EsI-d
l_ (5.6b) ... 172 x3 64 -(Kcantlever d2)x
3(56c)
= 3.r.D 4 .(d, -d 2) (5.6c) ln(E*)=0.9518-1n P-P- +15.215 ... ... 180KPS)
E* =4.05 X 10⁶ Pa . ... 181 .* 0.9473 181 re = 6.6 5 x 10Pa ()... ... 181 . 1.867Equation
5.10. Ar/Ae=1.58xlO
8Pa P
PsEquation 5.11. Escaffold .Ehole
Escaffold Vhole + Ehole ' Vscaold
27
-182
Escaffold = Es
Equation 5.12. Ehole = 0.2 Escaffoldi'ks) Vscaffold = X Vhole = I - X Equation 5.13. Equation 5.14. Equation 5.15.
E
compression*
E1 · E2 E, · E2 3.2=bl 02*b.195
3.2-b-1
0.2.b.-
.
...
E 3 + E2 .3.4.b l
3.4.b l
Ecompression = 208Pa = E2 ... 195 E *ension = 2000Pa = El ·V + E2 ·V2 E ension = E 0.2 b. 0 3.2 b ... 196 Etension 3.4 -+ 208
3.E b3.4b·l
3.4.b.
acr = 0.57-(E1) .(E2)23
Ocr = 0.57' (30.7kPa)3 (208Pa)3 'cr = 630Pa acr 630Pa Ec = = 0.02 El 30.7kPa Ad do-d
drr
do
... 197 Equation 6.1. Equation 6.2. Equation 6.3. Equation 6.4.irz.d
o-,rd
d
o-d
213
00 =_d ---- =o - d = rr ... 213 )r .-d o do At to -t to tod -d
, 6 z = 6 = d . ... 214 £rr = zz = °00 e= 1 ( )3 AV 3( 2 ... 214 V EF
=p 12E e
12 ... . ... 214 3 (1-2'v) ... 191 Equation 5.16.0<e 0.1: F = 0.831
* 12
(6.5a)
e > 0.1 F 0.83*E*eel* .12 >0.1 3-(1-2*) 0.83-EC (e - ee )123.(1-2. v )
... 216 (6.5b) Equation 6.6.F = F
-. N
3 ... 216 Equation 6.7. n2·r2 E.s· I 12 ... 219 nhydro t* Es I 0 C - 120.34.
' 3·E
s·d
4 FC = 64.12d
d
Djx =2l
C..
2.785 Ci 6(jxn/ UC) Pjxn = (d 3 11.31 2.- ) (vol/UC) t2.785 ... 220 11.459 C2... 251 d3 d3 SA 10.15 p* _ _v
d
p,
Equation C.1. Equation C.2. Equation C.3. Equation C.4.MEDAC = #samples)Mscabld 00012 COOH 91 C )mol 324
gmcollagen
C
mlCOO lmol EDACNH = (# samples) Mscaffo (00012
(1
2molNHS 1 6.OgmNgmMcolagen
gm~~~~~~
mO'COOH 1 6.0gm NHS0
Ij~~~~~~ge~~~~~
~
lm
Ol
lm
s
1 VCo + JC2 C 2 0 + C1 + +C 2 ... 324 331 Co .= C +C2 b C 1C 2 2 ...c,·J.331z
CZ- , Equation C.5.AspectRatio =
a
b ... 331 29 -Equation 6.5. Equation 6.8. Equation 6.9. Equation A.1.Equation C.6. a2 + b 2
d=1.5.2
CHAPTER 1. Introduction and Background: Measurement of
Cell Traction, Contraction, and Motility
1.1. The extracellular matrix and extracellular matrix analogs
The extracellular matrix (ECM) is a complex organization of structural proteins such as collagen, elastin, adhesive proteins including fibronectin and laminin, proteoglycans (PG), and glycosaminoglycans (GAGs) including chondroitin sulfate (CS), keratin sulfate (KS), dermatin sulfate, and hyaluronic acid (HA) (Figure 1.1).
The ECM defines the local environment of cells within tissues and organs, and acts as an insoluble regulator of cell behavior. However, the nature, kinetics, and mechanics of cell-ECM interactions have not been elucidated. Three-dimensional scaffolds are an analog of the extracellular matrix (ECM), acting as a physical support structure and as an insoluble regulator of biological activity that affects cell processes such as motility, applied traction force, cell-mediated contraction, and proliferation. A variety of materials, synthetic and organic, have been used as analogs of the ECM for many TE applications, where the ECM analog compositional,
-mechanical, and microstructural properties have been observed to significantly affect overall scaffold bioactivity. Additionally, it has been observed that a single construct variant is not suitable for all applications. What isn't well understood is what is responsible for this phenomena; that is whether construct bioactivity is defined by architecture, stiffness, composition, degradation characteristics, or some combination of these or potentially many other variables.
GAGs
Figure 1.1. Characteristic organization of the extracellular matrix in tissues and organs (left).
Collagen-glycosaminoglycan tissue engineering scaffold (ECM analog, right). Scale bar: 100 Jlm. (Yannas, Lee, et aI., 1989; Yannas, 2001).
The question under consideration in this thesis is how do cells detect and respond to their environments and what are the critical cues? While many experiments have begun to probe cell-substrate interactions on two-dimensional surfaces (Pelham and Wang, 1997; Lo, Wang, et aI., 2000; Wang, Dembo, et aI., 2000; Beningo, Dembo, et aI., 2001; Munevar, Wang, et aI., 2001; Wang, Dembo, et aI., 2001; Wang, Wan, et aI., 2001), the critical biochemical and biophysical
parameters that affect cell behavior in three-dimensional constructs such as scaffolds and gels have not been quantitatively investigated.
The objective of this thesis is to use collagen-glycosaminoglycan (CG) scaffolds as an experimental tool to systematically study the effect of the extracellular environment on cell behavior. The approach is threefold: First to develop, characterize, and model new fabrication techniques to produce isotropic, three-dimensional CG scaffolds with a homogeneous pore microstructure. Secondly, to characterize and model the pore microstructure, specific surface area, permeability, and mechanical properties of these scaffold variants, thereby characterizing the local extracellular environment of cells within the scaffold variants. Thirdly, to systematically investigate the independent effect of CG scaffold microstructure and mechanical properties on cellular migratory and contractile behavior.
1.2. Mammalian response to injury
The goal of achieving in vivo induced regeneration for a variety of tissue and organs following severe injury remains at the forefront of current tissue engineering investigations and provides the motivation for this thesis. Typically, an analog of the extracellular matrix is utilized as a template that, when properly formulated, induces regeneration of lost or damaged tissue. Currently, successful regeneration has been induced in the skin and peripheral nerves (Yannas, 2001), while progress has been made in developing appropriate extracellular matrix analogs to alter the typical organismic response to injury in a variety of tissues, including kidney, cartilage, bone, central nervous system, and brain dura. These investigations, active for the previous three decades, have primarily focused on identifying the optimal extracellular matrix analog