HAL Id: halshs-02532955
https://halshs.archives-ouvertes.fr/halshs-02532955
Preprint submitted on 6 Apr 2020
HAL is a multi-disciplinary open access archive for the deposit and dissemination of sci-entific research documents, whether they are pub-lished or not. The documents may come from teaching and research institutions in France or abroad, or from public or private research centers.
L’archive ouverte pluridisciplinaire HAL, est destinée au dépôt et à la diffusion de documents scientifiques de niveau recherche, publiés ou non, émanant des établissements d’enseignement et de recherche français ou étrangers, des laboratoires publics ou privés.
How Do Agro-Pastoral Policies Affect the Dietary
Intake of Agro-Pastoralists? Evidence from Niger
Christophe Muller, Nouréini Sayouti
To cite this version:
Christophe Muller, Nouréini Sayouti. How Do Agro-Pastoral Policies Affect the Dietary Intake of Agro-Pastoralists? Evidence from Niger. 2020. �halshs-02532955�
Working Papers / Documents de travail
WP 2019 - Nr 17(v2)
How Do Agro-Pastoral Policies Affect the Dietary Intake
of Agro-Pastoralists? Evidence from Niger
Christophe Muller
Nouréini Sayouti
1
How Do Agro-Pastoral Policies Affect
the Dietary Intake of Agro-Pastoralists?
Evidence from Niger
1Christophe Muller
*and Nouréini Sayouti
**April 2020 Abstract
Agricultural policies in poor rural developing countries typically aim at improving household nutrition by raising households’ agricultural profit and presumably their dietary intake as a consequence. However, it is not clear how much of the impact of these policies goes through profit in practice. If the proportion is large, this would confirm the policy orientation and direct the attention of policy makers toward the different financial incentives. Even full activity substitution may occur, which may transform households’ lifestyles and access to nutrient sources and thereby affect their nutrition. If, in contrast, the policy impact does not go through profit, then the policy perspective should be adjusted, and a thorough examination and monitoring of its other channels of influence should be undertaken.
Using statistical mediation analysis, we investigate the mechanisms underlying the effect of agricultural policies directed toward pastoralist households on their dietary intake in terms of these direct and indirect (through profit) effects. Based on an agro-pastoral survey conducted in Niger in 2016, the effects of extension services associated with better access to markets are found to be channeled mostly through pastoral profits, while this is not the case for private veterinary services and low-cost livestock feed programs. Extension services may foster specialization in cattle and sheep raising, which incentivizes households to switch toward a nomadic lifestyle and limits their access to cereals, a valuable source of calories. As a result, extension services are found to damage their calorie intake.
Keywords: Agropastoral Policies, Mediation Analysis, Agricultural Households Models, Niger
JEL Code: Q12, I18, D13
1 This paper was supported by the African Economic Research Consortium under grant no. RC175533 and by the
French National Research Agency (ANR), under the TMENA2 project (ANR-17-CE39-0009-01) (http://christophemuller.net/tmena/).. The authors are grateful to the National Institute of Statistics of Niger and the Ministry of Livestock of Niger for their collaboration and for providing us with the data.
*: Aix-Marseille University, CNRS, EHESS, Ecole Centrale Marseille, IRD, AMSE, France. **:Projet d’Appui au Secteur de l’Elevage, Niamey, Niger and CERDI, University of Auvergne
2
I. Introduction
Agricultural policies in poor developing countries are often motivated by the improvement of the nutritional status of rural populations. These policies are generally designed with the aim to increase the production profit of farm households or pastoral households, in the hope that higher income will result in better dietary intake. Improving dietary intake can boost nutrition status, for example, as measured by anthropometric variables (e.g., in Puentes et al., 2016). Accordingly, household agricultural profit remains the indicator most widely used to monitor the success of agricultural policies. However, it is unclear whether the impact of these policies actually goes through the agricultural household profit and in which proportion or whether it goes through other, often overlooked, channels. Learning that a policy effect does prominently operate though the agricultural profit would first corroborate that the design of the policy mechanism, targeting profit, is sound. This is far from obvious in contexts of missing and imperfect markets, in which the separation of production and consumption decisions has often been rejected (Benjamin, 1992, Muller, 2014) and where household choices may therefore involve more complex and extended transformations. Moreover, it would direct the attention of policy makers toward the financial incentives that producers follow in developing and selecting their activities. In particular, changes in activity specialization or sector may occur if policies affect profits and returns discordantly for distinct activities. Furthermore, activity switches may be accompanied by fundamental transformations in the lifestyle of households, including in their dwelling and consumption habits, and in the constraints they face for gathering the ingredients of their meals. As we will show below, this may imply, in Niger, that some policies that foster pastoralist incomes may have harmful consequences for the calorie intake of some beneficiary households. Instead, finding that the policy operates through channels other than agricultural profit or other production level measures would push policy makers to adjust their perspective on how the policy works. Policy makers would be pushed to turn their focus to other pathways less directly connected to market and production processes. For example, local community networks, diversion of assistance,
3
informal exchanges and gifts, and power games within and between households may be comprised in the repercussions of the policy. These policies may also be the occasion of valuable information transmission among households and generate externalities through the creation of new network links. In this case, all these alternative policy channels may require more attention from policy makers than the narrow production channels.
Our goal is to investigate these issues. To do so, using statistical mediation analysis, we will assess the relative importance of direct and indirect (through profit) effects of some pastoral policies in the case of Niger. In particular, our results will highlight the interest of monitoring the financial incentives generated by policies for pastoral versus other activities. Furthermore, they will emphasize the importance of accounting for lifestyle switches in assessing agricultural policies, at least in this context. Finally, considering these elements will allow us to present an overlooked perverse effect of some agricultural policies: household nutrition may be damaged by changes in diets that accompany the triggered switches in activities and lifestyles, such as when sedentary agricultural households move to pastoral nomadism, and as a consequence, lose access to valuable cereal sources of calories.
All these questions are likely to be relevant for many agricultural regions and poor developing countries. However, we will shed some light on them by investigating the case of agro-pastoral households in a Sahel country, for which they are particularly relevant. Indeed, the Sahel region is one of the poorest in the world. The Food and Agricultural Organization of the United Nations (FAO, 2016) estimates that an average of 20 million people suffer from malnutrition and food insecurity in the region each year, mainly during the lean season. In 2016, nearly 6 million children under five were acutely malnourished in the Sahel, which contributes to one-third of child mortality. Although van Wesenbeeck, Keyzes and Nubé (2009) find a lower prevalence of hunger and less inequality in mean calorie intake in Africa than does the FAO, undernutrition still appears to be frightfully severe in the Sahel.
4
For decades, Sahelian countries have tried, on their own or jointly, to provide solutions to this problem through agricultural policies. One of the key sectors on which these policies have focused is pastoralism, which is well fitted to the agro-ecological conditions and is the main source of income for many households in this region. In particular, the PRAPS regional project, financed by the World Bank in six Sahel countries, assists the development of pastoralism. Its main objective is to improve the income, productivity, sustainability and resilience of pastoral livelihoods. We base our investigation on the (only usable) Niger survey of this project. Again, in this context, the policies that target pastoralist or agro-pastoralist households seek to improve their farm profit through an increase in their livestock output or a reduction of their production costs.
The linkages between agricultural and pastoral activities, diets and nutrition statuses may be complex. For subsistence or semi-subsistence agricultural households, raising the level of a household’s food output should generally increase its food availability and, as a result, its food intake. However, as agricultural households have generally become increasingly market oriented over the last decades, they also typically purchase a substantial share of their food on markets to meet their food needs (The World Bank, 2007; Herforth and Jody, 2014). Moreover, with access to markets and extra income from output sales, they can purchase higher quality food.
In developing contexts, diverse authors have found that a household’s production strategies may influence its nutritional and health statuses beyond the effect of its varying agricultural profit.2 Here, we examine a specific link in these potential
interactions, namely, how agricultural profit may impact dietary intake. However, one issue is that the health and nutrition status of producers may also directly affect their productivity and efficiency, as found by Croppenstedt and Muller (2000) in Ethiopia. Moreover, food aid programs sometimes simultaneously provide food aid and production-related assistance (as in Brück et al., 2018). This implies that endogeneity issues may arise when estimating an equation determining
2Muller, 2009; Carletto, Ruel, Winters, and Zezza, 2015; Dillon, McGee, and
5
dietary intake in which agricultural outputs or profits are included as explanatory factors.
To investigate all these issues, we conduct a statistical mediation analysis of agro-pastoral policies by using methods akin to those discussed in Heckman and Pinto (2015) and Vanderweele (2015). Mediation analysis has already been used to analyze the impact of promotion campaigns for staple food adoption on dietary intake (de Braw et al., 2018). Instead, we inspect household pastoral profit as a potential mediator in diverse policies aimed at raising pastoral profits. We apply this new approach to the case of Niger and three types of policies: (i) extension services, (ii) veterinary services, and (iii) input subsidies. As mentioned before, in addition to their indirect effects through profit, these policies may have direct effects. For example, they may affect nutritional outcomes through the resale or transfer of the received goods and services to other households. Neglecting these potential mechanisms, as well as others, may bear consequences for household food consumption and dietary intake.
The rest of the paper is organized as follows. In Sections 2 and 3, we present the context of the study and the data. Section 4 discusses the empirical strategy, while Section 5 reports the estimation results. Finally, Section 6 concludes the paper.
II. The Context
II.1.
Livestock, poverty and malnutrition in Niger
Niger is a large, landlocked African country with a population of 17 million in 2014. The country’s economy is essentially based on agriculture in a broad sense. Forty percent of Niger’s GDP is derived from the agricultural sector, while 11 percent stems from the livestock sector (Ministère de l’Elevage, 2016). Of Niger’s total population, 87 percent are involved in the livestock sector as a primary or secondary activity, while, on average, 10 percent of rural households’ income and up to 43 percent of the income of households in pastoral zones comes from livestock. In a survey conducted in 2011 by the National Institute of Statistics in Niger on
6
living standards and agriculture, Zezza and Issa (2012) found that 77 percent of the 4,000 households interviewed raised livestock. Moreover, in rural areas in 2005, four out of five surveyed households held or kept, on average, 2.8 tropical livestock units (TLUs)3 per household.
Most of the Nigerien households raising livestock are poor. Haan (2016) states that between 2008 and 2013, based on their income or expenditure levels, up to 30 percent of the pastoral and agro-pastoral populations were very poor, while 30 percent were poor, 20 percent were considered to be middle income and 20 percent were well-off. However, measured monetary income typically omits the asset value of livestock, which may lead to underestimating the wealth of these households. It also misses the role of livestock as a source of insurance and prestige.
Currently, the combined effects of climate change, drought, flooding and desertification, and demographic pressure have brought the pastoral economy into disarray. In the purely pastoral sector, the mean livestock ownership is only 1.9 TLUs per capita, and 0.6 TLU per capita in the agro-pastoral sector. According to Haan (2016), these levels are low when compared to “the minimum required to meet basic needs, avoid livestock inbreeding, and recover from drought, which is between 2.5 and 4 TLU per capita for pastoralist households and half of that for agro-pastoralist households”. This is a matter of concern because below this level, households are confined to poverty even in good times. In contrast, households above this threshold may be able to not only regenerate herds after droughts but also use their animals to maintain the social networks on which they can rely during critical periods.
Niger is one of the most vulnerable countries in the world, with 20 percent of rural households being food insecure in any given year (Ballo & Bauer, 2013). In 2010, 26.8 percent of agro-pastoralist households were most affected by food insecurity, with global acute malnutrition (GAM) among children under five years very severe
3 Tropical livestock units are livestock numbers converted to a common unit. Conversion factors
are: cattle = 0.7, sheep = 0.1, goats = 0.1, pigs = 0.2, chickens = 0.01. See the International Food Research Institute and Harvest Choice : http://harvestchoice.org/data/an05_tlu for more details. The benchmark tropical livestock unit is commonly taken to be an animal of 250 kg liveweight (International Livestock Centre for Africa, 1988).
7
in agro-pastoral and pastoral areas. In the Tilaberi region, GAM was up to 14.8 percent, which is near the WHO’s maximum threshold of 15 percent (United State Agency for International Development, 2011). This calamity was largely a consequence of the 2009/2010 food crisis, which was characterized by harvest collapse, a very short rainfall period, and consecutive years of prolonged droughts.
II.2 Agricultural policies in Niger to alleviate poverty and food insecurity
In 2011, one year after the food crisis, the country put in place a long-term agricultural and food policy program, denoted “Initiative 3N: les Nigériens Nourissent les Nigériens” (Nigeriens Feed Nigeriens). The aim of this program is to end famine and malnutrition in the country by 2035. Precisely, in the livestock sector, the specific goals of this policy are (i) to increase fodder availability by creating livestock feed warehouses, livestock feed banks, mills, and municipal supply centers; (ii) to increase water availability by digging wells; (iii) to develop vaccination for animals; (iv) to enhance extension services targeted toward pastoral and agro-pastoral households; and (v) to give fodder, multi-nutrient block and fodder seeds to vulnerable pastoralist and agro-pastoralist households.
In this study, we analyze how these components of Initiative 3N affect the dietary intake of these households through their pastoral profit, or otherwise. In particular, we focus on the three main policies: extension services, private veterinary services and low-cost livestock feed.
Extension services
The extension services enhanced by the Initiative 3N include two types of professional advice: the first is related to the use of livestock feed, while the second encourages households to use modern animal health services, appropriate breeding techniques and modern feeding. To obtain the first type of advice, households must visit a livestock feed bank, also called “the peasant’s house”. The peasant’s houses are held by government technical services, municipalities, farmers’ associations or cooperatives. The livestock feed bank also seeks to i) bring livestock feed closer to the most remote households and ii) provide a security stock
8
that can be mobilized during the hot dry season when livestock feed is scarce on the market and especially expensive. The second type of advice is typically provided at the beginning of the pastoral season every year by farmers’ associations and by technical services of the Ministry of Livestock.
Private veterinary services
Private veterinary services are delivered either by a private veterinarian or by local private veterinary assistance. On the one hand, private veterinarians are generally based at the department level. They often hold a veterinary pharmaceutical stock with the mandate of carrying out free vaccination campaigns financed by the government. On the other hand, local private veterinary assistance is led by a private veterinarian who runs a network of approximately thirty assistants. An assistant is a private agent who can perform in ten to fifteen villages. These assistants may be community agents, such as villagers chosen by the community, and trained by the private veterinarian. Local private veterinary assistance provides households with various animal health services, such as vaccination, treatment of animal diseases, and advice. This service is part of the policy of liberalizing the veterinary profession, as promoted by the government. Low-cost livestock feed (input subsidies)
Each year, the government assesses the country’s fodder needs and purchases fodder to meet needs in deficit areas. The purchased stock is sent to the peasant’s houses for sale at moderate prices. However, the purchased stock never covers more than fifty percent of the needs (Ministère de l’Elevage, 2015). Let us now turn to the data used for the estimations.
9
III. Data and Variables
III.1. Data
This paper uses data from a specialized survey collected by the Ministry of Livestock in Niger. This survey was conducted for two projects: “PRAPS: Projet Régional d’Appui au Pastoralism au Sahel” and “PASEL: Programme d’Appui au Secteur de l’Elevage”.
We can access only the first wave of this survey, which was conducted in October 20164. The survey covered the seven regions of the country, and 1,350 pastoral and
agro-pastoral households were sampled. First, 90 villages were selected proportionally to their size, as recorded from the national directory of localities. Then, within each selected village, 15 households were randomly drawn. In each village, households were a priori divided into three categories (small, medium and large producers) according to the size of their herds and in close collaboration with the villagers.
The surveyed households were asked about their socio-demographic characteristics, budget, food consumption, agro-pastoral production, livestock holdings, agro-pastoral sales and the prices they each face. The same survey provides information on different shocks that these households suffered (shocks related to animal fodder, animal diseases, and access to water) and on their strategies in response to these shocks. Finally, there is precise information on the access these households had to the three examined agricultural policies (input subsidies, veterinary services and extension services).
Furthermore, we employ the global positioning system (GPS) of coordinates for matching each surveyed household with climatic data on local precipitation and temperature. For each household, we collect annual data on minimum, maximum and average temperatures in degrees Celsius at two meters of altitude and annual precipitation data measured in millimeters per day from the website for NASA’s Prediction of Worldwide Energy Resource Project. The climatic data collected are
4 The other waves, which are not accessible officially, cover too small a subsample to be usable for
10
averaged at the departmental level. This provides us with instrumental variables that will allow us to handle endogeneity problems in our regressions.
In this study, we are constrained to focus on households that own sheep and cattle, which is therefore our population of reference. Indeed, first, only the information collected on this group of households is complete enough to be usable for econometric analyses. For example, these are the only households for whom we have data on livestock price costs and production levels. Another primary reason to focus on these pastoral and agro-pastoral households is that agro-pastoral policies should not directly affect households that have no pastoral activity. This leaves us with 600 household observations after cleaning the data and removing outliers5. In our final sample, the majority of households (almost 93 percent) are
considered to be agro-pastoralist households, while only 7 percent are purely pastoralists. Pastoral households are defined as those that do not usually produce agricultural products and possess a significant number of animals (they are at least a medium herder). Moreover, their first and even second principal activities are livestock production and not agricultural production.
III.2. Construction of variables
In this subsection, we present the outcome and treatment variables. We define two distinct types of outcome variables: dietary intake indicators and household profit from livestock activities. The three treatment variables correspond to the considered agricultural policies. Each treatment is described by a dummy variable that takes a value of 1 when the household reported that it had access to the policy and 0 otherwise.
5However, note that some agropastoral policies could induce non-pastoral households to enter these activities.
We cannot control this potential entry process with these data. On the other hand, we found no indications that such process are actually taking place in the academic and administrative literature, Niger’s statistical sources, or during the interventions and focus groups that we conducted in Niger.
11
Dietary intake indicators
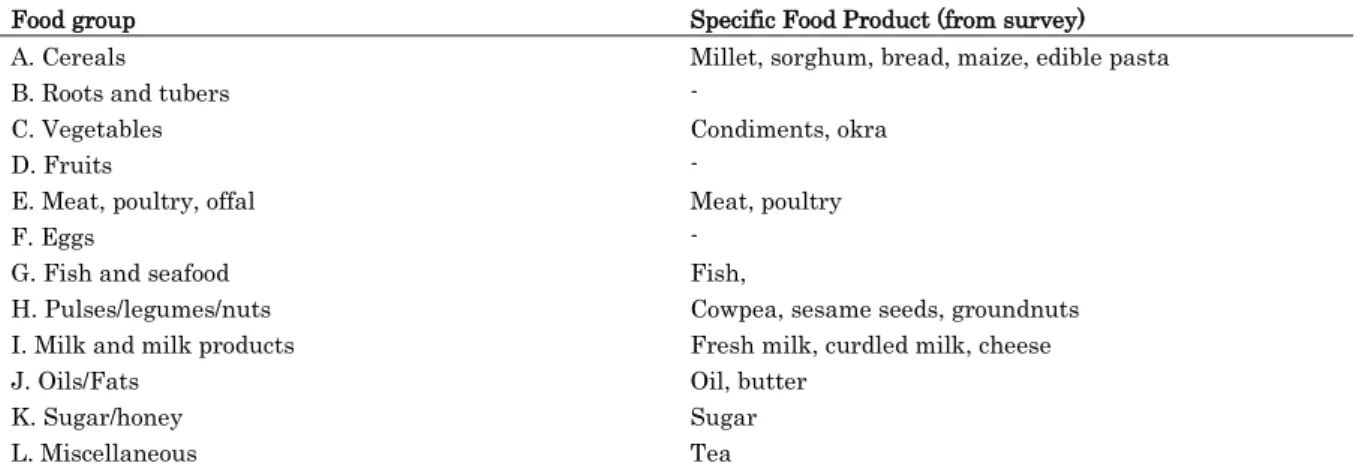
Two nutrition indicators are constructed: the household dietary diversity score and the household calorie intake per capita per day. The dietary diversity score records how many different food groups have been consumed by the household over a given reference period, which makes it a good proxy for diet quality. Following the FAO, 12 food groups are used to compute the dietary diversity score (Swindale & Bilinsky, 2006). Table 1 shows how the food products recorded as consumed by the households are categorized into these groups.
Table 1: Classification of food products
Food group Specific Food Product (from survey) A. Cereals Millet, sorghum, bread, maize, edible pasta
B. Roots and tubers -
C. Vegetables Condiments, okra
D. Fruits -
E. Meat, poultry, offal Meat, poultry
F. Eggs -
G. Fish and seafood Fish,
H. Pulses/legumes/nuts Cowpea, sesame seeds, groundnuts I. Milk and milk products Fresh milk, curdled milk, cheese
J. Oils/Fats Oil, butter
K. Sugar/honey Sugar
L. Miscellaneous Tea
Notes: Classification made by the authors using the food groups proposed by the FAO.
If the household reported that, over the last quarter, it consumed at least one of the food products belonging to a specific food group, an index value of 1 is attributed to this household for the corresponding food group, 0 otherwise. As we can see from Table 1, none of the foods consumed by the surveyed households belong to the food groups of roots and tubers, fruits or eggs. This is because the survey did not record any consumption of these food groups due to their low frequency for agro-pastoralists6. Finally, a dietary diversity score is defined for
each surveyed household as the total unweighted number of food groups consumed by the household.
6In addition to the low frequency issue, the quarterly retrospective questionnaire that has been employed for
the survey is likely to generate omissions and thereby lead to underestimated dietary scores. Although such approximate measurement of dietary intake is worrying, this is a common case with food consumption surveys. Econometrics methods partly deal with this by allocating these measurement errors to the error term in regressions in which the dependent variable is a measure of dietary intake.
12
Calorie intake per capita per day
The calorie intake per capita per day for each household is computed by converting the recorded food quantity consumed by the household into calories. For this, we use the food composition table provided by the FAO for West Africa in 2012 (Stadlmayr et al., 2012). We separately computed calorie intake coming from cereals (millet, sorghum, bread, maize and edible pasta) and from animal food products (meat, poultry, fish, fresh milk, curdled milk and cheese).
Profits from livestock activity
The last outcome variable is the household annual profit from livestock activity. After several attempts, we decided to consider only three outputs: cattle, sheep and milk production (fresh milk and curd), which correspond to the most accurately measured information. For cattle and sheep, we used the animals sold and slaughtered by the household as a measure of output because variations in stocks are unobserved. For milk, we used total household production. There are no data on stock variation for milk production between the two years.
All these production measures were valued at the market prices7 faced by each
household. The total of these production values amounts to the gross income of the households from pastoral activity.
For production costs, we were able to track four monetarily valued costs: costs related to the herd's health, livestock water consumption, feed consumption, and labor costs (for shepherds and market middlemen during the sale of animals). These costs are reported by each surveyed household for the whole herd. The (restricted) profit is obtained by subtracting the total observed costs from the obtained gross income. All other unobserved costs and benefits must be neglected, as they were not observed. In the next subsection, we briefly discuss a few descriptive statistics.
7The cattle and sheep prices are given by animal sex and age. For animals directly consumed by the households, we
13
III.3. Summary statistics
Household characteristics
Table 2a reports a few descriptive statistics for the variables used in this study. The average age of the household head in our sample is 45 years, and nearly 95 percent are male. The majority of the heads (94 percent) have no education, with only 4 percent having received primary education. We also note that the average size of households is 7 members, most of whom are children.
Our sample is mainly composed of households whose head belongs to the Fulani ethnic group (55 percent), followed by Tuareg (23 percent) and Haussa (14 percent). The seven regions of the country are grouped into two zones: the North and the South. The North is formed by the regions of Agadez, Diffa, Maradi and Zinder and the South by the regions of Tahoua, Dosso and Tillabery. Most of the households in our sample (60 percent) live in the South.
14
Table 2a: Summary statistics
Notes: To calculate the calorie intake from cereals and animal food products, the considered cereals are millet, sorghum, bread, maize, and edible pasta, while the animal food products considered are meat, poultry, fish, fresh milk, curdled milk, and cheese.
As previously stated, households were classified into three categories according to the size of their herds: small herders (5 sheep and 4 cattle, on average), medium herders (10 sheep and 8 cattle) and large herders (29 sheep and 14 cattle). The majority (56 percent) of households in our sample belong to the category of small herders. Only 15 percent of the households surveyed are large herders. When considering all categories, the average number of animals per household is 10 for sheep and 7 for cattle.
As mentioned above, dietary intake is measured by two indicators: the calorie intake per capita per day and the dietary diversity score. In our sample, the
Variables N. Obs Mean Std. Dev Min Max
Sociodemographic variables
Sex of household head (1 if male) 600 0.95 0.23 0 1
Age of household head 596 44.76 14.66 17 92
Education level of household head
- None (1 if yes and 0 otherwise) 600 0.94 0.23 0 1
- Primary (1 if yes and 0 otherwise) 600 0.04 0.19 0 1
Household size 600 7.14 3.68 1 25
Number of children (0-3 years old) 600 0.82 0.97 0 6
Number of children (4-10 years old) 600 2.02 1.66 0 9
Number of youths (11-16 years old) 600 0.88 1.08 0 8
Number of young adults (17-20 years old) 600 0.80 0.93 0 5
Number of adults (>20 years old) 600 2.65 1.52 0 11
Area of residence (1 if in the South) 600 0.60 0.49 0 1
Ethnic group
- Tuareg (1 if yes and 0 otherwise) 600 0.23 0.42 0 1
- Haussa (1 if yes and 0 otherwise) 600 0.14 0.35 0 1
- Fulani (1 if yes and 0 otherwise) 600 0.55 0.49 0 1
Livestock holding
Number of sheep 600 10.04 31.44 0 638
Number of cattle 600 6.55 9.36 0 61
Livestock holding category
Small producer 600 0.56 0.5 0 1
Large producer 600 0.15 0.36 0 1
Outcomes variables
Calorie intake per capita per day (Kcal) 600 3,987 3,874 16.70 21,166 Calorie intake per capita per day from cereals
(Kcal) 600 3,242 3,222 15.66 20,984
Calorie intake per capita per day from animal
food product (Kcal) 600 208,81 980 0 12,539
Household dietary diversity score 600 5.39 1.73 1 9
Annual profit from livestock production
(Millions of CFA) 600 3.89 18.3 -1.63 257
Policies
Access to extension services (1 if yes and 0
otherwise) 600 0.19 0.39 0 1
Access to private veterinary services (1 if yes
and 0 otherwise) 600 0.20 0.40 0 1
Access to low-cost livestock feed (1 if yes and 0
15
household dietary diversity score varies between 1 and 9, with an average of 5. This means that, on average, the surveyed households consume five different food groups during the year. Over this year, food consumption provided an average of 3,987 Kcal per person per day for each household. However, 25 percent of surveyed households have calorie intake of less than 1,584 Kcal per person per day, while for 50 percent of the households, the intake is less than 2,775 Kcal per person per day. Large outliers seem to be related to ceremonies and food stock, although this cannot be fully ascertained in these data. We checked that these outliers are not systematically linked to the absence of policy access. Finally, on average, almost 83 percent of calorie intake comes from cereals, and only 4.4 percent strictly comes from animal food products. It seems likely that calorie intake from animal products has not been fully recorded. In particular, omission errors may occur due to the large recall period for consumption, which is 3 months. Moreover, animal products are sometimes mixed with vegetable products when consumed and, in that case, may have been overlooked in meal description.
The extreme values observed in household calorie consumption data are not necessarily irrelevant outliers. Indeed, one simple method to detect outliers in univariate data is based on boxplots. However, by observing the distribution of these data, we can see that they are skewed and have a long tail, which makes the standard boxplot method ineffective, as Bruffaerts et al. (2014) have pointed out. For this type of data, these authors proposed the generalized boxplot method that deals with these data characteristics (see also Verardi and Vermendele, 2018). With the logarithmic transformation, the values that could have been considered outliers no longer seem to be so (see Appendix 1). This supports our choice to transform the data before estimating regressions. Additionally, as noted by Atkinson (1982), “in some cases, apparent outliers can be brought into agreement with the remainder of the data by use of a transformation”.
Table 2a shows that the profit level varies substantially across households. On average, annual profit is 3.89 million CFA francs. Over the survey period, 25 percent of households had a zero profit, while half of households enjoyed a profit above 214,073 CFA francs. The households with zero profit correspond to those
16
with very limited pastoral activity. The greatest observed profit loss is nearly 1.6 million CFA francs. This may be partly due to measurement errors and partly to the fact that annual profit is an imperfect measure of economic activity for livestock raising, the production horizon of which may extend to many years. Our outcome variables, the two household dietary intake indicators and the profit variable, are each transformed into logarithmic form for the econometric analysis. When transforming the annual livestock profit into logs, we add a constant amount to the profit level to accommodate negative values. The transformed profits are therefore log (profit + constant), where the constant is equal to the minimum observed value of profit in absolute terms, plus one.
In the sample, 20 percent of the surveyed households have access to private veterinary services, while only 19 percent and 15 percent report having access to extension services and low-cost livestock feed, respectively.
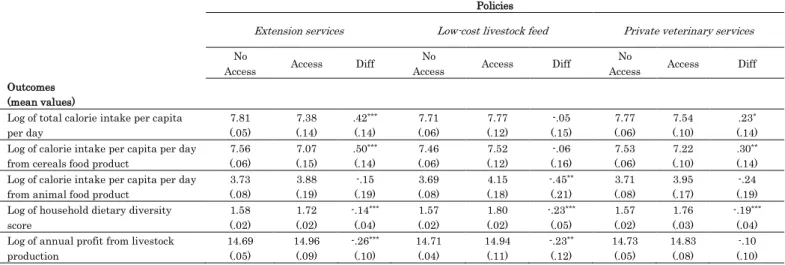
As we can see from Table 2b below, the outcomes of households that have access to a policy generally differ from those that do not. The households that have access to extension services have a 42 percent lower calorie intake than those that do not. However, their dietary diversity score is 14 percent higher than that of nontreated households. They also consume more animal food products and less cereals than households that do not have access to extension services. Households with access to low-cost livestock feed or private veterinary services have a higher dietary diversity score and consume more animal food products than cereal products, different from households that do not have access to these policies. Regarding the annual profit from livestock production, we note that for the three considered policies, households that have access to each of these policies are better off than those that do not. These data are therefore suggestive for the analysis that we want to conduct. We describe our empirical strategy in the next section.
17
Table 2b: Summary statistics
Policies
Extension services Low-cost livestock feed Private veterinary services
No
Access Access Diff
No
Access Access Diff
No
Access Access Diff Outcomes
(mean values)
Log of total calorie intake per capita per day 7.81 (.05) 7.38 (.14) .42*** (.14) 7.71 (.06) 7.77 (.12) -.05 (.15) 7.77 (.06) 7.54 (.10) .23* (.14) Log of calorie intake per capita per day
from cereals food product
7.56 (.06) 7.07 (.15) .50*** (.14) 7.46 (.06) 7.52 (.12) -.06 (.16) 7.53 (.06) 7.22 (.10) .30** (.14) Log of calorie intake per capita per day
from animal food product
3.73 (.08) 3.88 (.19) -.15 (.19) 3.69 (.08) 4.15 (.18) -.45** (.21) 3.71 (.08) 3.95 (.17) -.24 (.19) Log of household dietary diversity
score 1.58 (.02) 1.72 (.02) -.14*** (.04) 1.57 (.02) 1.80 (.02) -.23*** (.05) 1.57 (.02) 1.76 (.03) -.19*** (.04) Log of annual profit from livestock
production 14.69 (.05) 14.96 (.09) -.26*** (.10) 14.71 (.04) 14.94 (.11) -.23** (.12) 14.73 (.05) 14.83 (.08) -.10 (.10) Notes: Values in parentheses are standard errors. *, ** and *** indicate significance at the 10%, 5% and 1% levels, respectively. Column Diff shows the mean difference, for the outcome variable, between the group of households that do not have access to the policy and the group that does have access to it.
IV. Empirical Strategy
As mentioned above, our aim is to empirically investigate the mechanisms behind the impact of agricultural policies on household dietary intake. Specifically, we want to assess the role played by pastoral profits in this process. In contrast, mainstream policy evaluation methods focus primarily on estimating the average treatment effect rather than investigating the underlying channels that drive this effect.
In the statistical literature, analyzing the channel through which a policy effect occurs, with a specific interest in the role of a particular variable, is referred to as mediation analysis8. A particular variable of interest is the potential mediator of
effects, which in our case is the profit from livestock activity. Mediators in agricultural production technology have been identified by Heckman and Pinto (2015) using treatment effect estimators. Our approach mixing ATE estimators and regression estimators is somewhat akin to their econometric setting (p. 4, or eq. 19 p. 16). Consistent with this setting, the identification relies on ignorability conditions, controls and instrument exclusion conditions.
Mediation analysis has been especially used in medicine, psychology and political science, in both experimental and observational studies. There is growing interest
18
in extending the use of this method in economics9. Our empirical strategy is a form
of mediation analysis, in which we investigate the extent to which the impact of agricultural policies on pastoralist household dietary intake in Niger is mediated by the profit from livestock activities.
Figure 1: An illustration of our empirical strategy
This strategy can be specified in terms of the four links (a, b, c and c’) displayed in Figure 1. The first link represents the total effect (c in Figure 1) of the considered agricultural policy on the dietary intake indicators for pastoralist households. Link a represents the effect of the policy on profit, which is the mediator, while link b represents the effect of profits on household dietary intake. The second two links are used to assess the indirect effect of the policy on household dietary intake, that is, the effect that is mediated through profits. Finally, the last link c’ represents the direct effect of the policy on household dietary intake, that is, the effect that operates through channels other than the annual profit.
To analyze this mediation, we use a combination of cross-sectional and retrospective observational data, which were collected in 2016, five years after the
9Heckman et al. (2013); Kosec, Ghebru, Holtemeyer, Mueller and Schmidt (2018); de
19
beginning of the implementation of Initiative 3N. However, we do not have any information on these households before 2011.
IV.1 Estimating the unmediated effect (c) of policies
In this first step, we estimate a model of selection on observables for the potential outcomes with and without treatment (i.e., with and without policy access).
In Niger, households may choose to have access to different agricultural policies. In that case, they select themselves into the treatment. In this context, our identification strategy of the treatment effect relies on assuming conditional mean independence between the treatment and the outcomes. For the studied question of policy analysis, the issue of identification always arises. Given the limited data at our disposal, attempting to address this issue by relying on an approximate hypothesis of selection based on observables seems to be better than neglecting selection and endogeneity issues.
We evaluate the effects of the three policies separately because each policy was originally intended to resolve a specific problem. Therefore, depending on its needs, a household can decide to use different policies at different points in time, separately, or not at all. For example, a household can decide to use private veterinary services during the dry and wet season, a season favorable to the development of livestock diseases. However, in the dry and hot season10, the
household may instead decide to use the low-cost livestock feed program because of the scarcity of pastureland during this season. Thus, before deciding to use the low-cost livestock feed program, the effect of private veterinary services may have already been observed by the household in the previous season. Then, the household’s decision to use low-cost livestock feed is clearly not simultaneous with its previous decision to use private veterinary services. In that case, jointly evaluating the simultaneous effects of the three policies does not seem to be appropriate. Moreover, the survey does not provide any information on the precise
10The dry and hot season corresponds to the period from February to May, while the dry and wet season
20
time of the year when each household accessed and used each policy. Therefore, we prefer to assess the impact of each considered policy separately.
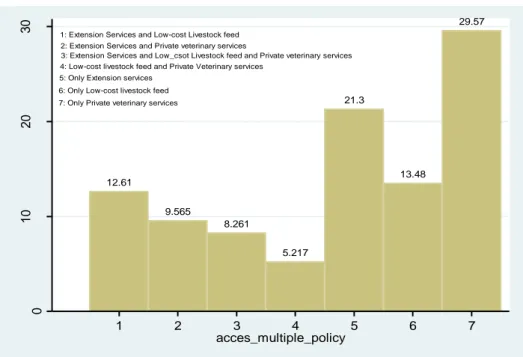
Figure 2: Distribution of households that have access to at least one policy among the three studied
In addition, over the year, households may have accessed all the policies, although not simultaneously. Indeed, as one can see from Figure 2, among the households that have access to at least one of the three policies (213 households), only 8.26 percent have access to all three policies during the whole year. Additionally, the majority of these households have access only to private veterinary services (29.57 percent), which is consistent with livestock disease being a major concern for them. The questionnaire includes information on the households’ assessment of the services they have accessed. This information is censored because it is only available for households that have had access to the services. The assessment is approached from three angles: physical accessibility to these services, cost and quality. Each household was asked to indicate, for a given service, whether it was easily accessible, whether it was cheaper than what is available on the market and whether it was of good quality.
As shown in Table 3, households’ assessment depends on where they live. Indeed, households living in the South of the country seem to have easier physical access to extension services than those living in the North. In fact, the proportion of households that had access to this policy and that considered the policy easily
12.61 9.565 8.261 5.217 21.3 13.48 29.57
1: Extension Services and Low-cost Livestock feed 2: Extension Services and Private veterinary services
3: Extension Services and Low_csot Livestock feed and Private veterinary services 4: Low-cost livestock feed and Private Veterinary services
5: Only Extension services 6: Only Low-cost livestock feed 7: Only Private veterinary services
0 10 20 30 Pe rce n t 1 2 3 4 5 6 7 acces_multiple_policy
21
accessible is significantly higher for households living in the South than for those in the North. However, the opposite situation is observed for private veterinary service, where access seems to be easier for households living in the North than for those in the South. On the other hand, for these two policies, there is no significant difference between North and South in terms of households' evaluation of cost. It is only the assessment of the cost of the low-cost livestock feed service that is significantly different; namely, it is considered to be cheaper in the South than in the North.
Table 3: Households’ assessment of the policies
Assessed aspects Policies (N=239) North (N=361) South Difference
Physical accessibility (1 if easy and 0 otherwise) Extension services (.082) .555 [36] .734 (.048) [83] -.179** (.095) Low-cost livestock feed .512 (.080) [39] .480 (.069) [52] .032 (.105) Private veterinary services .753 (.051) [69] .615 (.067) [52] .138* (.085) Cost
(1 if less expensive and 0 otherwise) Extension services (.065) .805 (.043) .807 (.078) -.001 Low-cost livestock feed .871 (.053) .961 (.026) -.089* (.059) Private veterinary services (.060) .536 (.069) .480 (.091) .055 Quality (1 if good and 0 otherwise) Extension services (.078) .666 (.044) .795 -.128(.090) * Low-cost livestock feed (.053) .871 (.052) .826 (.074) .044 Private veterinary services .840 (.044) .423 (.068) .417*** (.081)
Notes: Values in brackets are the number of households that used the policy. Values in parentheses are standard errors. *, ** and *** indicate significance at the 10%, 5% and 1% levels, respectively.
Finally, the households’ assessment of quality is more positive in the South than in the North for extension services, while it is more positive in the North for private veterinarian services. Assuming, for a moment, that these assessments can be generalized to households that have not had access to these policies, it could be said that these assessments (physical accessibility and cost of service) can influence households' decisions to use these services, just as they (quality of service) can have an impact on the outcome being measured. It would therefore be important to take this information into account in our estimates. Unfortunately,
22
this information is too censored to be used directly in our estimates. However, including a dummy variable for the households’ region of residence (North or South) in our estimation will allow us to incorporate part of this information. In the literature, various methods have been proposed to construct a counterfactual based on nonexperimental observations. We use the inverse probability weighted regression adjustment (IPWRA) method, discussed in Wooldridge (2010), which combines regression adjustment (RA) and inverse probability weighting (IPW). One model is specified for the outcome
Yi f X
i,
i, (1)and another for the treatment
Pr
Ti 1
g X( i, ) , (2) for households i = 1…N, where N is the total number of households in our sample. In equations (1) and (2), Xi is a set of covariates that influence both the outcome,Y, and the dummy variable for treatment, T. and are parameter vectors to estimate, while
i is an error term. The function f can be specified as a linearfunction when the outcome is continuous, as in our case. As is also typical, we specify the functiong to be a probit function. One advantage of the IPWRA method
is that, under the usual ignorability assumption, one can obtain a consistent estimator of the effect of the treatment even if one of the two models is miss-specified (Wooldridge, 2007). In RA, a linear regression can be miss-specified to generate a predicted outcome, while no restriction is imposed about the treatment. Alternatively, in IPW, a probit regression can be used to predict the treatment status, while no formal model is assumed for the outcome.
We choose covariates that vary little over time to account for the fact that the data were collected five years after the beginning of the implementation of Initiative 3N. These stable covariates are in a sense surrogates for missing pretreatment covariates not affected by the treatment. Indeed, we lack baseline information on households before the policy implementation.
23
The observed characteristics that are assumed to affect the outcomes and household participation are the sex, highest reached education level and age of the household head, the region of residence (North or South) in line with the argument developed above, the proportion of children below 3 years of age, the proportion of children between 4 and 10 years of age, and the proportions of youths and young adults. These characteristics are likely to affect household food demand and diet composition. In particular, household composition may condition the type of food products that are consumed and shared within the household. For example, households with babies may consume more milk. Additionally, some household characteristics, such as the sex, age or level of education of the household head, can affect a household’s access to a given policy. Indeed, households with a high level of education can more easily obtain information about a policy, such as its start date and where it is implemented. Furthermore, some policies, such as extension services, may require minimal education to be able to implement the advice they provide. Finally, although this is not well recorded, the Initiative 3N may target some specific households on the basis of these sociodemographic characteristics.
We also include the household’s ethnic group and its livestock holding category in the treatment models since these characteristics may drive a household’s willingness to access a policy or be considered by public officials when targeting interventions. This may help us control for potential correlations between nutritional statuses and pro-poor policies. Recall that the holding categories correspond to a period prior to the survey and policy. However, we prefer not to use the livestock holding category as a covariate because this stratification may be too endogenous, notably when we will attempt to explain pastoral profit.
With the IPWRA method, the treatment effect is obtained by first estimating the parameters of the treatment model to generate the predicted probability of being treated for each individual, g X( i, )
ˆ , whereˆ is the estimate of . The obtained inverse probabilities for each observed household are used as weights in the regressions of the outcome models specific to each treatment (0 and 1).24
Then, to estimate the parameters of the outcome models, the IPW least-squares
estimator is calculated separately for each treatment:
0 2 0 ( , ) min ˆ 1 ( , ) N i i i i Y f X g X
ifT
i0
, (3) and
1 2 1 ( , ) min ˆ ( , ) N i i i i Y f X g X
ifT
i1
. (4) Finally, the average treatment effect (ATE) is obtained by computing the difference between the means of the predicted outcomes of the two treatment groups:1 [ ( , ˆ1) ( , ˆ0)] N i i i ATE f X f X N
, (5) where
ˆ1 and
ˆ0 are the estimated parameters.This procedure is also used to estimate the impact of the considered agricultural policies on the presumed mediator, i.e., the annual profit from livestock activities, by simply substituting it as the outcome variable.
IV.2 The effect of pastoral profit
In this subsection, which corresponds to link b in Figure 1, we discuss the impact of the mediator on household dietary intake. We use a regression setting to estimate the mean effect while including control variables (
X
i in the model below) that are the same as in the previous subsection.However, as mentioned above, there might be feedback influences between household production strategies and nutritional status or other types of confounders. To control for this, we run a 2SLS regression to estimate the effect of annual profit on dietary intake. The three instruments for profit are, first, a dummy variable that characterizes the overall quality of the pastoral season as experienced by the household, second, the average annual temperature at the departmental level and third, its squared value. The first instrument reflects the way in which the household experienced the previous pastoral season in terms of water and grazing availability and livestock disease. It takes the value 1 if the
25
household assesses the context of the previous pastoral season as favorable and 0 otherwise. With regard to the two temperature-based instruments, heat stress has been found to affect livestock health through oxidative stress, metabolic disruptions and reduced immunity to infections (Laceteva, 2019).
Formally, this amounts to jointly estimating the following two equations for each policy j:
Log(Profit)i = α0 + Tij α1 + Z’i α2 + X’i α3 + ωi
Yi = β0 + Log(Profit)i β1 + Tij β2 + X’i β3 + εi
(6)
and are vectors of parameters to be estimated, while ωi andεi are the error
terms of the second and first models, respectively. Tij represents the jth policy’s
treatment dummy for the ith household, while Zi denotes the three instruments for
this household. While not indicated in the notations to save space, the parameters and error terms vary with the considered policy.
System 6 allows us to estimate the impact of the mediator on household dietary intake while controlling for household access to a policy. The joint presence of the profit and policy variables in the outcome equation corresponds to the partial contributions of the direct and indirect effects to a change in outcome. The other controls are similar to those used for the ATE estimates for the policies.
The three instruments are found to be significantly linearly correlated with the logarithm of household pastoral profit (correlation coefficients of 0.18 for quality of pastoral season, -0.15 for the maximum local temperature in level and 0.15 for the maximum local temperature squared). However, they must also be uncorrelated with the error terms in the calorie intake and the dietary diversity score equations. Under this exclusion restriction, the instruments influence the outcome only through their linear correlations with the logarithm of pastoral profit.
The exclusion restriction for the quality of the pastoral season is justified by the fact that it is typically unexpected by households. A very bad pastoral season is
26
characterized by a lack of water and pastureland and several spells of livestock disease outbreaks, which reduce herd fertility and milk production and negatively affect household pastoral profits. It seems reasonable to assume that, given all the controls, the quality of the pastoral season has no direct impact on diets or that this impact can be neglected.
Regarding the other two instruments, i.e., the local maximum temperature and its squared value, the exclusion restriction is made plausible by climatic shocks being beyond the control of households and unanticipated. Then, one does not expect diet habits, given all controls, to be significantly affected by temperature. The frequency and severity of hydrological and agricultural droughts increase as the temperature rises (Vincente-Serrano et al, 2014; Amrit et al, 2018). Thus, high temperature reduces the availability of pastureland and water for animals, which in turn negatively impacts milk production and animal weight and reduces the market value of animals.
Although exclusion restrictions are ultimately untestable, the observed correlations in the data are encouraging (not shown). First, the absolute value of the correlation coefficients of each instrument with each outcome is found to be approximately two times smaller than the corresponding value for the same instrument with log profit. This is consistent with the instrument mostly affecting the outcome through its correlation with profit. Second, under exogeneity of profit, the semipartial correlations would indicate a linear correlation of the instrument with the relevant error term. Although this is no longer a consistent criterion for selecting instruments when the profit is endogenous, it is reassuring to find that the semipartial correlations of temperature in level and its squared value are not significantly different from zero for the log of total calories or the log of calories from animal food products.
A last point that remains to be discussed further is the presence of the treatment dummy in the second equation in (6). This specification corresponds to our motivation of investigating mediation effects, and in particular indirect effects, by estimating how the treatment affects the outcome in the presence of a control by the profit variable in the same equation. In that case, consistent with the usual
27
2SLS formula, the treatment dummy must also be included in the first-stage equation. That is, in this context, the treatment variable is considered to be akin to an exogenous regressor. This is possible here because the controls that were introduced for justifying ignorability in the average treatment effect estimation are also introduced in the two stages of the 2SLS. They can be seen here as proxying the relevant control function, as advocated by Wooldridge (2010). Indeed, in the typical control function approach for linear models, a residual (I-(Z’Z)-1Z’)T
is added to the equation to estimate, with Z denoting the controls and T denoting the potentially endogenous treatment. That is, the control function is a linear combination of a function of the normalized Z. In our approach, to simplify and make the procedure more comprehensible, we omit the normalization by (Z’Z)-1 and
directly introduce the Z as controls in the two estimation stages as needed. IV.3 Estimating the indirect and direct effects
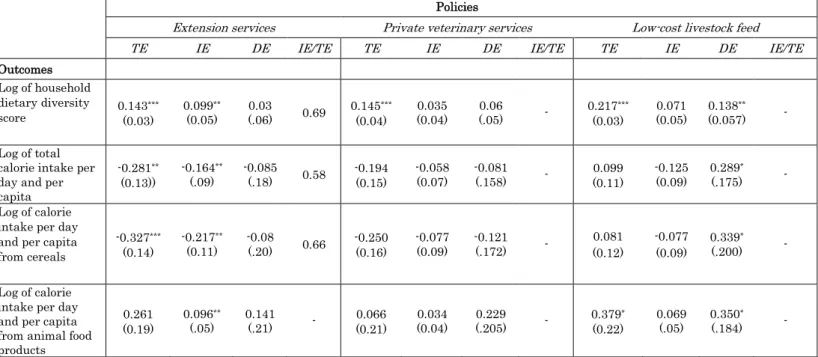
As mentioned above, the indirect effect is the effect that passes through the pastoral profit, while the direct effect (represented by link c’ in Figure 1) is the effect that operates through channels other than pastoral profit. The sum of these two effects forms the total effect (represented by link c in Figure 1).
The indirect effect is calculated as the product of the effect of policies on the mediator and the effect of the mediator on household dietary intake (links a and b, respectively, in Figure 1). The first effect a is estimated, on average, using the ATE formula in (5), while the second effect b is obtained from the estimates of System 6 for parameter1. The direct effect (c’) is therefore measured as the effect of the
policies on the outcome when controlling for the effect of the mediator. It is measured by the parameter 2 in the second equation in System 6. The
identification of this parameter partly relies on the controls for household characteristics Xi, which make the assumed conditional independence between the
28
The confidence intervals of the estimated indirect effect are computed with Monte Carlo simulations, as proposed by MacKinnon, Lockwood, and Williams (2004)11.
We now turn to the estimation and test results.
V.
Results
V.1. The total effects of the policies on dietary intake
The estimates of the unmediated, or total, effect of each of the three policies on nutrition intake are reported in Table 4. The hypothesis that the distribution of covariates is the same for the two treatment statuses is not rejected for any of the three policies.
For the dietary diversity score, the average treatment effect of each of the three policies is positive and significant. Households with access to extension services see their dietary diversity score increase by 14.3 percent relative to those that did not. Moreover, having access to private veterinary services increases a household’s dietary diversity score by an almost identical extent of 14.5 percent. Finally, the total average effect of deliveries of low-cost livestock feed raises the dietary diversity by 21.7 percent.
With regard to calorie intake per capita per day, only extension services have a significant impact. This impact decreases calorie intake per capita per day by 28 percent for households that have access to extension services. The other two policies do not have any significant effects on total calorie intake. The effects of each policy are very similar when considering calorie intake from cereals. This suggests that the surprising negative impacts of extension services on total calorie intake could be explained by a decline in the consumption of cereal foods.
11Starting with two estimates for the effects a and b and their standard errors, two simulated random normal
variables a and b are generated to compute a distribution of a*b values. With these values, confidence intervals and p-values can be estimated by their simulated analogs.
29
Table 4: Total effect of the selected policies on household dietary intake
Log of household dietary diversity score
Log of total calorie intake per day and per
capita
Log of calorie intake per day and per capita
from cereals
Log of calorie intake per day and per capita
from animal food products
ATE ATE ATE ATE
Extension services
Access to extension services 0.143*** (0.03) -0.281** (0.13) -0.327*** (0.14) 0.261 (0.19) Testing covariates balance:
(Chi-square test) [0.80] [0.80] [0.80] [0.75]
Veterinary services Access to private veterinary services 0.145*** (0.04) -0.194 (0.15) -0.250 (0.16) 0.066 (0.21) Testing covariates balance
(Chi-square test) [0.38] [0.38] [0.38] [0.47]
Input subsidies
Access to low-cost livestock feed 0.217*** (0.03) 0.099 (0.11) 0.081 (0.12) 0.379* (0.22) Testing covariates balance:
(Chi-square test) [0.93] [0.93] [0.93] [0.96]
Number of Observations 596 596 596 511
Notes: ATE: Average treatment effect. Values in brackets are p-values, and values in parentheses are robust standard errors. *, ** and *** indicate significance at the 10%, 5% and 1% levels, respectively.
However, opposite policy effects are observed for the calorie intake from animal food products. For both extension services and low-cost livestock feed programs, the results show positive policy effects, although only the effect of the latter program is significant at the 10 percent level. Nevertheless, a positive and small nonsignificant impact is observed for private veterinary services. The positive effects, even if not significant, of extension services and low-cost livestock programs are consistent with their presumed beneficial contribution to the dietary diversity score. Increasing the dietary diversity for households with diets mainly composed of cereals generally amounts to augmenting their consumption of animal food products. Nevertheless, the negative impact of extension services on total calorie intake raises the question of its origin. Mediation analysis will shed further light on this.
Three hypotheses could explain this intriguing result. The first is the presence of a perverse effect of the examined policy, which may foster household specialization in pastoral activities at the expense of agricultural production. The second hypothesis is that the policy changed the food habits of agro-pastoralist households, which may have substituted additional consumption of animal food products for cereal food products. The third hypothesis is that of measurement
30
errors in calorie intake data. Examining these hypotheses, especially the first one, is the purpose of the next sections.
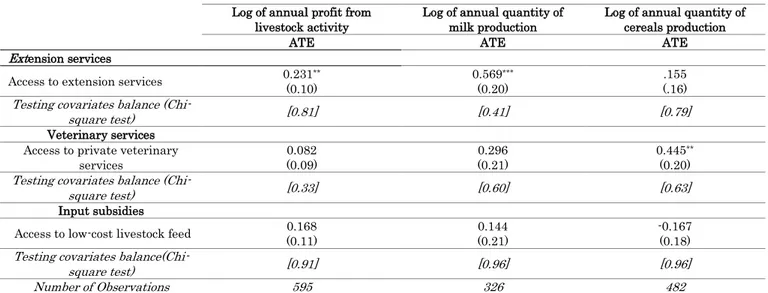
V.2. The effects of the policies on profit and production levels
Table 5 reports the estimated average treatment effects of the considered policies on household pastoral profit and cereal and milk production levels, all in logarithm.
Table 5: Effects of the policies on household profit and production levels
Log of annual profit from livestock activity
Log of annual quantity of milk production
Log of annual quantity of cereals production
ATE ATE ATE
Extension services
Access to extension services 0.231(0.10) ** 0.569(0.20) *** (.16) .155 Testing covariates balance
(Chi-square test) [0.81] [0.41] [0.79]
Veterinary services Access to private veterinary
services 0.082 (0.09) 0.296 (0.21) 0.445** (0.20) Testing covariates balance
(Chi-square test) [0.33] [0.60] [0.63]
Input subsidies
Access to low-cost livestock feed 0.168 (0.11)
0.144 (0.21)
-0.167 (0.18) Testing covariates
balance(Chi-square test) [0.91] [0.96] [0.96]
Number of Observations 595 326 482
Notes: We consider only the three main cereal products: millet, sorghum and cowpea. ATE: Average treatment effect. Values in brackets are p-values, and values in parentheses are robust standard errors. *, ** and *** indicate significance at the 10%, 5% and 1% levels, respectively.
None of the three policies, except private veterinary services, have a significant impact on the production levels of the three main cereals (millet, sorghum and cowpea)12. Only extension services have a significant and positive effect on the
annual profits of households from livestock activity. Access to this policy increases a household’s annual pastoral profit by 23 percent, on average. The effects of the two other policies on profits are positive but not significant. Additionally, these two policies do not have any significant effects on milk production.
In that sense, among the considered policies, only extension services seem to have achieved the policy objective of enhancing pastoral profit, especially because they are the only ones with a positive and significant impact on milk production. In contrast, private veterinary services and low-cost livestock feed programs have failed to reach this objective. It is therefore interesting to learn whether the
31
positive effect of extension services on household profits is transmitted to dietary intake.
The non-significant effect of veterinary services on household pastoral profit could be explained by households using this policy to limit the damage that diseases can cause to their herds. They do not seem to be taking a preventive approach when they decide to use this service but rather aim to care for sick animals. Therefore, when massive disease outbreaks occur in the considered year, the effects of this policy do not emerge. Moreover, when they face these negative shocks frequently and repeatedly, pastoral and agro-pastoral households may convert to agriculture to increase their capacity to meet their food needs in these difficult times. Indeed, there are reports about Tuareg herders in Niger switching to agriculture after experiencing livestock losses due to drought and disease (Le Point, 2019). This could partly explain the positive and significant effect of veterinary services on households’ production of the main cereals.
Extension services, the only policy that significantly and positively affects pastoral profit and milk production, also have a negative effect on calorie intake from cereals and a positive effect on calorie intake from animal products, as shown above in Table 4. Therefore, production and consumption substitution between cereal products and animal food products may have taken place after this policy, which would contribute to explaining these effects.
V.3. The effects of profits on dietary intake
As mentioned above, the effects of pastoral profit on dietary intake are estimated by running linear 2SLS regressions, in which the dietary intake measures are the dependent variables, and the annual profit is an independent endogenous variable. The control variables Xi are the same as those used when modeling the total
treatment effect on the outcome variables. The estimates of the mediation model are presented in Tables 6a to 6c for the three policies.
With regard to extension services (Table 6a), the exogeneity hypothesis of the logarithm of profit is rejected at the five percent level and below for all the considered dietary outcomes, except for the logarithm of calories from animal products. This leads us to estimate the model using 2SLS with the three