HAL Id: hal-01021793
https://hal-enac.archives-ouvertes.fr/hal-01021793
Submitted on 31 Oct 2014
HAL is a multi-disciplinary open access
archive for the deposit and dissemination of
sci-entific research documents, whether they are
pub-lished or not. The documents may come from
teaching and research institutions in France or
L’archive ouverte pluridisciplinaire HAL, est
destinée au dépôt et à la diffusion de documents
scientifiques de niveau recherche, publiés ou non,
émanant des établissements d’enseignement et de
recherche français ou étrangers, des laboratoires
Signal distortions at GNSS payload level
Emilie Rebeyrol, Christophe Macabiau, Olivier Julien, Lionel Ries, Jean-Luc
Issler, Michel Bousquet, Marie-Laure Boucheret
To cite this version:
Emilie Rebeyrol, Christophe Macabiau, Olivier Julien, Lionel Ries, Jean-Luc Issler, et al.. Signal
distortions at GNSS payload level. ION GNSS 2006, 19th International Technical Meeting of the
Satellite Division of The Institute of Navigation, Sep 2006, Fort Worth, United States. pp 1595-1605.
�hal-01021793�
Signal Distortions at GNSS Payload Level
Emilie Rebeyrol, Christophe Macabiau, Olivier Julien, ENAC/TéSA Lionel Ries, Jean-Luc Issler, CNES
Michel Bousquet, SUPAERO Marie-Laure Boucheret, ENSEEIHT
BIOGRAPHY
Emilie Rebeyrol graduated as a telecommunications engineer from the INT (Institut National des Télécommunications) in 2003. She is now a Ph.D student at the satellite navigation lab of the ENAC. Currently she carries out research on Galileo signals and their generation in the satellite payload in collaboration with the CNES (Centre National d’Etudes Spatiales), in Toulouse.
Christophe Macabiau graduated as an electronics engineer in 1992 from the ENAC (Ecole Nationale de l’Aviation Civile) in Toulouse, France. Since 1994, he has been working on the application of satellite navigation techniques to civil aviation. He received his Ph.D. in 1997 and has been in charge of the signal processing lab of the ENAC since 2000.
Olivier Julien is an assistant professor at the signal processing laboratory of ENAC (Ecole Nationale de l’Aviation Civile), Toulouse, France. His research interests are GNSS receiver design, GNSS multipath and interference mitigation and GNSS interoperability. He received his B.Eng in 2001 in digital communications from ENAC and his PhD in 2005 from the Department of Geomatics Engineering of the University of Calgary, Canada.
Lionel Ries is a navigation engineer in the "Transmission Techniques and Signal Processing Department", at CNES since June 2000. He is responsible of research activities on GNSS2 signals, including BOC, MBOC modulations and modernised GPS signals (L2C & L5). He graduated from the Ecole Polytechnique de Bruxelles, at Brussels Free University (Belgium) and then specialized in space telecommunications systems at Supaero (ENSAE), in Toulouse (France).
Jean-Luc Issler is head of the Transmission Techniques and signal processing department of CNES, whose main tasks are signal processing, air interfaces and equipments in Radionavigation, TT&C, propagation and spectrum survey. He is involved in the development of
several spaceborne receivers in Europe, as well as in studies on the European RadioNavigation projects, like GALILEO and the Pseudolite Network. With DRAST and DGA, he represents France in the GALILEO Signal Task Force of the European Commission. With Lionel Ries and Laurent Lestarquit , he received the astronautic prize 2004 of the French Aeronautical and Astronautical Association (AAAF) for his work on Galileo signal definition.
Michel Bousquet is a Professor at SUPAERO (French Aerospace Engineering Institute of Higher Education), in charge of graduate and post-graduate programs in aerospace electronics and communications. He has over twenty five years of teaching and research experience, related to many aspects of satellite systems (modulation and coding, access techniques, onboard processing, system studies...). He has authored or co-authored many papers in the areas of digital communications and satellite communications and navigation systems, and textbooks, such as “Satellite Communications Systems” published by Wiley.
Marie-Laure Boucheret graduated from the ENST Bretagne in 1985 (Engineering degree in Electrical Engineering) and from Telecom Paris in 1997 (PhD degree). She worked as an engineer in Alcatel Space from 1986 to 1991 then moved to ENST as an Associated Professor then a Professor. Her fields of interest are digital communications (modulation/coding, digital receivers, multicarrier communications …), satellite on-board processing (filter banks, DBFN …) and navigation system.
ABSTRACT
With the development of Galileo and modernized GPS and the increase in performance of the associated signals (ALTBOC, MBOC, BOCcos...), various contributors, often neglected, may become essential factors in the payload design to better characterize the navigation signals and to asses their best achievable performance. In navigation systems these contributors could be:
the phase noise introduced by the satellite and receiver clocks oscillators,
the signal distortions due to payload amplifier, The aim of this paper is to analyze and optimize, thanks to simulations, the phase noise and the signal distortions introduced by the payload amplification unit. These distortions will be compared to the distortions due to the clock unit phase noise and their impact at different stages of the payload will be evaluated for a signal similar to the signals used in navigation systems.
The first part of this paper will present the payload model chosen for the simulations and particularly the amplification unit. The clock phase noise model and the amplifier characterization will also be exposed. Then, the simulated navigation signal will be defined.
Afterwards using Matlab simulations, the influence, on the receiver performance, of clock phase noise and amplifier non-linearities will be studied. Moreover, the influence of the filters position and bandwidth in the payload and the influence of the value of the amplifier input back-off (IBO) will be examined.
To conclude, the suitable operating point of the payload amplifier and the best payload configuration will be determined.
I. INTRODUCTION
At the beginning of the year the first Galileo satellite, called GIOVE-A, has begun transmitting. The various Galileo signal modes are currently generated using the GIOVE-A payload chain. Even if the characterization of the Galileo payload performance has already started with this launch, studies are still carried out to analyze possible distortions on the signals at the satellite payload level. Indeed the identification of these distortions is necessary since they could limit the absolute precision of the satellite positioning system. Moreover the distortions identification permits to evaluate all options and parameters influence on the generation quality.
At the payload level, the main signals distortions are due to the atomic clocks and the amplifier unit. Indeed the atomic clocks, even if they are very stable, suffer from instabilities, which create phase noise. This phase noise, introduced on the signal during the up-conversion, could distort it and consequently reduce its inherent performance when processed by the receiver. As for the amplifier unit, it is composed of a non-linear amplifier, which could introduce signal impairments because of its non-constant Amplitude-Modulation to Phase-Modulation (AM/PM) characteristics.
The aim of this paper is to characterize the influence of payload phase noise and amplifier non-linearities on the signal generation and on the receiver performance.
First the payload model chosen for this study will be presented. The different payload units and the distortions
that they introduce during the signal generation will be set out.
Then the simulated navigation signals will be presented. In the chosen case study, the E5 signal has been chosen for its innovative characteristics. it uses a constant envelope modulation, known as AltBOC(15,10), while having an extremely wide emission bandwidth (92 MHz). It is thus considered that the payload filter bandwidth will be a key parameter since the signal emission bandwidth is close to the amplifier maximum allowable bandwidth.
Afterwards thanks to simulations, the influence, on the receiver performance, of the clock phase noise and amplifier non-linearities will be investigated. The receiver performance will be evaluated according to typical code and phase tracking figures of merit:
• for code tracking, the distortions on the autocorrelation function and the power spectral density functions are studied,
• for phase tracking, the computation of the 1- phase tracking error, available once the phase noise PSD is estimated, will be used.
The modulation phase diagram will also be investigated to evaluate the distortion induced by the amplifier on the signal constant envelope. The influence of the amplifier phase noise will also be compared to the influence of the atomic clocks phase noise on the phase error estimation in the receiver Phase Lock Loop. The simulations will de done considering different amplifier IBO to find the most suitable amplifier operating point.
To finish the simulations results will be compared to determine the best payload configuration.
II. PAYLOAD MODEL
The payload considered in this study is similar to the Galileo payload, presented on the European Space Agency website (Figure 1). It is composed of several sub-systems: a clock unit, a Navigation Signal Generation Unit (NSGU), a Frequency Generation and Modulation Unit (FGMU), an amplifier unit and an Output MUltipleX unit (OMUX).
Figure1: Galileo generic payload
The Clock Unit
The satellites will carry a clock ensemble, composed of atomic clocks: Passive Hydrogen Maser (PHM) and Rubidium Atomic Frequency Sources (RAFS) that provide the time reference for the generation of the navigation signal. The atomic reference is selected from one of the atomic clocks and converted to the Master Timing Reference (MTR) of 10.23 MHz by the Clock Monitoring and Control Unit (CMCU). Even if they are very stable the atomic clocks are disturbed by unavoidable processes such as random noise, which create phase noise [IEEE Std. 1139-1988]. Consequently, the MTR delivered by the CMCU will suffer from phase noise.
The power spectral density of the inherent phase noise of the 10.23 MHz signal at the output of the CMCU ([Moreno Carrillo et al., 2005]) is represented on Figure 2:
Power Spectral Density of the CMCU phase noise [Moreno Carrillo, 2005] -160 -150 -140 -130 -120 -110 -100 -90 -80
1 10 100 1,00E+03 1,00E+04 1,00E+05
frequency offsets [Hz] S S B p ha se n oi se [d B c/ H z]
Figure 2: Power Spectral Density of the clock unit phase noise
The Navigation Signal Generation Unit
The NSGU generates the navigation signal and modulates it in the different emission bands. It is composed of a modulation circuit, called modulator and a numerical filter. The NSGU modulator generates several numerical modulated base-band signals, one for each frequency bands. After that the modulator, according mostly to the signal bandwidth, can:
put the base-band signals around a numerical intermediate frequency to avoid the problems linked to the setting and ageing of the analog mixer. This could be, for instance, used for Galileo E1 signals. Or transmit the base-band signals’ in-phase and
quadrature components because their transmission around an intermediate frequency is not possible owing to their large bandwidth, which would impose a sampling frequencies not currently realistic. This could be, for instance, used for the Galileo E5 signals. After being modulated, the signals are filtered by a numerical filter, which bandwidth is at least equal to the transmitted signals bandwidth, to respect out-of-band rejection and avoid aliasing that could appear during the FGMU processes. It has to be noted that the choice of the filter bandwidth is important (and this is true for every payload module using filtering operations), since it will cut the useful signal spectrum and, if not properly chosen, could destroy the desirable constant envelope property of the signals.
The Frequency Generation and Modulation Unit
The FGMU structure is shown in Figure 3. It has been described in details in [Rebeyrol et al., 2006]. The FGMU is composed of a digital-to-analog (DAC) converter followed by large band filters and several frequency synthesizers which use the reference time delivered by the clock unit to generate the intermediate frequencies, used for the signals up-conversion.
The DAC converter generates an analog signal from the digital signal coming from the NSGU. According to [Rebeyrol et al., 2006], the phase noise introduced by the DAC is low compared to the phase noise introduced during the up-conversion and the amplification operations; consequently it will be neglected in this study. After being converted to analog, the navigation signals are up-converted in one or more up-conversion stages. Each frequency used to realize the up-conversion comes from a frequency synthesizer, based on a simple single-loop phase lock single-loop (PLL) and described in [Rebeyrol et al., 2006]. Figure 4 represents the generic block diagram of a FGMU frequency synthesizer [Robins, 1982]:
Figure 4: Frequency synthesizer generic scheme
The frequency synthesizer uses the reference frequency delivered by the clock unit to generate a higher frequency which permits to realize the up-conversion. As calculated in [Rebeyrol et al., 2006], the PSD of the phase noise at the frequency synthesizer’s output, using the model shown in Figure 4, is determined by:
( )
f S( )
f N2 H( )
f 2 S( )
f 1 H( )
f 2Sout = CU ⋅ ⋅ + vco ⋅ −
where SCU is the power spectrum density of the clock
unit phase noise,
vco
S is the power spectrum density of the payload VCO phase noise, and
H is the PLL closed loop transfer function equal to:
( )
( )
( )
( )
( )
N s F K K s N s F K K s s s H PD VCO PD VCO ref out ⋅ ⋅ + ⋅ ⋅ = = θ θwith F the transfer function of the loop filter, and
VCO
K and KPD are the gains of the VCO and of
the phase detector.
Consequently, if the up-conversion is realized in one stage, the phase noise added to the navigation signal during the down-conversion is perfectly characterized by Sout(f). But if the up-conversion is realized in several
stages, the phase noise added on the signal is characterized by:
( )
f S( )
f S( )
f S( )
fSout = φ1 + φ2 +...+ φn
where n represents the up-conversion stages number, and
( )
( )
2( )
2( )
( )
2 1 H f f S f H N f S f Sφi = φCU ⋅ i ⋅ i + φvco ⋅ − i with Ni2 = N and( )
( )
( )
i PD VCO i PD VCO i N s F K K s N s F K K s H ⋅ ⋅ + ⋅ ⋅ =An optimal value of n could be calculated to minimize the global phase noise introduced on the signal. However, to simplify the calculation, the worst case will be considered in this study, which means when the up-conversion is realized in only one stage. In this case, N depends only on the signal central frequency.
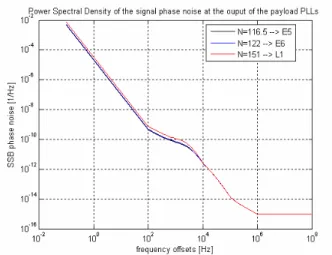
In the Galileo case, the phase noise added to the navigation signals during the up-conversion is shown in Figure 5. It can be seen that the L1 signal, due to its higher carrier frequency, will undergo higher phase noise.
Figure 5: Power Spectrum Densities of phase noise added during the up-conversion
After the up-conversion, the signals are then filtered by a large band filter to avoid, as after the DAC, the out-of-band emission and to eliminate the frequency harmonics.
The Amplifier Unit
After the propagation through the FGMU, the signal is amplified thanks to a non-linear amplifier. In this study, a Solid State Power Amplifier (SSPA) is considered, as in the Galileo payload according to [Coromina et al., 2004]. To characterize a non-linear amplifier as the SSPA, the AM/AM and AM/PM curves (AM: amplitude modulation, PM: phase modulation) are used. Figure 6 and Figure 7 present the AM/AM and AM/PM curves of the considered amplifier.
AM/AM -10 -5 0 5 10 15 20 25 30 35 -20 -10 0 10 20 Pin (dBm) P ou t ( dB m )
Figure 6: Considered SSPA AM/AM characteristic
AM/PM 80 85 90 95 100 105 110 115 120 0 2 4 6 8 10 12 14 Pin (dBm) S 21 (º )
Figure 7: Considered SSPA AM/PM characteristic
It can be seen that the considered SSPAS saturation point corresponds to an input power of 16.9 dBm and an output power of 30.1 dBm.
The AM/PM curve shows that the amplifier phase output is not constant according to the input signal power. Thus, a signal with a non-constant envelope will entail phase distortion. These distortions could affect the modulation constellation plot and thus lead to errors on measurements.
The Output Multiplexer
At the payload output, before the antenna subsystem, an Output Multiplexer (OMUX) is required to combine, before emission, the output signals from the SSPAs, each at close-spaced frequencies.
The OMUX is generally considered to be close to a sixth-order Butterworth filters whose bandwidths are equal to the specified navigation signals emission bandwidths.
The multiplexers, on top of the signals combination, permit to eliminate the intermodulation products and the secondary lobes recoveries due to the amplifier unit.
Conclusion
The navigation signals are generated and filtered in the NSGU before being up-converted in the FGMU. During this up-conversion, phase noise due to the clock unit instabilities could be introduced on the signals. Afterwards the signals are amplified by SSPAs, which could distort them due to their non-linearities. Then they are filtered by OMUXs before being transmitted by the antenna.
Considering the payload model presented above, simulations will be carried out to evaluate the impairments introduced by the different units. The signal considered for these simulations, the E5 signal, is presented in the next section.
II. SIGNAL MODEL
The signal considered for this study is the constant envelope Alternate Binary Offset Carrier (ALTBOC) signal. It has a large bandwidth close to the maximum acceptable bandwidth for the amplifier. Consequently the payload NSGU generates it in base-band to avoid the problem of a too high sampling frequency.
An ALTBOC(15,10) is simulated to match the signal proposed to transmit the Galileo E5 band signal. This signal can be defined, for instance, in the following way [Soellner and Erhard, 2003]:
(
)
(
)
(
)
(
+ ⋅)
⋅ + ⋅ − + − ⋅ − ⋅ ⋅ + + − ⋅ + ⋅ ⋅ + + − ⋅ − ⋅ ⋅ + = 4 ) ( 4 ) ( 4 ) ( 4 ) ( ) ( ' ' ' ' _ Ts t sc j t sc c j c Ts t sc j t sc c j c Ts t sc j t sc c j c Ts t sc j t sc c j c t x ap ap U U ap ap L L as as U U as as L L BOC ALTwith cu is the data upper (E5b) code, cu’ the pilot upper
(E5b) code, cL the data lower (E5a) code and cL’ the pilot
lower (E5a) code.
' ' ' ' ' ' ' ' L L U u L U L U L U U L L U U L c c c c c c c c cc c c c c c c = = = = and
(
)
(
)
(
)
(
)
+ − + − − = + + + − = 4 2 cos 4 2 2 cos 2 1 4 2 cos 4 2 ) ( 4 2 cos 4 2 2 cos 2 1 4 2 cos 4 2 ) ( π π π π π π π π π π t f sign t f sign t f sign t sc t f sign t f sign t f sign t sc S S S ap S S S asIts modulation constellation and its spectrum are represented on Figure 8 and Figure 9.
Figure 8: Constant Envelope ALTBOC(15,10) Modulation Constellation
Figure 9: Constant Envelope ALTBOC(15,10) Power Spectrum Density
The E5 emission bandwidth is considered to be equal to 90*1.023 MHz, to be in accordance with [GJU, 2005].
The AltBOC can also be more simply generated and defined. Surprisingly, this rather complex modulation scheme can be easily implemented using simple look-up tables for the phase assignments. As seen above, the ALTBOC features a 8-PSK constellation. The idea is here to allocate any of the 4 codes and 8 sub-carrier phases combinations to a phase spot in the constellation, using a look-up table, and then to generate the corresponding I and Q signals prior to digital-to-analog conversion. The value of the constellation spot is a function of the value of the 4 codes [-1 or +1], and the carrier period is divided into 8 time bins: the time bin into which (t mod Ts) falls. There are 4 binary codes, resulting in 16 (24) code combinations: this means that there are a total of 128
different phase plots, whose value may vary between 1 and 8. The following figure presents a simple ALTBOC generation diagram and the table 1 the look-up tables associated [Ries et al, 2003 ].
Figure 10: Simple E5 ALTBOC 8PSK generation diagram
Manipulating the 8PSK-ALTBOC expressions, the following look-up table can be produced:
Table 1: Example of ALTBOC Look-up table
III. SIMULATIONS RESULTS
The objective of the simulations is to evaluate the influence of the payload clock unit phase noise and amplifier non-linearities on the signal generation. These simulations will show the signal distortions induced by these payload units.
Figures of merit
Different figures of merit are used to evaluate the signal distortions on performance:
the correlation function, in order to evaluate phase noise and non-linearities influence on the code tracking performance thanks to the observation of the correlation peak (correlation loss and peak sharpness),
the power spectrum density to notice a possible spectrum distortion or a side lobe rise, which could lead to interferences with other signals,
the modulation constellation to examine the variation of the signal constant envelope
the phase error estimation to assess the error induced by the clocks phase noise and amplifier non-linearities as seen by a typical receiver PLL.
The PLL phase error is estimated thanks to the following equation [Irsigler and Eisfeller, 2002; Rebeyrol et al., 2006]:
( )
∞ ⋅ − ⋅ = 0 2 2 S (f) 1 H jf df e N σwhere SNe is the single-sideband power spectrum
density of the incoming phase noise, and
H is the transfer function of the PLL.
In this study, a third-order PLL is considered, since it represents the most common order used in receivers. Consequently the following model can be used [Irsigler and Eisfeller, 2002]: 6 6 6 2 ) ( 1 f f f jf H L+ = − where fL =2π*1.2*BL, and L
B is the loop noise bandwidth.
This equation has been validated through extensive simulations using a PLL loop tracking the generated ALTBOC(15,10) signal only distorted by the above-mentioned phase noise error. This validation step also allowed us to be confident in the estimation of the phase noise power spectrum density and thus to use this method to investigate the phase noise characteristics at different stages of the payload.
The four introduced figures of merit will be plotted or calculated at different points in the payload chain to be able to compare the influence of each unit on the generated signal.
Results
The first test was to verify the justification for choosing a constant envelope signal. Assuming no signal filtering, and the presence of the phase noise inherent the aforementioned clock unit, two signals (one with and one without constant envelope properties) are passed through the specified SSPA. A PLL is then used at the output of the SSPA to assess the resulting phase error. It can be noticed from Figure 10 that the SSPA does not introduce phase noise on a constant envelope signal whereas it strongly distorts the phase of a non constant envelope signal. That is the reason why our study is focused on the signal with a constant envelope.
Figure 11: SSPA Impact on Phase Noise for a Constant and Non-Constant Envelope Signal (BL=10 Hz)
Figure 12 represents the modulation constellation of a constant envelope ALTBOC(15,10), and the distortion induced by the up-conversion and amplification units. It can be seen that the phase noise introduced by the up-conversion stage has an impact on the modulation plot, but the constant envelope property remains.
Figure 12: ALTBOC(15,10) Modulation Constellation
The resulting phase error, shown in Figure 13, shows that a constant envelope signal is then only slightly distort by an amplifier (no filtering is considered in the chains).
Figure 13: Up-Conversion and SSPA Impact on Phase Noise for a Constant and Non-Constant Envelope Signal
(BL=10 Hz)
Moreover the simulations prove that in the case of a constant envelope the up-conversion distorts more the
Non constant envelope signal Constant envelope signal SSPA SSPA Constant envelope signal Up-conv. SSPA = 0.04° = 0.06° = 8e-4° = 1° Non Constant envelope signal Up-conv. SSPA = 1° = 4.3°
modulation constellation than the amplification. It is the contrary with a non-constant envelope signal.
However, the ALTBOC(15,10) signal will not enter in the amplification unit with a constant envelope because of the NSGU numerical filter which has been initially considered with a 92 MHz bandwidth in our payload model (restricted to allowed emission bandwidth). This filtering process will distort the signal envelope, and particularly will reduce the constant envelope property of the signal. This can be seen in Figure 14. It is then understood that keeping an NSGU filter bandwidth of 92 MHz will significantly distort the signal at the output of the SSPA.
Figure 14: ALTBOC(15,10) Modulation Constellation After Filtering using a 92 MHz Bandwidth
Consequently the distortions introduced by the amplifier will be higher than the phase noise introduced by the up-conversion, as shown in Figure 15. It can be seen that there is, in this configuration, no advantage in generating a constant envelope signal.
Figure 15: Up-Conversion and SSPA Impact on Phase Noise for a Constant and Non-Constant Envelope Signal
Using a 92 MHz Filter (BL=10 Hz)
It was thus decided to maximize the NSGU bandwidth as much as possible, since the OMUX will anyway filter the signal to its specified emission bandwidth. However, there is a limitation on the SSPA input bandwidth
considered equal to 100 MHz. Thus, this bandwidth was chosen for the NSGU filter, resulting in the modulation plot shown in Figure 16. The plot is still strongly modified and the signal envelope is still not constant.
Figure 16: ALTBOC(15,10) Modulation Constellation After Filtering using a 100 MHz Bandwidth
So, it will be interesting to calculate the values obtained for the equivalent PLL phase error for different loop bandwidths at several payload stages, considering a 100 MHz NSGU filter. To evaluate these errors, the calculation of the phase noise power spectrum densities of the signal after the up-conversion and after the amplification is required. Figure 17 represents these single side band spectrums and the following table summarizes the results found for two different loop bandwidths. It can be seen that the amplifier adds noise in the high frequency components.
Figure 17: Constant Envelope ALTBOC Single Side Band Phase Noise
= 2.85°
NSGU
Filter conv. Up- SSPA Ct
envel.
= 0.1°
NSGU
Filter conv. Up- SSPA No Ct
envel.
= 0.1°
PLL phase error
[°] BL = 2 Hz BL =10 Hz
1 0.27 0.06
2 0.3 0.11
Table 2: Estimated Phase Error at the Up-converter and SSPA Outputs
Figure 17 and Table 2 show that the phase noise introduces by the amplifier non-linearities, if a 100 MHz NSGU filter is considered, is significantly smaller than with a 92 MHz filter. Still, the phase noise introduced by the SSPA is higher than the phase noise due to atomic clocks and introduced on the signal during the up-conversion. This is particularly true when high PLL bandwidth are used (since as already mentioned, mostly high frequency phase noise is added by the SSPA)
The next simulations show the impact of the NSGU filter, of the up-conversion and of the amplifier on the signal correlation function and spectrum.
The correlation functions, on Figure 18 and Figure 19, show that the main correlation losses are due to the NSGU filter. Indeed, after the NSGU filter, the correlation peak is larger compared to the autocorrelation of the signal and a correlation loss equal to 0.1 dB is observed.
The correlation of the signal after the up-conversion is similar to the correlation observed after the NSGU filter, no correlation loss is introduced.
The correlation function observed after the amplifier show that the amplifier does not introduce correlation loss but it introduces a slight distortion of the correlation peak. The amplifier has more influence on the correlation function than the up-conversion.
Figure 18: Correlation Functions: from NSGU to Amplification Unit
Figure 19: Zoom on Correlation Functions
On Figure 20, the constant envelope ALTBOC power spectrum densities before and after the NSGU filter are plotted.
Figure 20: Power Spectrum Densities: before and after the NSGU filter
NSGU
Filter conversion Up- SSPA
OMUX
2 1
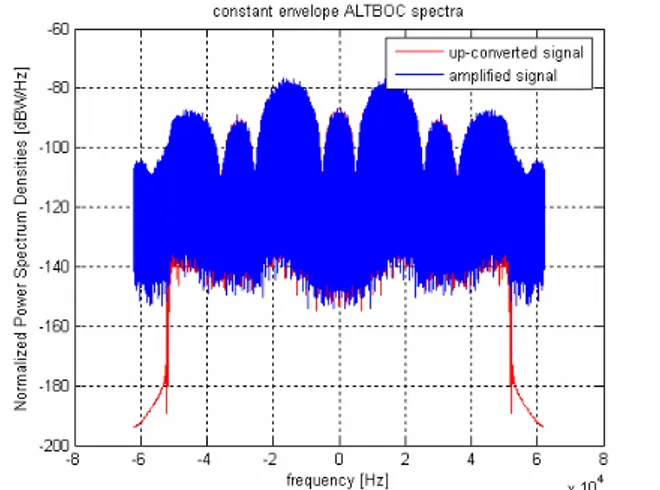
Figure 21 represents the signal spectra after the up-conversion and after the amplification. It can be noticed that the up-conversion does not add noise on the spectrum contrary to the amplifier. Indeed the amplifier introduces a rise of the side-lobes at the spectrum extremities. This explains the slight modification of the correlation function shown in Figure 19.
Figure 21: Power Spectrum Densities: from amplification unit to OMUX output
Thanks to its 92 MHz filter, the OMUX permits to eliminate the distortions introduced by the amplifier on the spectrum (shown in Figure 21) and allows avoiding possible interference with other signals or systems.
Figure 22: OMUX effect on amplified signal spectrum
All the simulations have been made considering that the amplifier operates at its saturation point. That means that the SSPA amplifies the signal with an Input Back-Off (IBO) equal to 0 dB. The saturation point is the optimal operating point of the amplifier when the signal is considered with a constant envelope. However it has been seen that the NSGU filter makes the signal envelope non constant, consequently it will be interesting to evaluate
the phase error due to the amplifier for several classical IBOs. Table 3 summarizes the results.
IBO (dB) 0 1 2
PLL phase error
(BL = 10 Hz) 0.11° 0.19° 0.33°
Table 3: PLL phase error in function of IBO for a 100 MHz bandwidth ALTBOC
This table shows that the best amplifier operating point is in fact the saturation point even though the signal envelope is not constant because of the NSGU filter.
IV. CONCLUSION
To conclude, the simulations have shown that the NSGU filter destroys the advantage of the constant envelope of the signal if its bandwidth is too narrow. This is the case on E5 if the NSGU filter bandwidth is the E5 emission bandwidth (92 MHz). Thus its bandwidth should be slightly smaller than the maximum acceptable bandwidth at the amplifier input. A value of 100 MHz was used in this paper as an example.
The simulations have also shown that the noise introduced on the signal phase by the amplifier is higher than the phase noise due to the atomic clocks and introduced on the signal during the up-conversion, if an acceptable bandwidth is found for the NSGU filter. It was also demonstrated that the saturation point is the best operating point of the amplifier from the point of view of the phase affected a PLL.
Moreover further studies should be done to consolidate these results. It would also be interesting to realize the same study considering a non-constant envelope signal or a signal with a smaller bandwidth, such as the Galileo L1 signals. Finally, the results obtained should also be compared to experimental in real conditions.
REFERENCES
[Coromina et al., 2004]: “On-board Applications of Active Microwave Technologies to GALILEO and other European Space Programs” – F. Coromina, F. Deborgies, F. Emma, G. Gatti – 12th GAAS Symposium – 2004.
[GJU, 2005]: “L1 Band part of Galileo Signal in Space ICD” – Galileo Joint Undertaking – 3GPP TSG GERAN2 meeting – 2005.
[IEEE Std. 1139-1988]: IEEE Standard Definitions of Physical Quantities for Fundamental Frequency and Time Metrology.
[Irsigler and Eisfeller, 2002]: “PLL Tracking Performance in the Presence of Oscillator Phase Noise” – M. Irsigler and B. Eisfeller – GPS solutions – Spring 2002.
[Jeanmaire and Emma, 1999]: “Rubidium Atomic Clock for Galileo” – A. Jeanmaire, F. Emma – 31st Annual
Precise Time and Time Interval (PTTI) Meeting, 1999. [Moreno Carrillo et al., 2005]: “Hybrid Synthesizers in Space Galileo’s CMCU” – F.J. Moreno Carrillo, A. Alvaro Sanchez, L. Basanta Alonso – Data Systems In Aerospace Conference – June 2005.
[Parkinson and Spilker, 1996]: “Global Positionning System: Theory and Applications” – Volume 1.
[Rebeyrol et al., 2005]: “BOC Power Spectrum Densities” – E. Rebeyrol, C. Macabiau, L. Lestarquit, L. Ries, J-L. Issler, M-L. Boucheret, M. Bousquet – ION NTM 2005 – January 2005.
[Rebeyrol et al., 2006]: “Phase Noise in GNSS Transmission/Reception System” – E. Rebeyrol, C. Macabiau, L. Ries, J-L. Issler, M-L. Boucheret, M. Bousquet – ION NTM 2006 – January 2006.
[ Ries et al, 2003 ] : “New Investigations on wide band GNSS2 Signals” – L. Ries, L. Lestarquit, JL. Issler, A.R. Pratt, G. Hein, J. Godet, P. Dondl, F. Couturier, P. Erhard, J I R Owen, R. Lucas Rodriguez, J-C Martin – GNSS Conference 2003, Graz – April 2003.
[Soellner and Erhard, 2003]: “Comparison of AWGN code tracking accuracy for Alternative-BOC, Complex-LOC and Complex-BOC modulation options in Galileo E5-Band” – M. Soellner & P. Erhard – GNSS Conference 2003, Graz, April 2003.
Web sites:
- ESA: www.esa.int
- Precise Time and Frequency Inc. : www.ptfinc.com
- RAKON: www.rakon.com - Zarlink: www.zarlink.com