HAL Id: inserm-03016536
https://www.hal.inserm.fr/inserm-03016536
Submitted on 20 Nov 2020
HAL is a multi-disciplinary open access archive for the deposit and dissemination of sci-entific research documents, whether they are pub-lished or not. The documents may come from teaching and research institutions in France or abroad, or from public or private research centers.
L’archive ouverte pluridisciplinaire HAL, est destinée au dépôt et à la diffusion de documents scientifiques de niveau recherche, publiés ou non, émanant des établissements d’enseignement et de recherche français ou étrangers, des laboratoires publics ou privés.
rhabdomyosarcoma with tissue invasive properties
limited by S phase entry inhibition
Gloria Gonzalez Curto, Audrey Der Vartanian, Youcef El-Mokhtar Frarma,
Line Manceau, Lorenzo Baldi, Selene Prisco, Nabila Elarouci, Frédéric
Causeret, Daniil Korenkov, Muriel Rigolet, et al.
To cite this version:
Gloria Gonzalez Curto, Audrey Der Vartanian, Youcef El-Mokhtar Frarma, Line Manceau, Lorenzo Baldi, et al.. The PAX-FOXO1s trigger fast trans-differentiation of chick embryonic neural cells into alveolar rhabdomyosarcoma with tissue invasive properties limited by S phase entry inhibition. PLoS Genetics, Public Library of Science, 2020, 16 (11), pp.e1009164. �10.1371/journal.pgen.1009164�. �inserm-03016536�
Abstract
The chromosome translocations generating PAX3-FOXO1 and PAX7-FOXO1 chimeric proteins paediatric fusion-positive alveolar subtype of Rhabdomyosarcoma (FP-RMS). Despite the ability remodel chromatin landscapes and promote the expression of tumour driver genes, they only in transformation in vivo. The reason for this is unclear. To address this, we developed an in ovo m spinal cord progenitors to PAX-FOXO1s. Our data demonstrate that PAX-FOXO1s, but not wild-trans-differentiation of neural cells into FP-RMS-like cells with myogenic characteristics. In para neural pseudo-stratified epithelium into a cohesive mesenchyme capable of tissue invasion. Su FOXO1s, similar to wild-type PAX3/7, reduce the levels of CDK-CYCLIN activity and increase th Introduction of CYCLIN D1 or MYCN overcomes this PAX-FOXO1-mediated cell cycle inhibition Together, our findings reveal a mechanism that can explain the apparent limited oncogenicity of factors. They are also consistent with certain clinical reports indicative of a neural origin of FP-R
Author summary
The fusion-positive subtype of rhabdomyosarcoma (FP-RMS) is a rare malignant paediatric can still remain to be deciphered. Out of the gross genetic aberrations found in these cancers, t(2:13 translocations are the first to appear and lead to the expression of fusion proteins made of the D or PAX7 and the transactivation domain of FOXO1. Both PAX3-FOXO1 and PAX7-FOXO1 have transcription, yet they only inefficiently promote the transformation of healthy cells into tumorige have used chick embryos to monitor in vivo the early response of cells to PAX-FOXO1 chimeric proteins, but not the normal PAX3 and PAX7, transform neural cells into cells with FP-RMS mol also force polarized epithelial neural cells to adopt a mesenchymal phenotype with tissue invasi FOXO1s inhibit cell division and hence tumour growth. Genetically re-activating core cell cycle r mediated cell cycle inhibition. Together, our findings bring further support to the idea that the PA
Published: November 11, 2020 https://doi.org/10.1371/journal.pgen.1009164
Gloria Gonzalez Curto , Audrey Der Vartanian , Youcef El-Mokhtar Frarma , Line Manceau , Lorenzo Bald Selene Prisco, Nabila Elarouci, Frédéric Causeret, Daniil Korenkov, Muriel Rigolet, Frédéric Aurade, Aurélien De Re Vincent Contremoulins, Frédéric Relaix, Orestis Faklaris, James Briscoe, Pascale Gilardi-Hebenstreit, Vanessa Ribe
oncoproteins, whose oncogenicity is limited by negative effects on cell cycle.
Citation: Gonzalez Curto G, Der Vartanian A, Frarma YE-M, Manceau L, Baldi L, Prisco S, e
trigger fast trans-differentiation of chick embryonic neural cells into alveolar rhabdomyosarco properties limited by S phase entry inhibition. PLoS Genet 16(11): e1009164. https://doi.org/
Editor: Gerard Cornelis Grosveld, Department of Genetics, St. Jude Children's Research Ho
STATES
Received: May 28, 2020; Accepted: October 2, 2020; Published: November 11, 2020 Copyright: © 2020 Gonzalez Curto et al. This is an open access article distributed under the
Attribution License, which permits unrestricted use, distribution, and reproduction in any med and source are credited.
Data Availability: Transcriptomes of ARMS and ERMS biopsies have been published elsew
manuscript; accession numbers GSE92689, E-TABM-1202, E-MEXP-121). These are micror necessary to be able to compare data coming from distinct labs are also provided in S1 Table
Funding: VR, FC, FR are staff scientists from the INSERM, PGH is a research director of the
UPEC. LM has obtained a fellowship from University of Paris. Work in the lab of VR was sup Contre le Cancer grant (PREAC2016.LCC). Work in FR lab was supported by Agence Nation grant Crestnetmetabo (ANR-15-CE13-0012-02) and Fondation pour la Recherche Médicale JB is supported by the Francis Crick Institute, which receives its core funding from Cancer R Research Council and Wellcome Trust (all under FC001051) and the European Research Co had no role in study design, data collection and analysis, decision to publish, or preparation o
Competing interests: The authors have declared that no competing interests exist.
Introduction
Transcriptomic landscape remodelling represents a hallmark of tumourigenesis [1]. This is often of powerful transcriptional modulators, such as master transcription factors (TFs). Understandin lead to a pathogenic transformation of cells represents a key challenge in cancer research, so is more physiological model systems to address this question [1,2].
Two related oncogenic TFs, PAX3-FOXO1 and PAX7-FOXO1, are associated with the emergen paediatric alveolar subtype of rhabdomyosarcoma (RMS), named fusion-positive RMS (FP-RMS patients are mostly found in limb extremities and the trunk. These comprise aggregates of round septa that express, as for other RMS subtypes, undifferentiated embryonic muscle cells marker almost half of FP-RMS patients carry detectable metastases in the lung or bone marrow at the t these metastases, together with cancer resistance and emergence of secondary disease are to RMS patients [4].
The in-frame pathognomonic chromosomal translocations, t(2;13)(q35;q14) or t(1;13) (p36;q14)
PAX7 genes to the 3′ end of the FOXO1 gene and lead to the mis-expression of chimeric TFs m
PAX3 or PAX7 TFs and the transactivation domain of FOXO1 [3]. Exome sequencing revealed t primary genetic lesions in more than 90% of FP-RMS cases [5,6]. Few somatic mutations are fo
whole genome duplication, unbalanced chromosomal copy gain, focal amplifications (12q13-q14 heterozygosity notably on 11p15.5 locus presented by FP-RMS cells [5,6] suggest a tumorigeni chromothripsis [7]. The relative contribution of PAX-FOXO1s and of these gross genetic aberrat healthy cells into FP-RMS cells is still debated.
A large body of work, mainly focused on PAX3-FOXO1 and aimed at identifying and functionally target genes, argues the cell fate change characteristic of FP-RMS is driven by PAX-FOXO1s [8 from PAX-FOXO1’s strong transcriptional transactivation potential, which surpasses that of norm FOXO1 binds to non-coding cis-regulatory genomic modules (CRMs), remodelling chromatin an [11,12]. These CRMs regulate the expression of genes associated with at least 3 traits deleterio [8,9,11,12,14]. First, several of the target genes encode cell surface proteins which are key cell alteration of the some of them was shown to affect RMS cell motility [15–19]. Second, FP-RMS muscle cell master TFs, which in presence of PAX3-FOXO1 can no longer promote muscle term PAX-FOXO1s perturb the core cell cycle machinery [8,9]. Cross-interactions between PAX3-FO
BCL-XL or the senescent factor p16 promote cell survival [22–24]. PAX3-FOXO1 increase myoblasts and this associated with a downregulation of cyclin-dependent kinase inhibitors (CDK fusion protein displays elevated levels in the G2 phase which are required for the upregulation o genes [27].
Despite the apparently powerful activity of PAX-FOXO1s, data from animal models have led to t proteins do not efficiently trigger FP-RMS formation and spreading [24,28–31]. In excess of 60 d FOXO1 expressing human myoblasts or mesenchymal stem cells to produce significant FP-RM contrasts with the 15 days required for patient derived FP-RMS cells [30–32]. Similarly, driving P muscle embryonic cells from the murine Pax3 locus induces tumour mass with a reported frequ these in vivo approaches have revealed several parameters enhancing PAX-FOXO1 proteins o transgenes in zebrafish indicated that neural derived tissues are more prone than mesodermal when exposed to PAX3-FOXO1, highlighting the differential response of distinct cell lineages [2 models both indicate that a threshold level of PAX3-FOXO1 needs to be reached to observe tum complementing PAX-FOXO1s expression with genetic aberrations promoting cell cycle progress increased the frequency of tumour formation [28–34]. This was notably achieved by lowering th retinoblastoma protein, RB1; or conversely by ectopically elevating MYCN expression or RAS a To investigate the molecular mechanisms of oncogenicity in FP-RMS we characterised the initia associated with the transformation of cells expressing PAX3-FOXO1 and PAX7-FOXO1. The gr origin of paediatric cancers [35], the identification of FP-RMS growths in neural tube derived tiss of embryonic neural lineage determinants in FP-RMS cells [9], and the recent use of chick embr and invasion [38,39] led us to develop the embryonic chick neural tube as a model system. We repress the molecular hallmarks of neural tube progenitors within 48 hours and impose a molec FP-RMS cells. Concomitantly, PAX-FOXO1s promote an epithelial-mesenchymal transition, con the adjacent mesoderm in less than 72 hours. Moreover, PAX-FOXO1s limit cell cycle progress activity, which in turn can explain the limited oncogenicity of these fusion TFs.
Results
Chick neural cells lose their neurogenic potential upon PAX3-FOXO1 exposure
To investigate the transformation potential of PAX-FOXO1 proteins, we set out to perform gain o the neural tube of chick embryos. Hamburger and Hamilton (HH) stage 11 chick embryos were expressing PAX3-FOXO1 together with a bi-cistronically encoded nuclear-targeted GFP and allo (Fig 1A). For comparison, electroporations with the wild-type versions of Pax3 or the empty pCI
addition, the non-electroporated side of the neural tube stood as well as an internal control.
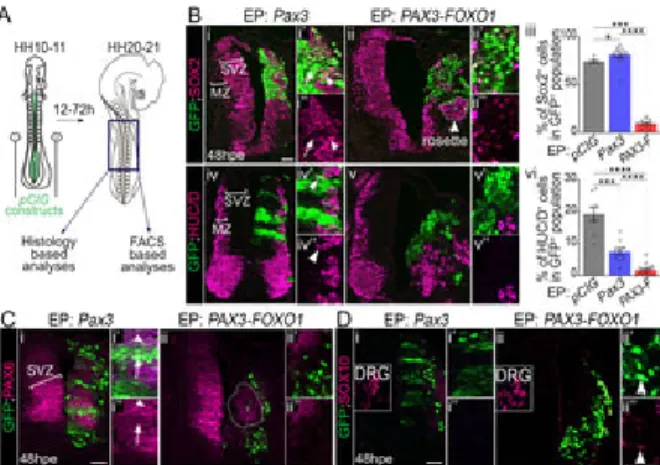
Fig 1. PAX3-FOXO1 switches off generic neurogenic marker expression in chick embryonic spinal cord.
(A) Schematics showing HH10-11 chick embryos filled with pCIG based constructs before be
to thoracic region (dark blue square) of the electroporated embryos were dissected 12 to 72 or FACS based analyses. (B) (i-ii”; iv-v”) Immunodetection of GFP, SOX2 and HUC/D on tra embryos 48hpe with the indicated plasmids. MZ: Mantle Zone; SVZ: Sub-Ventricular Zone. (i HUC/D cells in the GFP population 48hpe with the indicated plasmids (dots: embryo value Whitney U test: *: p<0.05, ***: p<0.001, ****: p<0.0001). (C, D) Immunodetection of GFP, PAX sections of chick embryos 48hpe with the indicated plasmids. DRG: dorsal root ganglia. Arro SOX10 ; GFP cells. x’ and x” panels are blow-ups of a subset of x panel GFP cells. Dash rosettes of GFP cells clustering apart from the SVZ. Arrowheads in Bi’,i” and Ci’,” point at a G PAX6, while those in iv’, iv” point at a HUC/D ; GFP cell. Arrows in Bi’,i” and Ci’,” mark GFP SOX2 or PAX6. hpe: hours post-electroporation; scale bars: 50μm.
https://doi.org/10.1371/journal.pgen.1009164.g001
We characterised the molecular identity of electroporated cells by assaying the expression of ge 1C). At 48 hours post electroporation (hpe), the neural tube of chick embryos contained SOX2 a to the ventricle and HUC/D neurons laterally in the mantle zone (brackets in the non-electropo and 1Ci). PAX3 overexpression did not affect this organisation and cells kept expressing these and 1Ci-i”). This is consistent with PAX3 being present in the spinal progenitors located in the d tube. Yet, in some cells expressing high levels of PAX3, SOX2 and PAX6 expression levels wer 1Ci”). More significantly, spinal cells overexpressing PAX3 produced less HUC/D neurons and state (Fig 1Bi-i”,iii,iv-iv”,vi). This phenotype is reminiscent to that caused by the forced expressio PAX6, suggesting that the extinction of PAX is required in neural progenitors for their terminal d FOXO1 overexpression caused a marked reorganisation on both the ventricular and mantle reg v” and 1Cii-ii’). Strikingly, most PAX3-FOXO1 cells lacked both SOX2 and HUC/D and displaye expression (Fig 1Bii-ii’,iii,v-v”,vi and 1Cii-ii”).
We next checked for the expression of SOX10, a marker of neural crest cells (NCC)[41] (Fig 1D dorsal most part of the neural tube, which they leave to colonize distant embryonic tissues, inclu At 48hpe SOX10 NCC were present in the skin and the DRG (insets in Fig 1Di,ii). The electrop induce SOX10 expression (Fig 1Di-i”) and only rare PAX3-FOXO1 cells were positive for this T rules out the possibility of a switch of neural cells into NCC upon exposure to the fusion TF. Tak
+ + + + + -+ + + + + + +
PAX3-FOXO1 is sufficient to divert cells from a generic neurogenic program.
PAX3-FOXO1 TFs convert chick neural cells into FP-RMS like-cells
We next tested whether PAX3-FOXO1 expressing cells adopted the identity of alveolar rhabdom of genes that define this identity [9], we combined and re-analysed microarray-based tumour tra PAX3-FOXO1 and 34 PAX7-FOXO1 positive FP-RMS patients and 59 patients affected by othe Tables, S1A Fig) [42–46]. We identified 1194 genes enriched in FP-RMS biopsies; 40% of which identified PAX3-FOXO1 bound cis-regulatory modules (CRM) [11,12] (Fig 2B). This list of genes identified PAX3-FOXO1 dependent FP-RMS markers, such as ALK, ARHGAP25, or FGFR4 [9,4 genes indicated that they encode for developmental regulators of many embryonic lineages kno PAX7 activities (Fig 2C, S4 Table) [48], and not exclusively of the muscle lineage. For instance, the caudal part of amniotes, ALK is found in the spinal cord neurons and peripheral nervous sys expressed by the neural tube and somite cells (cf. chicken expression database http://geisha.ar marks amongst others the somites [50]. The complexity of FP-RMS signature is likely to stem fr expression of master TFs which control the development of distinct lineages in the embryo and/ developmental time points. To illustrate this, we focused on nine TFs, namely EYA2, FOXF1, LM
PAX2, PRDM12 and TFAP2β (Fig 2D). In the myogenic lineage, MEOX1 is the first to be induce
specification and the segmentation of the epithelialized somites [51]. LMO4 is transiently induce remains longer in these structures where it contributes to the induction of one of the core myoge
PITX2 has been shown also to contribute to the induction of MYOD1 but in the limb myoblasts [
myoblasts is required at foetal stages [56]. Only briefly expressed in the somites, FOXF1 marks including the splanchnic mesoderm or the sclerotome [57]. The other TFs, PAX2 [58], PRDM12 neurons of the peripheral and/or central nervous system, so are EYA2 [61], LMO4 [62] and PITX cells are not simply undifferentiated muscle cells, but rather as cells with their own transcriptiona this combination of TFs in FP-RMS, we quantified their expression levels using either RT-qPCR established human RMS cell lines, including 3 FN-RMS (RD, RDAbl, Rh36) and 4 PAX3-FOXO SJRh30, Rh4, Rh5) (Fig 2D, S1B Fig, S1 Methods, S1–S4 Raw images). All markers assessed with transcript and protein expression levels varying from one cell line to another (Fig 2D, S1B F
PRDM12 and TFAP2β displayed significant elevated levels in FP-RMS cells compared to FN-R
MYOD1 protein levels did not discriminate FN-RMS and FP-RMS cell lines (S1Biii Fig). FOXF1 cells (Fig 2Diii,v). LMO4 and PITX2 transcripts were detected in all RMS subtypes (Fig 2Dv). Ins higher in FP-RMS Rh5, SJRh30 and Rh4, cell lines than in the other cell lines (S1Biii Fig), repre biomarker and supporting post-translation regulation. Altogether these results further highlight in combination of TFs expressed by FP-RMS [64], which could in turn underpin the transcriptomic they confirmed that the nine TFs chosen can be used to define a FP-RMS identity and to discrim embryonic lineage, notably the myogenic one.
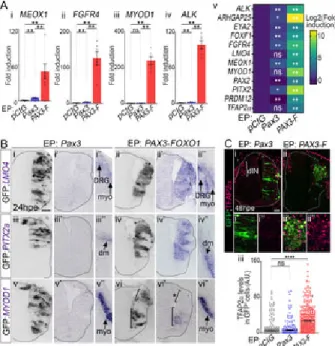
Fig 2. FP-RMS gene signature is composed of TFs marking in the embryo distinct lineages.
(A) Heatmap of hierarchically clustered differentially expressed genes between PAX3-FOXO
RMS (red and burgundy rectangles, respectively) and FN-RMS biopsies (blue rectangles). Fo colour-coded in blue (lower levels) to yellow (higher levels) (See also Method section and S1 in FP-RMS versus FN-RMS are squared in red and named FP-RMS signature genes. (B) Pe nearby at least one known PAX3-FOXO1 bound CRM [12] out of those present in our comple genes), non-differentially regulated between FP-RMS and other RMS (non DEG), the differen FP-RMS and other RMS (DEG), downregulated in FP-RMS compared to other RMS (DOWN RMS compared to other RMS (UP in FP-RMS). (C) Gene ontology enrichment for biological specification applied to genes enriched in FP-RMS biopsies. (D) mRNA expression levels of a PAX3-FOXO1 binding event and expressed in various PAX3/7 dependent embryonic tissue indicated FN-RMS and FP-RMS cell lines. Levels are relative to TBP transcripts and normali lines. i-iv: dots: biological replicates; bar plots: mean ± s.e.m.; n = 3 replicates. v: heatmap d line. Normalised relative expression across samples are colour-coded in blue (lower levels) t way-ANOVA p-values evaluating the similarities between FP-RMS and FN-RMS cells lines: * p<0.001, ****: p<0.0001, ns: p>0.05.
https://doi.org/10.1371/journal.pgen.1009164.g002
We next assessed the expression of these nine TFs and that of the FP-RMS hallmark genes, A
GFP, Pax3 or PAX3-FOXO1 electroporated chick neural cells (Fig 3A). For this, the neural tube
dissociated and FACS purified (Fig 1A). RNA from 60 to 80k GFP positive cells was extracted a cDNAs. The expression of all genes was significantly increased by PAX3-FOXO1 and barely alt hybridization for PITX2, LMO4 and MYOD1 performed 24 hours earlier confirmed the ectopic in FOXO1 and the absence of these genes in the neural tube submitted to PAX3 ectopic expressio
PITX2 and LMO4 induction was observed in all the electroporated cells (Fig 3Bii-ii’, iv-iv’). Inste
fusion factor was seen in only half of the electroporated cells (Fig 3Bvi,vi’). In addition, quantific levels after fluorescent immunolabelling of 48hpe embryos showed that PAX3-FOXO1 promotes S2Aii-iii Fig). Conversely, forced expression of PAX3 had no effect on TFAP2α neurons, but inh+
molecular signature reminiscent of human FP-RMS cells in neural cells, a non-muscle lineage. MYOD1 was induced by PAX3-FOXO1, another member of the core myogenic transcriptional n used as a RMS marker [64], was not induced by the fusion TF, nor by PAX3 (S2B Fig).
Fig 3. PAX3-FOXO1 converts embryonic neural progenitors into cells harbouring FP-RMS molecular traits.
(A) mRNA expression levels of FP-RMS hallmark genes in GFP FACS sorted neural tube c
plasmids. Levels are relative to TBP transcripts and normalised to pCIG samples mean level bar plots: mean ± s.e.m; n> 4 FACS sorts; v: heatmap exhibits mean value over 4 discrete FA samples are colour-coded in blue (lower levels) to yellow (higher levels). (B) In situ hybridiza
MYOD1 detection and immuno-detection of GFP on transverse sections of chick embryos 24 FOXO1. x and x’ panels represent the same neural tube but in adjacent histological slides. x”
region of the x’ sample. dm: dermo-myotome; DRG: dorsal root ganglia, myo: myotome. Upp negative for MYOD1 (*), the lower one cells positive for this TF. PITX2a, LMO4: n>9 embryos
ii”) Immunodetection of GFP and TFAP2α on transverse sections of chick embryos 48hpe w
Quantification of expression levels of TFAP2α in GFP cells in the spinal cords of chick embr plasmids (dots: cell values; bars: mean ± s.e.m; n>5 embryos). Mann-Whitney U test p-value between either pCIG and Pax3 samples or pCIG and PAX3-FOXO1 samples: *: p<0.05, **: p p<0.0001, ns: p>0.05; Scale bars: 50μm.
https://doi.org/10.1371/journal.pgen.1009164.g003
PAX3-FOXO1 activates conserved FP-RMS associated enhancers in chick neural cells
The robustness of PAX3-FOXO1 mediated FP-RMS hallmark gene induction in neural cells cou conserved enhancers known to operate in FP-RMS cells [11,12]. To test this idea, we cloned en mouse Met, Meox1, Myod1, Alk, or human CDH3 and PRDM12 genes (S1 Methods). We clone promoter and a reporter gene and co-electroporated them with either pCIG, Pax3, or PAX3-FOX electroporated with the control vector the activity of these enhancers was barely detectable (Fig CRM near the PRDM12 locus that had an endogenous activity in the intermediate-dorsal neura presence of PAX3-FOXO1 all cloned enhancers, except the CDH3 CRM, were transcriptionally
+
high expression of the reporter gene (Fig 4iii,iii’,vi,vi’,vii, S2Ciii,iii’,iv and S2D Fig). The magnitud induction varied between enhancers and from cell to cell. In contrast, PAX3 transcriptional poten (Fig 4ii,ii’,v,v’,vii, S2Cii,ii’,iv Fig). It promoted Meox1 CRM activity to levels found in PAX3-FOXO
Myod1 and PRDM12 CRM activity by PAX3 was milder than by PAX3-FOXO1. Finally, PAX3 did
activity. Altogether these results support a model whereby the transformation of neural progenito be mediated by PAX3-FOXO1 co-option of conserved enhancer elements.
Fig 4. Activation of FP-RMS associated enhancers in chick neural cells by PAX3-FOXO1.
(i-vi’) Immunostaining for GFP and βGalactosidase (βGal) on transverse sections of chick em
PAX3-FOXO1 and the indicated reporters for the mouse versions of cis-regulatory modules (
FP-RMS cells [12]. (vii) Quantification of βGal levels normalised to that of GFP in cells electr enhancer reporter constructs at 36hpe (dots: cell values; bars: mean ± s.e.m.; n>4 embryos) ****: p< 0.0001, ns: p> 0.05. Scale bars: 50μm.
https://doi.org/10.1371/journal.pgen.1009164.g004
PAX3-FOXO1 promotes epithelial-mesenchymal transition, cell migration and tissue invasion
Paralleling PAX3-FOXO1 mediated cell fate changes, drastic rearrangement of the pseudo-stra (compare Fig 5Aiii,iii’ to Fig 5Ai,i'). PAX3-FOXO1 cells adopted a rounded shape, were uneven grouped together (Fig 5Aiii,iii’). Some cells had delaminated either inside the neural tube canal tissue (brackets in Fig 5Aiii,iii’). In addition, neighbouring unelectroporated cells clustered togeth ectopically positioned within the “mantle zone”, supporting a sorting of PAX-FOXO1 cells from with dash-lines in Figs 1Bii, 1Cii and 5Aiii). In contrast, cells electroporated with pCIG or Pax3 w confined to the neural tube (Fig 5Aii-ii’). In addition, PAX3 overexpression resulted in a thinner n samples (compare Fig 5Ai-ii’ to Fig 5Ai,i').
+
Fig 5. PAX3-FOXO1 transforms neural epithelial cells into a cohesive mesenchyme capable of migration.
(A) (i-iii’) Immunodetection of GFP and DAPI staining on transverse section of chick embryo
plasmids. Brackets in Aiii highlight cells delaminating inside the neural tube (in) or outside of Apical confocal views in open-booked preparation of spinal cords of embryos 48hpe with the immunolabelled with antibodies against GFP and PARD3. Variations in the phenotype are ob FOXO1: (iii) represents 2 of 8 cases analysed, (iv) the rest of cases. (v-vi’) Immunodetection transverse sections of chick embryos 48hpe with the indicated plasmids. (C) (i-iii’) Z-projecti embryos immuno-labelled for GFP and stained with DRAQ5. Dotted lines delineate either the neural tube/mesoderm border. (iv) Quantification of the distance of each GFP nuclei from th the indicated plasmids (Violin plots) P: progenitors and N: neurons. (D) (i) Exponential fit of th function of cluster size at 48hpe in discrete sample types. (ii-iii’) Immunodetection of GFP an sections of chick embryos 48hpe with the indicated plasmids. (E) Gene ontology enrichment linked cell migration and adhesion applied to genes enriched in FP-RMS biopsies. EMT: epith MET: mesenchymal to epithelial transition. (F) (i-ii) Levels of mRNA expression of the indicat assayed by RT-qPCR on GFP FACS sorted neural tube cells 48hpe with pCIG, Pax3 and PA to TBP transcripts and normalised to pCIG samples mean level (dots: value for a single RNA Whitney U test p-value: *: p<0.05, **: p<0.01, ns: p>0.05). x’ and x” panels are blow-ups of a basal lamina. Scale bars: 50μm, but in D: 10μm.
https://doi.org/10.1371/journal.pgen.1009164.g005
To validate these observations, we quantified several parameters in whole embryos stained with and documented the distribution of several key markers of the epithelial state (S3A Fig, S6 Tabl migration are tightly connected to cell shape (e.g. [65]). Hence, we started by evaluating that of ellipticity of their nuclei segmented from 3D images (S3B Fig). This parameter reflects the degre fluctuated between 0.4 and 0.42 for pCIG and Pax3 elongated nuclei (S3Bi,ii,iv Fig). The elliptic substantially smaller; with time this difference was accentuated (S3Biii,iv Fig). PAX3-FOXO1 ce adapted to tissue exploration [65].
We then monitored the orientation of the major axis of the ellipsoid fit of GFP cells using polar of cell arrangement within the tissue (S3C Fig). The polar angle θ gave the deviation of the nucl ventral axis, while the azimuthal angle φ informed on its orientation within the lateral-medial and (S3Ci Fig). In 48hpe controls and Pax3 samples, the distribution of θ and φ was similar (S3Cii,ii 0°C, consistent with nuclei paralleling the medial-lateral axis of the embryos and apico-basal att
+
+
PAX3-FOXO1 samples θ and φ values displayed a wide distribution (S3Cii,iii Fig), ranging for in
90°. Hence, PAX3-FOXO1 is able to randomize the nuclei orientation within the spinal tissue. Alterations in the shape and orientation of the nuclei by PAX3-FOXO1 led us to assess the apic S4A Fig) [66]. We monitored the distribution of the apical determinant PARD3. In open book pre cord, PARD3 labelling revealed a honeycomb-like network at the apical surface (Fig 5Bi). This n for PAX3 although cells harboured less cell-cell contacts (Fig 5Bii). In contrast, PAX3-FOXO1 co (Fig 5Biii,iv). The loss of apical polarity upon PAX3-FOXO1 forced expression was confirmed by activated form of βCATENIN (S4Ai-ii” Fig). We next looked at the distribution of the focal adhesi accumulates within the basal regions of control cells (arrowheads in S4Aiii-iv’ Fig). Upon PAX3 levels of this protein increased (arrows in S4Aiii’ Fig), yet higher levels of β1 INTEGRIN were de (arrowheads in S4Aiii’ Fig). In contrast, the expression of this protein was homogenous through Fig). Hence, upon PAX-FOXO1 expression, neural progenitors lose the polarized distribution of that become distributed evenly throughout their cell membrane.
Because cell polarity is influenced by the extra cellular matrix (ECM) [66], we investigate the dis This key scaffold component of the basal lamina separates the neural tube from the adjacent m samples at 48hpe (Fig 5Bv,v’). In the presence of PAX3-FOXO1, the basal lamina broke down ( provides, thus, cells with the ability to dismantle tissue barriers. We next tested whether PAX3-F migration, by measuring the distances between the centre of electroporated nuclei and the apic dimensions of 72hpe embryos (Fig 5C). In pCIG samples, the arrangement of progenitors and n to distinguish these two types of cells. This could not be done in Pax3 samples, probably becau and in PAX3-FOXO1 due to the global transformation of cells (Fig 1B). While, nuclei overexpres tube (compare Fig 5Cii,ii’ to Fig 5Ci,i' and Fig 5Civ), a fraction of PAX3-FOXO1 cells (more tha neural tube and were present within the adjacent tissues (Fig 5Ciii-iii’, iv).
To investigate whether cells clustered together, we first measured the distance between nearest number of cells belonging to the same cluster (Fig 5Di, see Methods). In control embryos, elect more clustered together than neurons, which is in agreement with the delamination and various subpopulations (Fig 5Di). PAX3 electroporated cells behave similarly to control neural progenito progenitor like state adopted by PAX3 electroporated spinal cells (Fig 1B). By contrast, in PAX3 tubes, we identified more cells close to each other and bigger groups of cells than in control (Fig favours the clustering of cells. In agreement with this, PAX3-FOXO1 cells expressed high leve was homogenously distributed throughout the cells (Fig 5Diii,iii’), while the gain of PAX3 barely of CDH2 (Fig 5Dii,ii’).
Taken together, these data indicate that PAX3-FOXO1 not only triggers acquisition of FP-RMS i cells with the ability to invade tissues. These phenotypes are likely to be directly regulated by th great number of PAX-FOXO1 targets in FP-RMS cells encoding for tissues remodellers and cel Fig). We notably confirmed that the master epithelial-mesenchymal transition driver SNAI1 and genes displayed elevated levels in presence of PAX3-FOXO1 compared to control and PAX3 c
PAX3-FOXO1 holds cells in G1 by decreasing CDK-CYCLIN activity
We next assessed the impact of PAX3-FOXO1 on other hallmarks of cancer cells, notably those [14](Fig 6, S5 and S6 Figs).
+
+
Fig 6. Pax3 and PAX3-FOXO1 limit the entry of cells into S phase.
(A) (i-ii’) Immunodetection of GFP, phospho-histone H3 (PH3) and DAPI staining on transver
48hpe with the indicated plasmids. (iii) Quantification of the number of PH3 cells in the GFP expressing the indicated plasmids (dots: embryo values; bar plots: mean ± s.e.m.). (B) (i-ii’) and DAPI staining on transverse sections of chick embryos 48hpe with the indicated plasmid before harvest. (iii) Quantification of the number of EdU cells in the GFP population in emb plasmids (dots: embryo values; bar plots: mean ± s.e.m.). (C)(i) FACS plots showing DNA co neural cells stained with vybrant dyecycle violet stain and cell cycle phases gating (green: G0 pink: G2/M phase). (ii-iv) Percentage of cells in the indicated cell cycle phase at 48hpe estab experiments, for individual values see S6Bi-iii Fig and for raw plots see S6A Fig). (D) (i-ii’) Im phosphorylated form of RB1 (pRB1) and DAPI staining on transverse sections of chick embry plasmids. (iii) Quantification of pRB1 levels in the GFP cells in embryos expressing the indi in arbitrary unit (AU), bars: mean ± s.e.m., n> 8 embryos). (E) (i-ii’) Immunodetection of GFP sections of chick embryos 48hpe with the indicated plasmids. P: progenitors; N: neurons. (iii) in GFP cells in embryos expressing the indicated plasmids. P: progenitors; N: neurons. (dot s.e.m., n>4 embryos). x’ and x” panels are blow-ups of a subset of x panel GFP cells. Mann 0.05, **: p< 0.01, ***: p< 0.001, ****: p< 0.0001, ns: p>0.05. Scale bars: 50μm.
https://doi.org/10.1371/journal.pgen.1009164.g006
To assess the proliferative state of cells, we marked mitotic cells using an antibody against the p (PH3) (Fig 6A). This indicated PAX3-FOXO1 cells displayed a lower rate of mitosis than contro a reduction in the number of PH3 cells was seen also in PAX3 cells, albeit to a lesser extent ( that either PAX3-FOXO1 cells were blocked in a cell cycle phase or had a longer cell cycle(s). protein specifically induced cell death by marking activated CASPASE3 apoptotic cells (S5A F PAX3-FOXO1, a too low proportion of cells (about 2%) were undergoing cell death at 48hpe to a decrease. We next traced cells undergoing DNA synthesis by treating embryos with EdU for 20 all control cells were positive for EdU, while only half of PAX3-FOXO1 cells (Fig 6Bii-ii”, iii) and the thymidine analogue (Fig 6Bi-i',iii). Confirming this compromised entry into replication, the ex maintenance 2 (MCM2), a protein of the pre-replicative complex was significantly downregulate S5Biii-iii” Fig to S5Bi-i” Fig, S5Biv Fig). The levels of this protein were barely affected by the gai Fig). FACS analyses after labelling cells with a permeable DNA dye (vybrant dyecycle violet sta in presence of PAX3 and PAX3-FOXO1 a larger proportion of cells were in the G1 phase (comp to Fig 6Cii, S6Bi-iii Fig). Taken together, these results support the idea that the gain for PAX3 or
+ + + + + + + + + + + +
phase. Similar experiments performed in human fibroblasts indicated that this cell type was also FOXO1 (S6Biv-vi Fig), supporting the idea that PAX3-FOXO1 mediated cell cycle hold is not inh Finally, the phosphorylation of the retinoblastoma-associated RB1 protein being one of the hallm leading to the entry in S phase, we assayed its status (Fig 6D). Both PAX3 and PAX3-FOXO1 d fusion protein to a greater extent than wild-type PAX3 (Fig 6D). Yet, it is worth noting that phosp cells overexpressing the PAX variants and were higher than cells that have left the cell cycle, su Hence, cells are probably not fully arrested. The decrease in phospho-RB1 levels is not linked t
RB1, CDK2, CDK6 and CCND1 (S5C Fig). Instead, we identified that amongst the CIP/KIP CDK
upregulated by the fusion protein (Fig 6E), a cue potentially explaining the PAX3-FOXO1 media activity.
PAX3-FOXO1 mediated cell cycle inhibition is overcome by CCND1 or MYCN
We then wanted to test whether PAX3-FOXO1-transformed cells could re-enter cell cycle. For th CDK-CYCLIN activity in PAX3-FOXO1 expressing cells, by forced expression of CYCLIN D1, C cyclin subtype, PAX3 and PAX3-FOXO1 positive cells displayed a mitotic rate, revealed by quan
pCIG control embryos at 48hpe (compare Fig 7Ai-ii” to Fig 6Ai-ii”, Fig 7Aiii). Accordingly, the ga
FOXO1 cells to incorporate EdU as do controlled cells (compare Fig 7Bi-i” to Fig 6Bii-ii”, Fig 7B
Fig 7. CYCLIN D1 and MYCN rescue PAX-FOXO1 cell cycle inhibition, without affecting the identity and mig
(A) (i-ii”) Immunodetection of GFP, the phosphorylated form of histone H3 (PH3) and DAPI s
chick embryo at 48hpe with the indicated plasmids. (iii) Quantification of the number of PH3 embryos expressing the indicated plasmids at 48hpe. (dots: embryo values; bar plots: mean
PAX3-FOXO1 samples are the same as in Fig 6Aiii. (B) (i-i”) Immunodetection of GFP, EdU
section of chick embryos 48hpe with the indicated plasmids and soaked with EDU 20h before the number of EdU cells in the GFP population in embryos expressing the indicated plasm mean ± s.e.m.). (C) (i-i’) Z projection along the dorso-ventral axis of 3D scans of an embryos
CCND1. Dotted lines mark the apical cavity and the basal membrane (bm). (ii) Quantification
nuclei and the apical surface at 72hpe with the indicated plasmids (Violin plots). (D) PITX2 de on transverse sections of chick embryos 24hpe and 48hpe with the indicated plasmids and im adjacent section slide. Bottom panels show areas on the embryos and section presented in t expressed, including the lateral plate mesoderm (lpm) and the dorsal medial lip of the dermo are blow-ups of a subset of x panel GFP cells. Mann-Whitney U test p-value: **: p< 0.01, *** bars 50μm. https://doi.org/10.1371/journal.pgen.1009164.g007 + + + + +
We next wondered whether the proto-oncogenes recurrently amplified in FP-RMS cells could al FOXO1 expressing cells. MYCN been amplified in about 10% of FP-RMS [6], we forced its expr In the control neural tube, as previously demonstrated [68], MYCN, as opposed to its usual func progenitors in M phase (Fig 7Aiii). In contrast, in presence of PAX3-FOXO1 and MYCN cells b (Figs 7Aiii and S5D), with their rate of mitosis reaching levels comparable to that of control pCIG Finally, we checked that upon reactivation of the proliferative activity of PAX3-FOXO1, the spec neural progenitors were maintained. Assaying the migration of cells supported this idea (Fig 7C marker gene PITX2 (Fig 7D).
Together, these results indicated that PAX3-FOXO1 proteins inhibit the entry of cells into S phas decrease in CDK-CYCLIN activity. This inhibition can be overcome by increasing the levels of C
PAX7-FOXO1 transformation of spinal progenitors is reminiscent to that by PAX3-FOXO1
Finally, we assessed whether the transformation properties of PAX3-FOXO1 were shared by PA effects of PAX7-FOXO1 on spinal progenitors diverge from that of PAX7 (Fig 8, S7 Fig). To do s we assayed cells 48hpe with PAX7-FOXO1 or Pax7 using the pan-neuronal markers SOX2 and genes LMO4, PITX2a, TFAP2α, and Pax2 (Fig 8A, S7A and S7B Fig). Forced expression of PA maintenance of a SOX2 state (S7Ai,i',iii Fig), reduced the formation of HUC/D neurons (Fig 8A expression of the selected FP-RMS signature genes (Fig 8Aiv-iv”,vi, S7Bi,i',iii,iii’,v-v” Fig). By co RMS markers at the expense of the pan-neuronal markers (Fig 8Aii-iii,v-vi, S7Aii-iii and S7Bii-ii’ with PAX3-FOXO1. The levels of TFAP2α in PAX7-FOXO1 cells reached levels similar to those (compare Fig 8Avi to Fig 3Ciii), while PAX7-FOXO1 poorly induced PITX2 and LMO4 compared S7Bii,ii’,iv,iv’ to Fig 3Bii,ii’,iv,iv’). This may stem from the differential transcriptional potential betw
+
+ +
Fig 8. Major traits of PAX7-FOXO1 cellular transformation.
(A) (i-ii”, iv-v’) Immunodetection of GFP, HUC/D and TFAP2α on transverse section of chick
indicated plasmids. (iii, vi) Quantification of the number of HUC/D and TFAP2α cells in the expressing the indicated plasmids at 48hpe. (dots: embryo values; mean ± s.e.m.). Data for t as presented in Figs 1Bvi and 3Ciii). (B) (i-iv”) Immunodetection of GFP, activated bCATENI adherens junctions) and LAMININ on blows-off on GFP cells of transverse sections of chick indicated plasmids. (v) Quantification of the distance of GFP nuclei to the apical surface of t with the indicated plasmids measured on transverse sections (dots: values in individual cells embryos). (C) (i) Quantification of the number of PH3 cells in the GFP cells in embryos exp 24hpe. (dots: embryo values; mean ± s.e.m.. (ii,iii) Quantification of pRB1 (ii) and CDKN1c ( embryos expressing the indicated plasmids (dots: cell values in arbitrary unit (AU), bars: mea for the pCIG samples in C are the same as presented in S5D Fig, Fig 6Diii and Fig 6Eiii. x’ a subset of x panel GFP cells. Mann-Whitney U test p-value: **: p< 0.01, ****: p< 0.0001, ns: https://doi.org/10.1371/journal.pgen.1009164.g008
Second, we investigated the tissue remodelling properties of PAX7-FOXO1 and PAX7 (Fig 8B). neuro-epithelium structure (Fig 8i,iv), PAX7-FOXO1 triggered marked tissue remodelling (Fig 8A
+ +
+ +
+ +
and a breakdown of the basal lamina (Fig 8Biv-iv’). The gain for PAX7 did not alter the distributi Furthermore, PAX7-FOXO1 cells gained the ability to colonize adjacent tissues, while the force the position of electroporated cells within the embryo (Fig 8Bv).
Finally, quantifying the number of PH3 cells and the levels of phospho-RB1 in chick embryos e FOXO1 were consistent with these PAX variants reducing the ability of progenitors to proliferate activity (Fig 8Ci,ii, S7C Fig); with the effects of PAX7-FOXO1 much stronger than that of PAX7. FOXO1 cells was correlated with elevated levels of CDKN1c (Fig 8Ciii, S7Dii-ii” Fig). This was 8Ciii, S7Di-i” Fig). We next checked whether the proliferative behaviour of PAX7-FOXO1 cells expressing CCND1 or MYCN (Fig 8Ci). At 24hpe in presence of either cell cycle regulator PAX7 rate as great as that of pCIG samples (Fig 8Ci).
Altogether these data demonstrate that the gross phenotypic traits provided by PAX3-FOXO1 a reminiscent, despite some differences in the molecular response of cells to the two factors. Ass underpinning these differences and how they impact the long term phenotype of cells could prov in the outcome between patients carrying either the t(2;13)(q35;q14) or t(1;13) (p36;q14) translo
Discussion
New markers of FP-RMS and their regulation by the PAX-FOXO1s
As for many cancers, the transcriptional state of FP-RMS varies considerably between patients variations in the profile of expression of the embryonic muscle markers, MYOD1 and MYOG [64 transcriptome of 192 RMS patients we have been able to revaluate the list of genes marking the distinctive feature of the FP-RMS molecular signature is its association with genes not only regu embryonic muscle cells, but also of other embryonic cell lineages, having in common a PAX3/7 Accordingly, the chromatin landscape of FP-RMS only partially matches that of myoblasts and m PAX3-FOXO1 bound CRMs in the vicinity of 40% of these FP-RMS associated genes and of PA these CMRs represents a means by which PAX3/7 dependent developmental gene networks ar expressing cells [11,12,70]. In addition, the presence of TFs known to also strongly influence the embryonic lineages [51,53–57,59,62,63,71] might also contribute to the FP-RMS dysfunctional t Variations in the FP-RMS signature genes is likely to stem from the specific genetic aberrations genetic aberrations, and the cell of origin [5,6]. Our data demonstrate that the PAX-FOXO1s are tissue some of FP-RMS associated TFs, while their expression is normally silenced (Figs 3 and stemming from a pioneer transcriptional activity [73], demonstrated for PAX3-FOXO1 in human recruitment of the fusion TF operates largely on closed and transcriptional shut down CRM. PAX CRM nucleosomes and to set up an epigenetic landscape associated with active transcription. I were able to activate de novo CRMs in the embryonic neural tube (Fig 4, S2C Fig).
In comparison to the PAX-FOXO1s, the wild-type PAX3 or PAX7 are way more sensitive to the c while MYOD1 can be induced in embryonic stem cells derived myoblasts by PAX3 [74], we were transcripts after a gain for PAX3 expression in the neural tube (Fig 2A and 2B). Tissue specific c PAX3/7 TFs haven’t yet been revealed. Yet, genetic studies suggest a model where cell fate spe dependent transcriptional activation in the myogenic lineage (e.g. [75–77]) and in great means o repression in the neural tube (e.g. [78–80]). As such PAX3 recruitment to the genome of myobla chromatin marks [75] and PAX3 loss of function phenotypes in these cells can be largely rescue FOXO1 [76]. Conversely, in the neural tube it would act at least partially as a transcriptional rep rescue Pax3 loss of function phenotypes [80]. Even more it can interfere with the normal functio fate changes ([29,80,81] and our study). In agreement, PAX3 poorly induced the activity of FP-R
+
+
+
embryos (Fig 4, S2B Fig). Interestingly, it has been observed that the fusion with FOXO1 inhibit therefore the PAX3-FOXO1 proteins harbour a higher transcriptional potential, which certainly re specific co-factors.
The tissue specific activity of PAX3 can be bypassed, as demonstrated by the induction of MYO PAX3 is provided by RCAS based viral infection for 5 days[83]. This mode of transgenesis expo prolonged expression of the transgenes, as opposed to the electroporated and episomally trans progressively diluted by cell division. This is in line with the idea that the levels of PAX TFs are a response of cells. Exemplifying this, spinal progenitors harbouring different levels of PAX activity neuronal subtypes [84] and the loss of one single PAX3 allele leads to Waardenburg syndrome, [85].
The use of various promoters to drive the expression of PAX3-FOXO1 in zebrafish or the compa expressed from one or two Pax3 alleles support the idea that PAX-FOXO1 levels are also instru transformation of healthy cells to FP-RMS like cells [28,29,32]. This may explain the discrepanc have observed in the chick neural tube and that reported in the neural tube of mice where PAX3 the endogenous Pax3 locus or using Pax3 promoter region [81,84,86]. In these mouse models, specification of neuronal identities, the neural epithelium folding alterations and in some cases e been reported. In contrast, the presence of both myoblast and non myoblasts associated TFs w expressing PAX3-FOXO1 and PAX7-FOXO1 support a routing of cells a FP-RMS like state. Most importantly, our study, taken together with the study by Kendall et al. [29], supports the co cellular subtype from which FP-RMS can originate. Accordingly, 20–40% of primary tumour mas by NCC, such as the orbit, bladder, para-meningeal, head and neck areas ([41,46,87], S1A Fig) report the presence of FP-RMS primary growths in a giant naevus and spinal cord, that are una [36,37]. This idea is further supported by the observation that the regulatory regions in the vicini impacted by the t(2;13)(q35;q14) translocations remain active in the neural tube after the translo origin on the manifestation of the disease and how much it can contribute the FP-RMS heteroge it is tempting to speculate that it will modulate tumour formation incidence, location and histolog
PAX-FOXO1s mediated cell cycle inhibition limits the expansion of transformed and metastatic cells
In the light of the cellular phenotypes appearing upon exposure to PAX-FOXO1, we propose tha oncogenic drivers, whose activity is likely underpinning the timeline of tumour formation. On the provide cells with tissue remodelling and invasion capacities. This is reminiscent of the transform TFs, named EMT-TFs [89]. Explaining this, PAX-FOXO1 dependent FP-RMS signature is signif tissue remodelling. It includes notably modulators of RhoGTPases activity, such as ARHGAP25 known to regulate cell-cell and cell-ECM interactions, polarity and migration [90], which are all m exposure (Fig 4). In addition, PAX-FOXO1 tissue remodelling activity could be reinforced by the TFs, such as SNAI1, PRXX1, ETS1/2 [89] (S1–S3 Tables, Fig 4).
On the other hand, our analyses revealed that the oncogenicity of PAX-FOXO1 transformed cel proliferation (Fig 5). Such negative effect of PAX-FOXO1s on cell cycle progression is unlikely to Human myoblasts expressing PAX3-FOXO1 are not to be able to produce colonies within soft a culture for PAX3-FOXO1 NIH3T3 cells to generate such colonies [91], and PAX-FOXO1s hum spend more time in G1 phase, as do chick neural cells (S3E Fig). These results provide insight FOXO1s with genetic aberrations promoting cell cycle progression, such as the gain of MYCN o CDKN2A, can enhance their tumorigenic potential (Fig 3, Fig 6) [28,30,34]. Whether such comp evolution and if so how it is achieved is not known for most cases. Alterations including mutation
chromosome translocation is only seen in 30% of biopsies [5,6]. This calls for a better understan underpinning this cell cycle inhibition. The buffered cell cycle progression induced by PAX-FOXO could underlie the refractory response of FP-RMS cells to drugs such as CDK2 inhibitors [34] an resurgence of tumours post-treatment [92], as shown for other cancers [2]. We propose that RB PAX-FOXO1 mediated establishment of a dormant state. The decrease in the levels of the phos FOXO1 gain of function points at a decrease in the level of CDK2 activity and explains the arres This is further supported by the elevated levels of CDKN1c (p57 , a protein that binds to and was originally shown to cause cell cycle arrest mostly in G1 phase. This hypothesis is also com a complementation with CCND1 (Cyclin D1), an efficient driver to S phase [95]. Strongly suppor a nodal point in PAX-FOXO1 mediated cell cycle regulation, its loss of function have been show the formation of tumours from p53 null cells of the Myf6 embryonic muscle lineage overexpress Finally, amongst the approaches taken to study FP-RMS development and evolution [28–30,32 recapitulates the invasive and disseminative properties of PAX-FOXO1 expressing cells [92]. As human grafted cells [38], we believe that it will particularly suited for studying the modes of diss transformed cells. Our model will also provide a means to investigate the molecular networks ac PAX-FOXO1 mediated-latent metastatic state to overt metastasis [97]; and thereby to provide v therapeutics development.
Methods
Bioinformatics
Transcriptomes of FP-RMS and ERMS biopsies have been published elsewhere [42–46] (acces E-TABM-1202, E-MEXP-121 and data in [45]). Each dataset was based on Affymetrix micro-arr Tables (Sheet 2). Raw probe set signal intensities were normalized independently, using the fro Bioconductor R package [98]. Individual expression matrices were merged and the residual tech using the ComBat method implemented in the SVA R package [99]. Samples corresponding to t presence/absence of PAX3-FOXO1 or PAX7-FOXO1 fusion genes were subset from the origina script. Differential analysis of fusion positive versus negative samples was conducted using the parameters: resp.type = "Two class unpaired", nperms = 100, random.seed = 37, testStatistic = delta score lower than 2.3 (FDR 0) where selected for subsequent analysis.
Hierarchical clustering of the normalized transcriptomes was implemented using the heatmap.2 [101]). PAX3-FOXO1 chIPseq data (GSE19063, Cao 2010) were mapped to human genome (h were called using MACS2 [103] implemented on Galaxy server [104]. Peaks common to the 2 r present in the RD cell line samples were selected using BEDtools [105] and annotated to the tw [106]. Functional annotation of the differentially expressed genes and the PAX3-FOXO1 putative analysis tool of the PANTHER Classification System [107] or GSEA [108].
Chick in ovo electroporation
Electroporation constructs based on pCIG (pCAGGS-IRES-NLS-GFP) expression vector [109] h
Pax3, Pax7, PAX3-FOXO1, PAX7-FOXO1 [80]; MYCN [68]; CCND1 [110]. Reporters for the hum
FOXO1 bound enhancers were cloned upstream of the thymidine kinase (tk) promoter and nucl
late promoter (mlp) and H2B-Turquoise. For detailed cloning strategies see supporting methods pCIG based constructs (1.5–2 μg/μl) were electroporated in Hamburger and Hamilton (HH) stag
to described protocols [112]. Embryos were dissected at the indicated stage in cold PBS 1X.
Immunohistochemistry and in situ hybridisation on cryosections
Embryos were fixed with 4% paraformaldehyde (PFA) for 45 min to 2 hr at 4°C, cryoprotected b embedded in gelatin, cryosectioned (14 μm), and processed for immunostaining [112] or in situ the reagents are provided in the S1 Methods. Immunofluorescence microscopy was carried out microscope. Pictures of in situ hybridisation experiments were then taken with an Axio Observe images were processed with Image J v.1.43g image analysis software (NIH) and Photoshop 7.0 Jose, CA, USA). All quantifications were performed using ImageJ v.1.43 g on usually more than transverse sections per embryo. The number of cells positive for a marker per section was esta on between 2 to 6 transverse sections per embryo. The number of sections taken into account p the extent of electroporated cells found along the anterior-posterior axis of the embryo. The mea calculated and is represented with a dot on graphs. Fluorescence intensities in GFP cells were of interests whose size was adapted to that of cell nuclei and multi-measurement plugin. These embryos and often in more than 5 embryos, the number of embryos analysed is always given in intensities, the greatest variations in the data was set between cells and not between embryos. developmental stage of each cells, their localisation within the neural tube and the levels of exp probabilities of similarity between two populations of values (i.e. between two types of chick sam Mann-Whitney U test in GraphPad Prism and all the p-values are given in figures legend. All qu Table.
EdU pulse labelling and staining
A solution of EdU 500uM was injected within the neural tube lumen 20h before harvest. Immuno performed as described previously [114] and with the Click-it EdU system (Thermo fisher).
Cell dissociation from chick embryos
GFP positive neural tube regions were dissected after a DispaseI-DMEM/F-12 treatment (Stem 37°C, 30min). Single cell suspensions were obtained by 3 minutes incubation in Trypsin-EDTA 0 mechanical pressure. Inhibition of Trypsin was ensured using with cold foetal bovine serum (FB
RT-quantitative real-time-PCR on FAC sorted cells
GFP cells were sorted using BD Influx Sorter (BD Biosciences). Total RNA was extracted from RNAqueous-Micro kit with DNAseI (Life technologies) instructions. RNA quality was assessed b DS-11 FX spectrometer). cDNA was synthesized by SuperScript VILO (Life Technologies) acco RT–PCR was performed using the Veriti ™ 96- Well Fast Thermal Cycler (Applied Biosystems) with the StepOnePlus™ real-time PCR system (Applied Biosystems) using SYBR Green detect Primers can be found in S1 Methods. The expression of each gene was normalised to that of TB
FOXF1, MYOD1, PITX2, RB1, TFAP2α, TFAP2β, TBP expressions were assessed in n = 6 (pC FOXO1) independent experiments. Other genes were tested in 3 independent experiments per
statistical analyses using Mann-Whitney U-test or two-way ANOVA test were performed in Grap
Flow cytometry-based cell cycle analysis
Dissociated cells were stained with 5uM Vybrant DyeCycle violet stain (V35003, Thermo Fisher minutes in the dark. Light scattering parameters were quantified using a Cyan ADP flow cytome were processed using Flowjo software v10.7.1 (Becton Dickinson, USA). Representative gating Single cell events were gated by forward scatter (FCS) peak vs Area (S6Ai Fig). Cells were also FSC Area vs Side Scatter (S6Aii Fig). FSC arear vs GFP-log properties were used to segregate cells from GFP wild-type cells (S6Aiii Fig). Cell cycle analysis was performed by using the Dea
+
+
-in each cell cycle phase was generated us-ing Excel or GraphPad (Fig 6C; S6C Fig).
GFP and DNA labelling and imaging 3D chick embryos
Samples were incubated overnight with Atto488 (1/300, Sigma) at 4°C for GFP staining, washe 5–10 minutes in DRAQ5 (1/1000, Thermofisher) for DNA staining and finally washed in PBS. Sa ventral side in 1% agarose for 3D imaging. 3D scans of samples were obtained with a 2-photon a femtosecond pulsed Insight Spectra Physics laser, a Carl Zeiss 20x, NA 1.0 (water immersion BioTek) image acquisition software. A single wavelength of 930nm was used for exciting all fluo Two GaAsp sensitive photomultipliers allowed simultaneous detection of the two emission lights dichroic mirror 585nm and a bandpass filter 525/50nm.
3D images processing and quantitative analyses
Image pre-processing and segmentation were performed using ImageJ and Imaris. Background channel to eliminate autofluorescence coming from the tissue. Bleach correction normalizing the thickness was performed on DRAQ5 channel stacks of thick samples, notably 72hpe samples. A automatic surface segmentation plugin based on intensity and size (<95 voxels) allowed remova and dead cells x,y,z coordinates of the centre point, the major axis of their ellipsoid fit, the spher retrieved for all segmented nuclei. The surfaces encompassing the neural tube, the neural cavit were delineated on the DRAQ5 signal, on x-y planes every 3 z-stacks. Distance Transformation segmentation was used to quantify the distance between the centre of the nuclei and this cavity running DBSCAN algorithm on Matlab [115]. Clusters contained a minimum of 3 cells, and the m that belong to the same cluster was fixed to 10μm. Cell orientation was established by convertin vector representing the major axis of the ellipsoid fit of GFP positive cells into polar coordinates Graphpad Prism were used for graphic representation and statistical analyses.
Imaging the apical surface of Par3 and GFP labelled spinal cord
Dissected spinal cords were fixed in PFA4% for 1h and washed in PBS. Immunofluorescences w Open-book preparation of the samples flatten between a slide and coverslip was imaged using (Leica DMi8: CSU-W1 Yokogawa spinning disk) and MetaMorph (Molecular Devices) image acq
Supporting information
S1 Fig.(A) Body locations of RMS biopsies. Locations of FP-RMS (red) and FN-RMS (blue) biopsies
assessed in Fig 2A and coming from previous studies [42–46]. ND: Non determined. (B) PITX2
RMS from FN-RMS cells. (i, iii) Pictures of western blots using the indicated antibodies on pro
FN-RMS (RD, RDAbl, Rh36) and FP-RMS (Rh3, Rh5, SJRH30, Rh4) cell lines and (ii) normaliz GAPDH. This shows variable levels of PAX3-FOXO1 (i, ii) between FP-RMS cell lines and of MY In addition, specific ectopic expression of several PITX2 isoforms (iii) in FP-RMS versus FN-RM to S4 Raw images).
https://doi.org/10.1371/journal.pgen.1009164.s001 (TIF)
S2 Fig. Extended characterization of PAX3-FOXO1’s ability to induce FP-RMS signature genes.
(A) (i-ii') Immunodetection of GFP and PAX2 on transverse sections of chick embryos 48hpe w
Quantification of PAX2 expression levels in GFP cells in the spinal cords of chick embryos 48h (dots: single cell values; bars: mean ± s.e.m.; n>5 embryos). (B) Immunodetection of GFP and
chick embryos 48hpe with the indicated plasmids. x” panels are views on the myotome (myo) of Immunostaining for GFP, Turquoise direct fluorescence and DAPI staining on transverse section indicated plasmids and a reporter for human PRDM12 and CDH3 . (Civ) Quantification that of GFP in cells electroporated with PRDM12 reporter at 24hpe (dots: single cell values embryos). Mann-Whitney U test p-value: ****: p< 0.0001. Scale bars: 50μm.
https://doi.org/10.1371/journal.pgen.1009164.s002 (TIF)
S3 Fig. Cell shape and orientation dynamics induced by PAX3-FOXO1.
(A) (i-iii) Projection of 3D images of embryos 48hpe with the indicated plasmids, stained with D (i’-iii’) Result of the segmentation performed at the level of the boxes indicated on samples i-iii.
electroporated half of the neural tube are transparent yellow, while cell nuclei are coloured. In p segregating progenitor nuclei from neurons is highlighted in transparent red. (iv) x (medial-later (dorsal-ventral) axes giving the orientation of i-iii samples. (B) (i-iii) Representative 3D shape of scanned whole embryos 48hpe with the indicated plasmids. (iv) Temporal dynamics of the ellipt segmentation of GFP nuclei (as shown in i-iii) in whole-mount embryos (mean ± s.d., n>6 emb dimensions of the chick embryos of θ and φ polar angles of the vector (blue arrow) defining the circle). (ii-iii) φ (ii) and θ (iii) possible values and major axes of chick embryos (black circles) an electroporated with the indicated plasmids at 48hpe.
https://doi.org/10.1371/journal.pgen.1009164.s003 (TIF)
S4 Fig. Extended characterization of the epithelial-mesenchymal transition triggered by PAX3-FOXO1.
(A) Immunodetection of GFP, PARD3, activated βCATENIN (βCAT.) and β1-INTEGRIN on trans
48hpe with the indicated plasmids. In i and ii, x’ and x” panels are blown up on a subset of x pan x” are blown up on a subset of x panel GFP and GFP cells. Arrowheads in x’ panels point are on the basal side of cells. Arrows in iii’ indicate increased levels of β1-INTEGRIN at the membra Scale bars: 50μm. (B) Normalized levels of SNAI1 and ADAM10 mRNA assayed by DNA micro biopsies (dots: RNA sample values; bars: mean ± s.e.m.; Mann-Whitney U test p-value: ****: p< https://doi.org/10.1371/journal.pgen.1009164.s004
(TIF)
S5 Fig. Cell cycle state of PAX3 and PAX3-FOXO1 overexpressing embryonic spinal cells.
(A) (i-iii”) GFP and activated CASPASE3 immunodetection and DAPI staining on transverse se
the indicated plasmids. (iv) Quantification of the number of activated CASPASE3 cells in the G with the indicated plasmids (dots: embryo values; bar plots: mean ± s.e.m.). (B) GFP and MCM staining on transverse sections of chick embryos 48hpe with the indicated plasmids. (iv) Quanti cells 48hpe with the indicated plasmids (dots: single cell values; bar plots: mean ± s.e.m.; n>5 e fold changes in the expression of the indicated genes relative to their mean expression in pCIG GFP from chick embryos 48hpe with the indicated constructs. (D) Quantification of the number population in embryos 24hpe with the indicated plasmids (dots: embryo values; bar plots: mean blown up on a subset of x panel GFP cells. Mann-Whitney U test p-value: *: p< 0.05, **: p<0.0 p>0.05. Scale bars: 50μm.
https://doi.org/10.1371/journal.pgen.1009164.s005 (TIF)
S6 Fig. Cell cycle phases of PAX3 and PAX3-FOXO1 overexpressing cells.
(A) FACS gating strategy in 3 steps using Flowjo: (i) isolation of singlets (FS: forward scatter/ap
(ii) selection of cells based on their size (FS: forward scatter) and granularity (SS: side scatter);
CRM CRM CRM + + -+ + +
GFP pools. (B) FACS plots showing DNA content distribution of GFP (i,ii,iii) and GFP (i',ii’,iii’) Vybrant DyeCycle Violet stain (black line) and the Dean/Jett/Fox model based cell cycle phases the distribution with the model; pink area: G0/G1 phase, blue area: S phase and green area: G2 with the indicated plasmids. (C) Proportion of cells in the indicated cell cycle phase assayed by sorted GFP and GFP chick neural (i-iii) and Human Forskin Fibroblats (HFF; iv-vi) stained with (dots: mean value on cells analysed on independent FAC sorted samples; bar plots: mean ± s.e 0.05, **: p<0.01, ***: p<0.001, ns: p>0.05).
https://doi.org/10.1371/journal.pgen.1009164.s006 (TIF)
S7 Fig. Extended characterization of PAX7-FOXO1 transformation properties.
(A) (i-ii”) Immunodetection of GFP and SOX2 on transverse sections of chick embryos 48hpe w
Mantle Zone; SVZ: Sub-Ventricular Zone. (iii) Percentage of SOX2 cells in the GFP populatio (dots: embryo values; bar plots: mean ± s.e.m. (B) In situ hybridization for LMO4 (i-ii”), PITX2a GFP and PAX2 (v-vi”) on transverse sections of chick embryos 24hpe (i-iv”) or 48hpe (v-vi’) with i-iv in display region of the DRG, somite or endoderm regions of x sample. DRG: dorsal root gan myotome. (C) Quantification of the number of PH3 cells in the GFP cells in embryos 48hpe w Immunodetection of GFP and CDKN1c on transverse sections of chick embryos 48hpe with the N: neurons. x’ and x” panels are blown up on a subset of x panel GFP cells. Mann-Whitney U t ****: p<0.0001, ns: p>0.05. Scale bars: 50μm.
https://doi.org/10.1371/journal.pgen.1009164.s007 (TIF)
S1 Methods. Enhancer reporter cloning steps, Primers and antibodies lists.
https://doi.org/10.1371/journal.pgen.1009164.s008 (DOCX)
S1 Table. Gene expression levels in FP-RMS biopsies.
Normalised expression levels of genes assayed using DNA-microarrays in FP-RMS biopsies (S https://doi.org/10.1371/journal.pgen.1009164.s009
(XLSX)
S2 Table. Gene expression levels in FN-RMS biopsies.
Normalised expression levels of genes assayed using DNA-microarrays in FN-RMS biopsies https://doi.org/10.1371/journal.pgen.1009164.s010
(XLSX)
S3 Table. Origin of transcriptomes presented in S1 and S2 Tables and location of PAX3-FOXO1 bound regions
Sheet 1: Origin of the samples and presence or not of PAX3-FOXO1 or PAX7-FOXO1. Sheet 2: CRM (peaks) nearby the genes assayed in Sheet1. Sheet 2: Position of PAX3-FOXO1 bound C https://doi.org/10.1371/journal.pgen.1009164.s011
(XLSX)
S4 Table. Results of the Gene Ontology Biological Process term enrichment analysis.
Sheet 1: Statistics for GO terms related to cell identity, migration and cell cycle regulation enrich RMS. Sheet 2: FP-RMS upregulated genes assigned to cell identity. Sheet 3: FP-RMS upregula migration and adhesion. Sheet 4: FP-RMS upregulated genes assigned to cell cycle regulation https://doi.org/10.1371/journal.pgen.1009164.s012 (XLSX) - - + - + + + + + +
1.
View Article PubMed/NCBI Google Scholar
2.
View Article PubMed/NCBI Google Scholar
3.
View Article PubMed/NCBI Google Scholar
4.
View Article PubMed/NCBI Google Scholar
S5 Table. Matrices of the data graphed in the manuscript Figures.
https://doi.org/10.1371/journal.pgen.1009164.s013 (XLSX)
S6 Table. Cell parameters quantified from 3D scans of whole embryos at 48hpe.
Data obtained on a given scan on a given embryo are presented in one independent sheet. Dat presented on a single line.
https://doi.org/10.1371/journal.pgen.1009164.s014 (XLSX)
S1 Raw image. Full western blot membrane presented in S1B Fig_anti-FOXO1.
https://doi.org/10.1371/journal.pgen.1009164.s015 (TIF)
S2 Raw image. Full western blot membrane presented in S1B Fig_anti-GAPDH.
https://doi.org/10.1371/journal.pgen.1009164.s016 (TIF)
S3 Raw image. Full western blot membrane presented in S1B Fig_anti-PITX2.
https://doi.org/10.1371/journal.pgen.1009164.s017 (TIF)
S4 Raw image. Full western blot membrane presented in S1B Fig_anti-MYOD1.
https://doi.org/10.1371/journal.pgen.1009164.s018 (TIF)
Acknowledgments
We deeply thank the ImagoSeine core facility of Institut Jacques Monod, a member of France-B certified IBiSA. We thank Griselda Wentzinger and Magali Fradet for performing cell sorting at I platform. We are grateful to the people who have provided us with useful tools. We are grateful wording tips. We received plasmids from Sophie Bel Vialar, Marie Henriksson, Elisa Marti, Gwe FP-RMS and ERMS cell lines from Cécile Gauthier-Rouvière.
References
Bradner JE, Hnisz D, Young RA. Transcriptional Addiction in Cancer. Cell. 2017;168:629–643. pmid:28187285
Balani S, Nguyen LV, Eaves CJ. Modeling the process of human tumorigenesis. Nat Commun. 2017;8:1–10. p
Parham DM, Barr FG. Classification of Rhabdomyosarcoma and Its Molecular Basis. Adv Anat Pathol. 2013;2
Nguyen TH, Barr FG. Therapeutic Approaches Targeting PAX3-FOXO1 and Its Regulatory and Transcriptiona Molecules. 2018;23:2798. pmid:30373318
5.
View Article PubMed/NCBI Google Scholar
6.
View Article PubMed/NCBI Google Scholar
7.
View Article PubMed/NCBI Google Scholar
8.
View Article PubMed/NCBI Google Scholar
9.
View Article PubMed/NCBI Google Scholar
10.
View Article PubMed/NCBI Google Scholar
11.
View Article PubMed/NCBI Google Scholar
12.
View Article PubMed/NCBI Google Scholar
13.
View Article PubMed/NCBI Google Scholar
14.
View Article PubMed/NCBI Google Scholar
15.
View Article PubMed/NCBI Google Scholar
16.
Shern JF, Chen L, Chmielecki J, Wei JS, Patidar R, Rosenberg M, et al. Comprehensive genomic analysis of alterations affecting a common genetic axis in fusion-positive and fusion-negative tumors. Cancer Discov. 201
Chen L, Shern JF, Wei JS, Yohe ME, Song YK, Hurd L, et al. Clonality and Evolutionary History of Rhabdomy pmid:25768946
Luijten MNH, Lee JXT, Crasta KC. Mutational game changer: Chromothripsis and its emerging relevance to ca Mutation Research. 2018;777:29–51. pmid:30115429
Linardic CM. PAX3-FOXO1 fusion gene in rhabdomyosarcoma. Cancer Lett. 2008;270:10–18. pmid:18457914
Marshall AD, Grosveld GC. Alveolar rhabdomyosarcoma—The molecular drivers of PAX3/7-FOXO1-induced pmid:23206814
Bennicelli JL, Advani S, Schäfer BW, Barr FG, Schafer BW, Barr FG. PAX3 and PAX7 exhibit conserved cis-a utilize a common gain of function mechanism in alveolar rhabdomyosarcoma. Oncogene. 1999;18:4348–4356
Cao L, Yu Y, Bilke S, Walker RL, Mayeenuddin LH, Azorsa DO, et al. Genome-wide identification of PAX3-FK reveals candidate target genes important for development and cancer. Cancer Res. 2010;70:6497–6508. pmi
Gryder BE, Yohe ME, Chou H-C, Zhang X, Marques J, Wachtel M, et al. PAX3-FOXO1 Establishes Myogenic Bromodomain Vulnerability. Cancer Discov. 2017;:CD-16-1297. pmid:28446439
Keller C. Pax3:Fkhr interferes with embryonic Pax3 and Pax7 function: implications for alveolar rhabdomyosa 2004;18:2608–2613. pmid:15520281
Hanahan D, Weinberg RA. Hallmarks of cancer: The next generation. Cell. 2011;144:646–674. pmid:2137623
Kikuchi K, Tsuchiya K, Otabe O, Gotoh T, Tamura S, Katsumi Y, et al. Effects of PAX3-FKHR on malignant phe Biochem Biophys Res Commun. 2008;365:568–574. pmid:18022385
Ginsberg JP, Davis RJ, Bennicelli JL, Nauta LE, Barr FG. Up-regulation of MET but not neural cell adhesion m fusion protein in alveolar rhabdomyosarcoma. Cancer Res. 1998;58:3542–3546. pmid:9721857
View Article PubMed/NCBI Google Scholar
17.
View Article PubMed/NCBI Google Scholar
18.
View Article PubMed/NCBI Google Scholar
19.
View Article PubMed/NCBI Google Scholar
20.
View Article PubMed/NCBI Google Scholar
21.
View Article PubMed/NCBI Google Scholar
22.
View Article PubMed/NCBI Google Scholar
23.
View Article PubMed/NCBI Google Scholar
24.
View Article PubMed/NCBI Google Scholar
25.
View Article PubMed/NCBI Google Scholar
26.
View Article PubMed/NCBI Google Scholar
27.
Strahm B, Durbin AD, Sexsmith E, Malkin D. The CXCR4-SDF1α axis is a critical mediator of rhabdomyosarc marrow stroma. Clin Exp Metastasis. 2008;25:1–10. pmid:17768666
Jankowski K, Kucia M, Wysoczynski M, Reca R, Zhao D, Trzyna E, et al. Both hepatocyte growth factor (HGF metastatic behavior of human rhabdomyosarcoma cells, but only HGF enhances their resistance to radiochem pmid:14633723
Thuault S, Hayashi S, Lagirand-Cantaloube J, Plutoni C, Comunale F, Delattre O, et al. P-cadherin is a direct rhabdomyosarcoma aggressiveness. Oncogene. 2013;32:1876–1887. pmid:22710718
Sebire NJ. Myogenin and MyoD1 expression in paediatric rhabdomyosarcomas. J Clin Pathol. 2003;56:412–4
Calhabeu F, Hayashi S, Morgan JE, Relaix F, Zammit PS. Alveolar rhabdomyosarcoma-associated proteins P the transcriptional activity of MyoD-target genes in muscle stem cells. Oncogene. 2012;32:651–662. pmid:227
Margue CM, Bernasconi M, Barr FG, Schafer BW. Transcriptional modulation of the anti-apoptotic protein BC PAX3 and PAX3/FKHR. Oncogene. 2000;19:2921–2929. pmid:10871843
Ayyanathan K, Fredericks WJ, Berking C, Herlyn M, Balakrishnan C, Gunther E, et al. Hormone-dependent tu transcriptional repressor directed at the PAX3-FKHR oncogene. Cancer Res. 2000;60:5803–5814. pmid:1105
Linardic CM, Naini S, Herndon JE, Kesserwan C, Qualman SJ, Counter CM. The PAX3-FKHR fusion gene of p16INK4A to promote bypass of cellular senescence. Cancer Res. 2007;67:6691–6699. pmid:17638879
Zhang L, Wang C. PAX3-FKHR transformation increases 26 S proteasome-dependent degradation of p27Kip expression. J Biol Chem. 2003;278:27–36. pmid:12401804
Roeb W, Boyer A, Cavenee WK, Arden KC. PAX3-FOXO1 controls expression of the p57Kip2 cell-cycle regul Acad Sci U S A. 2007;104:18085–18090. pmid:17986608