Cars on a Diet: The Material and Energy Impacts of
Passenger Vehicle Weight Reduction in the U.S.
by Lynette W. Cheah
B.Sc. Civil and Environmental Engineering, Northwestern University, 2001 M.Sc. Management Science and Engineering, Stanford University, 2002
S.M. Mechanical Engineering, Massachusetts Institute of Technology, 2008 SUBMITTED TO THE ENGINEERING SYSTEMS DIVISION IN PARTIAL FULFILLMENT
OF THE REQUIREMENTS FOR THE DEGREE OF
DOCTOR OF PHILOSOPHY IN ENGINEERING SYSTEMS AT THE
MASSACHUSETTS INSTITUTE OF TECHNOLOGY
SEPTEMBER 2010
ARCHIVES
ASSACHUSETS INSTITUITE OF TECHNOLOGYFEB 17 M11
LIBRARIES
@ 2010 Lynette W. Cheah. All rights reserved.The author hereby grants to MIT permission to reproduce and to distribute publicly paper and electronic copies of this thesis document in whole and in part in any medium now known or hereafter created.
Signature of autho r ...
Engineering Systems Division July 31, 2010 Certified by... ...
Sun Jae Profe
Certified by
...
Associate Professor of M
Jon B. Heywood ssor of Mechanical Engineering, Emeritus A Thesi Supervisor
Randolph E/Kirchain
aterial Science and Engi ering Systems/ommittee
Chair C ertified by...Warr n P. Seering WA- e C-- ecnainmoring and Engi n4ering Systems
A ccepted by ...gI ... M ... Nancy Leveson
Professor of Aeronautics and Astronautics and Engineering Systems Chair, Engineering Systems Division Education Committee
Cars on a Diet: The Material and Energy Impacts of
Passenger Vehicle Weight Reduction in the U.S.
by Lynette W. Cheah
Submitted to the Engineering Systems Division on September 1, 2010, in Partial Fulfillment of the Requirements for the Degree of Doctor of Philosophy in Engineering Systems
ABSTRACT
Vehicle weight reduction is a known strategy to address growing concerns about greenhouse gas emissions and fuel use by passenger vehicles. We find that every 10% reduction in vehicle weight can cut fuel consumption by about 7%.
In the U.S., vehicle weight reduction is essential for meeting future, more stringent fuel economy standards. New vehicles are required on average to achieve at least 34.1 miles per gallon (MPG) by year
2016, up from 28.8 MPG today. Scenarios of future vehicle characteristics and sales mix indicate that the
target is aggressive. New vehicles must not only become lighter, but also forgo horsepower
improvements, and progressively use advanced, more fuel-efficient powertrains, such as hybrid-electric drives.
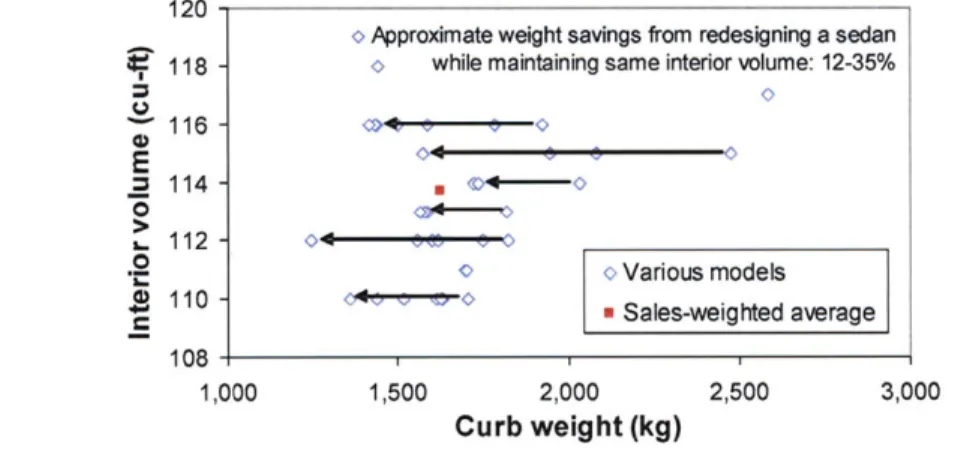
We can reduce weight by substituting some of the iron and steel used in vehicles with lighter-weight high-strength steel or aluminum, redesigning the vehicle, and/or downsizing the vehicle. Using these approaches, it is possible to achieve up to 40% (690 kg) vehicle weight reduction. However, the cost associated with manufacturing lighter-weight vehicles is a nontrivial $3 to $4 per kilogram of total weight saved. In addition, the life-cycle energy impacts of using alternative lightweight materials, which tend to be more energy-intensive to process, must also be considered.
In this dissertation, the energy implications of pursuing this lightweighting strategy are explored on a vehicle life-cycle- and vehicle fleet system-level basis. A model of the energy and material flows through the evolving vehicle fleet system over time has been developed, which accounts for potential changes in future vehicle weight and material composition. The resultant changes in material production energy and fleet fuel savings, which are the main energy burdens for the entire product system - the vehicle fleet - are estimated.
The new 2016 fuel economy standards and more stringent standards beyond can realize significant fuel savings of 1,550 billion liters through year 2030. However, the advanced powertrains that are expected to enter the marketplace are heavier and require more energy to produce. Their production impact may be offset by efforts to use less energy-intensive high-strength steel to lightweight new vehicles, as well as efficiency gains in material processing.
Thesis Committee: Professor John B. Heywood Professor Randolph E. Kirchain Professor Warren P. Seering
ACKNOWLEDGEMENTS
This dissertation could not have been completed without the support and mentorship of many people. I would like to thank my thesis committee for the sound guidance along this journey. I am fortunate to have found Professor John Heywood as a wonderful and inspiring advisor. His encouragement,
experience and expertise have been truly invaluable. Randy Kirchain took me under his wing and taught me to think analytically, creatively, methodologically. Warren Seering puts his students first, and I appreciate all the practical advice and encouragement.
My colleagues at the "Before H2" group at the MIT Sloan Automotive Laboratory, past and present, are all great company. I thank them for the cheer and useful interactions which helped form my project.
I am grateful to Rich Roth and everyone at the MIT Materials Systems Laboratory, for adopting me as a
"bandit" member, teaching me the subtleties of Microsoft Excel, and sharing humor and wit while getting good, serious work done.
Here is a shout out to those who helped review various chapters of this thesis: Elisa Alonso, Fernando de Sisternes, Valerie Karplus, Don MacKenzie, Trisha Montalbo and Stephen Zoepf.
Beth Milnes, Karla Stryker-Currier, Janet Maslow, Leslie Regan, and Terra Cholfin are the tireless and wonderful staff who keep the wheels of departments and offices running smoothly.
Both my undergraduate scholarship and graduate fellowship were supported by the Singapore Agency for Science, Technology and Research.
My time at MIT and Cambridge would not be as enjoyable or complete without my friends, who shared
in the fun, laughter, ice cream, chiffon cakes, meals, hikes, outings, and way too many strategic board games. Special thanks to Daryl and Xiaojuan Lim, for recommending I install EndNote.
I thank my family in Singapore, for all the love and care packages, and for waiting. I am especially
thankful to my mother-in-law, Jane Lim, for caring for my toddler when I was writing this thesis. This thesis is dedicated to my husband and our beautiful daughter, Kenneth and Juniper Lim. They define my life story, in which this Ph.D. journey is but a chapter. Kenneth is my best friend, confidant, personal chef, 2009 household MVP, ukulele player, supper buddy all -in-one. Thank you for always being patient, funny, and there for us.
Looking forward to starting and ending more new chapters, Lynette Cheah
lynette@alum.mit.edu
Cambridge, Massachusetts, USA July 2010
TABLE OF CONTENTS
ABSTRACT...3
ACKNOW LEDGEM ENTS... 4
LIST OF FIGURES AND TABLES...7
ABBREVIATIONS AND NOM ENCLATURE ... 10
1 INTRO DUCTION ... 13
1.1 Prior w ork and this contribution...16
1.2 Research approach...19
2 THE RELATIONSHIP BETWEEN VEHICLE WEIGHT AND FUEL CONSUMPTION... 23
2.1 The physics of vehicle w eight reduction ... 24
2.2 The physics of vehicle size reduction ... 26
2.3 Em pirical data ... 28
2.4 Results from the literature... 30
2.5 Vehicle sim ulation ... 31
2.6 Chapter sum m ary...32
3 HOW TO REDUCE VEHICLE W EIGHT, AND ITS COST ... 33
3.1 Current U.S. vehicle w eight characteristics ... 33
3.2 M aterial substitution ... 34
3.2.1 High-strength steel ... 36
3.2.2 Alum inum ... 36
3.2.3 M agnesium ... 36
3.2.4 Polym er com posites... 36
3.2.5 Other m aterials ... 37
3.2.6 W eight saving potential of m aterial substitution ... 37
3.3 Vehicle redesign ... 38
3.4 Vehicle dow nsizing...41
3.5 Brief note on safety im plications ... 45
3.6 The cost of vehicle weight reduction ... 45
3.6.1 Literature review ... 45
3.6.2 Cost com parison w ith other fuel-saving technologies... 47
3.7 Chapter sum m ary...50
4 THE IMPORTANCE OF VEHICLE WEIGHT REDUCTION IN THE U.S. ... 51
4.1 U.S. vehicle w eight and size trends... 51
4.2 Response to fuel econom y m andates... 52
4.3 Other nearer-term fuel-saving strategies ... 54
4.3.1 De-emphasize vehicle horsepower/acceleration performance ... 55
4.3.2 Alternative pow ertrains ... 58
4.4 2016 vehicle sales m ix scenarios ... 60
4.5 2030 vehicle sales m ix scenarios ... 64
4.6 The im portance of lead tim e in setting fuel econom y standards... 66
5 VEHICLE FLEET FUEL SAVINGS...71
5.1 The importance of a dynamic, vehicle fleet-level perspective ... 71
5.2 Vehicle fleet model ... 72
5.3 Results: Fuel use savings...75
6 AUTOMOTIVE MATERIAL PRODUCTION ENERGY AND RECYCLING IMPACTS ... 79
6.1 Methodology and scope ... 79
6.1.1 Material composition of future vehicles... 79
6.1.2 Energy intensity of automotive material production ... 83
6.2 Results: Material production energy impact ... 86
6.3 Results: Automotive material stocks and flows... 91
6.4 Chapter summary...96
7 CO N CLU SIO N ... 97
7 .1 Key findings ... 97
7.2 Further w o rk ... 100
A PPEN DIC ES ... 10 2 A. Further notes on vehicle fuel consumption...102
B. Calculating the Emphasis on Reducing Fuel Consumption (ERFC)...103
C. Magnesium as a lightweight automotive material ... ... 105
D. The cost of vehicle electrification: A literature review...108
E. Projections of diesel vs. gasoline hybrid-electric vehicle sales in the U.S. ... 112
F. Screenshot of spreadsheet for analyzing future vehicle sales mix scenarios...113
G. Monte Carlo simulation of 2016 vehicle sales mix scenarios ... 114
H. Life-cycle inventory databases considered ... 116
LIST OF FIGURES AND TABLES
Figure 1-1. Sales-weighted average fuel economy of new U.S. light-duty passenger vehicles
(NHTSA-reported CA FE)... ... -. . ---... 14
Figure 1-2. Average new U.S. vehicle curb weight, 1975-2009 ... 15
Figure 1-3. Material production energy intensity of steel vs. lighter-weight automotive materials ... 16
Figure 1-4. Comparing life-cycle energy use in million BTUs when using different materials in a car's body panel ...-. . . ---... 17
Figure 1-5. M odel overview ... 20
Figure 1-6. Word cloud of this thesis, created using WordeT M . . . .21
Figure 2-1. Distribution of fuel energy in a vehicle... 24
Figure 2-2. Forces on an accelerating vehicle on a level road ... 25
Figure 2-3. The relationship between vehicle mass and tractive force ... 27
Figure 2-4. Work distribution for a compact car in different drive cycles... 27
Figure 2-5. Curb weight and fuel consumption of U.S. MY2006-2008 vehicles ... 28
Figure 2-6. Curb weight and fuel consumption of select MY2006-2008 U.S. gasoline cars and pickups ... 29
Figure 2-7. Simulation results - Curb weight-fuel consumption relationship for today's vehicles...31
Figure 3-1. Vehicle m ass distribution by subsystem ... 34
Figure 3-2. Material composition of the average automobile in the U.S... 34
Figure 3-3. Potential weight savings from redesigning MY2007-08 midsize sedans while maintaining sam e interior volum e ... 38
Figure 3-4. How vehicle weight scales with vehicle size (footprint)...42
Figure 3-5. How vehicle weight scales with vehicle size (segment) ... 42
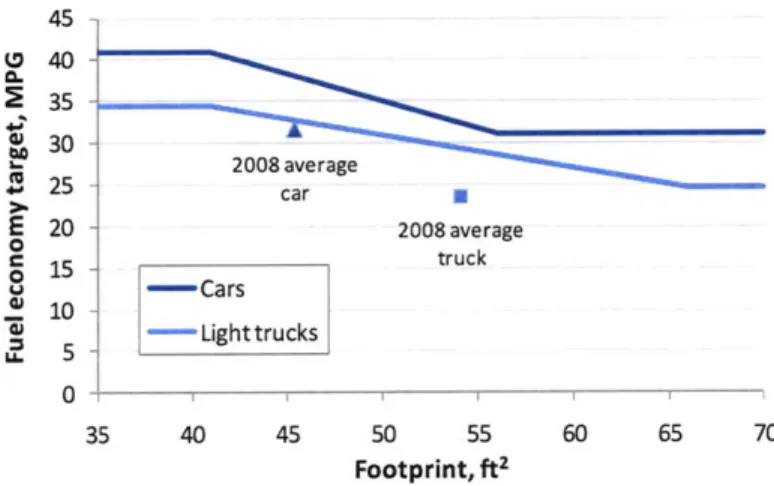
Figure 3-6. Vehicle footprint-based fuel economy (CAFE) targets for MY2016 ... 43
Figure 3-7. Current passenger vehicle sales by segment in different markets... 43
Figure 3-8. Effect of light truck sales on the average new vehicle weight and (EPA-adjusted) fuel consum ptio n ... . ----. ... -. . --... 44
Figure 3-9. Effect of downsizing within vehicle segments on the average new vehicle weight and fuel co nsum ptio n ...--.... 44
Figure 3-10. Cost of vehicle weight reduction from the literature ... 47
Figure 3-11. Cost-effectiveness of various fuel-saving vehicle technologies ... 48
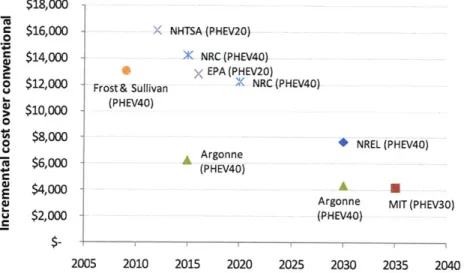
Figure 3-12. Estimates of plug-in hybrid cars' incremental manufacturing cost over conventional vehicles ... 4 9 Figure 4-1. Historical market share of new vehicles by segment ... 52
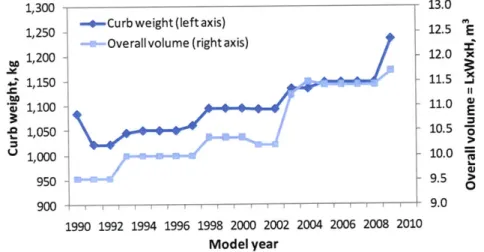
Figure 4-2. Curb weight and overall volume of Toyota Corolla introduced in the U.S., model years 1990-2 0 0 9 ... 5 2 Figure 4-3. Average fuel economy of new passenger vehicles (NHTSA-reported CAFE)...54
Figure 4-4. Trends of average new U.S. car characteristics, 1975-2009... 55
Figure 4-5. Historic Emphasis on Reducing Fuel Consumption (ERFC) for average new U.S. car...56 Figure 4-6. Trade-off between acceleration performance and fuel consumption in average 2030 gasoline ve hicle s...5 7
Figure 4-7. Relative fuel consumption of an average new U.S. gasoline car at varying levels of ERFC...58
Figure 4-8. Future fuel consumption improvements at 100% ERFC, by powertrain ... 60
Figure 4-9. Two-way sensitivity plot - points within the triangle achieve >34.1 mpg in 2016 ... 64
Figure 4-10. New vehicle fleet characteristics - historical and a future "combination" scenario ... 65
Figure 4-11. Illustrative OEM product plan, showing time taken to update the entire vehicle portfolio.. 67
Figure 4-12. Distribution of curb weights for new U.S. passenger cars and SUVs sold in 1989 and 2009.68 Figure 5-1. Assum ed m edian vehicle lifetim e ... 73
Figure 5-2. Survival rate for MY1975 and MY1990-2008 cars ... 73
Figure 5-3. Model inputs: U.S. passenger vehicle sales and scrappage, 1975-2030 ... 74
Figure 5-4. Model output: U.S. passenger vehicle stock by segment, 1975-2030 ... 74
Figure 5-5. Comparison of modeled passenger vehicle stock with other estimates...74
Figure 5-6. Annual vehicle kilometers traveled for cars from different model years ... 75
Figure 5-7. Comparing modeled passenger vehicle fleet fuel use with data from the Transportation Energy D ata Boo k...76
Figure 5-8. Passenger sales mix by segment under scenarios 1d and 2c ... 77
Figure 5-9. Passenger vehicle sales mix by powertrain under scenarios 1d and 2c...77
Figure 5-10. Average new vehicle curb weight and (EPA adjusted) fuel consumption under scenarios 1d a n d 2 c ... 7 7 Figure 5-11. Annual U.S. passenger vehicle fleet fuel use ... 78
Figure 6-1. Material breakdown of various concept lightweight midsize sedans ... 80
Figure 6-2. Material breakdown of a future lightweight vehicle, by degree of weight reduction ... 81
Figure 6-3. Material composition of 2009 vehicles, by powertrain... 82
Figure 6-4. Energy requirement of a 2000 car, by life-cycle phase ... 84
Figure 6-5. Material production energy intensity over time ... 85
Figure 6-6. Relative characteristics of 2009 cars driven by various powertrains ... 86
Figure 6-7. Total vehicle life-cycle energy demands by life-cycle stage for various cars ... 88
Figure 6-8. Annual automotive material production energy demand under various scenarios ... 90
Figure 6-9. Average annual automotive material production energy demand per vehicle ... 90
Figure 6-10. Material production energy demand per vehicle for Scenario D under different material pathw ays...9 1 Figure 6-11. Material stocks embodied in the in-use passenger vehicle fleet, under two lightweighting m aterial pathw ays ... 92
Figure 6-12. Recycled aluminum flows in and out of the U.S. passenger vehicle fleet under Scenario D .93 Figure 6-13. Steel flows in and out of the U.S. passenger vehicle fleet (Scenario D, HSS-intensive pathw ay)...94
Figure 6-14. Annual demand for electric vehicle materials in U.S. vehicles under Scenario C ... 95
Figure 6-15. Future lithium demand compared to historical production... 95
Figure 0-1. Performance-Size-Fuel economy Index (PSFI) for U.S. cars, 1977-2009 ... 104
Figure 0-2. World primary magnesium production by country, in '000 metric tons...106
Figure 0-3. Historical m agnesium price ... 107
Figure 0-4. Breakdown of a PHEV drive system cost by component...108
Figure 0-6. Estimates of PHEV Li-ion battery pack cost. Only mid-points of ranges, if any, are plotted.. 111
Figure 0-7. Projections of diesel and hybrid shares in the U.S. light-duty vehicle market...112
Figure 0-8. Monte Carlo simulation inputs and results: histogram of the average new vehicle fuel econo m y in 20 16...115
Table 1-1. Literature on the life-cycle energy impact of vehicle weight reduction in the U.S...19
Table 2-1. Mass-fuel consumption relationship for gasoline vehicles from literature...30
Table 2-2. Fuel consumption (FC)-curb weight relationship for a current conventional gasoline midsize ca r ... 3 2 Table 2-3. Assumed vehicle fuel consumption sensitivities to weight reduction for various vehicles ... 32
Table 3-1. Relevant properties of automotive materials... 35
Table 3-2. Summarized evaluation of lightweight automotive materials ... 35
Table 3-3. Weight of rear floor part using different material alternatives... 37
Table 3-4. Audi A4 vs. Mazda3 - Illustrating weight reduction potential while maintaining vehicle size and perfo rm ance ... 39
Table 3-5. Concept lightw eight vehicles ... 40
Table 3-6. U.S. EPA vehicle size classification ... 41
Table 3-7. Case studies and cost of vehicle weight reduction from the literature...46
Table 4-1. Automakers targets for vehicle weight reduction in North America... 53
Table 4-2. Average required fuel economy (MPG) under final CAFE standards... 54
Table 4-3. U.S. passenger vehicle sales mix scenarios that fulfill the 2016 fuel economy mandate ... 63
Table 4-4. U.S. passenger vehicle sales mix scenarios that double the fuel economy by 2030...65
Table 6-1. Material composition of a 2000 car and the material production energy requirement...84
Table 6-2. Future vehicle sales m ix scenarios A-D ... 89
Table 0-1. Hybrid/electric vehicle system cost estimates from literature. All are production cost, unless otherw ise stated . ...---...--...--- 109
Table 0-2. Battery cost estim ates from literature ... 110
ABBREVIATIONS AND NOMENCLATURE
Al BEV BOF CAFE Curb weight CUV EAF ERFC EPA, or USEPA Footprint Fuel consumption, FC Fuel economy, FE Fuel use GHG GREET Gross weight HEV HSS ICE Inertia weightLCA and LCI
Li-ion
Aluminum
Battery electric vehicle
Steelmaking technique using a basic oxygen furnace.
Corporate Average Fuel Economy, the sales-weighted average fuel economy of a manufacturer's vehicle fleet in a given model year.
Total weight of a vehicle with standard equipment, all necessary operating consumables (e.g. motor oil and coolant), and a full tank of fuel, while not loaded with either passengers or cargo.
Crossover utility vehicle. Its technical definition is unclear, because this originated as a marketing term. It is generally known as a vehicle with features of a sports utility vehicle that is built on a car platform. Examples include the Ford Escape, Honda CR-V and the Toyota RAV4.
Steelmaking technique using an electric arc furnace.
Emphasis on Reducing Fuel Consumption, a metric to measure the tradeoff between reducing fuel consumption vs. improving acceleration performance in future vehicles. See Section 4.3.1.
U.S. Environmental Protection Agency
A vehicle's footprint is the area within its four wheels, calculated by taking the
product of its wheelbase and its track width.
The amount of fuel consumed by a vehicle per unit distance of travel, measured in liters per 100 kilometers (L/100 km). Fuel consumption is the inverse of the more commonly used metric, fuel economy.
The distance traveled per unit of fuel used, measured in miles per gallon (MPG). This is the inverse of fuel consumption, and is the metric used in the U.S. Total fuel used, in liters of gasoline-equivalent, by either a single vehicle or the
entire vehicle fleet on the roads. Greenhouse gas
Greenhouse gases, Regulated Emissions, and Energy use in Transportation model by Argonne National Laboratory.
Curb weight plus total passenger and cargo weight capacity of the vehicle when fully loaded. Also known as Gross Vehicle Weight Rating (GVWR).
Hybrid-electric vehicle
High-strength steel, a type of alloy steel that provides better mechanical properties or greater resistance to corrosion than carbon, or mild steel. Internal combustion engine
Curb weight plus the payload, or the weight of its passengers and cargo. The payload is typically assumed to be 136 kg (300 lb).
Life-cycle assessment and life-cycle inventory
Light-duty vehicle Light truck MPG mph MSRP MY NA NHTSA NiMH NRC OEM PHEV SUV TEDB Track width VKT or VMT Wheelbase
Passenger cars (sedans and wagons) or light trucks (sport utility vehicles, vans and pickups) weighing less than 8,500 lb (gross vehicle weight).
Class of vehicles including sport utility vehicles, vans and pickups weighing less than 8,500 lb (gross vehicle weight).
Miles per gallon, units of vehicle fuel economy Miles per hour, units of vehicle speed
Manufacturer's suggested retail price Model year of new vehicles
Naturally aspirated (versus a turbo or supercharged) engine, which is the conventional type of spark-ignited (SI) gasoline internal combustion engine. Also abbreviated as NA SI.
U.S. National Highway Traffic Safety Administration
Nickel metal hydride, a type of hybrid vehicle battery chemistry
U.S. National Research Council
Original equipment manufacturer Plug-in hybrid electric vehicle Sport utility vehicle
Transportation Energy Data Book published by Davis et al [1] of Oak Ridge National Laboratory, as contracted by the U.S. Department of Energy. The distance between the centerline of the tire tread on one tire to the
centerline of the tire tread on the opposite tire on the same end of the vehicle, i.e. front track or rear track.
Vehicle kilometers or miles traveled
(this page is intentionally left blank)
1 INTRODUCTION
The transportation sector in the U.S. is responsible for two-thirds of total petroleum consumption and a third of the
nation's carbon emissions. While the automobile has enabled remarkable mobility in the lives of Americans, it is
reliant upon petroleum to fuel our transportation needs. This dependence presents a challenging energy and environmental problem. Amid growing concerns over energy security, and the impacts of global climate change, one important and effective policy option is to raise the
minimum standards for light-duty passenger vehicle fuel economy.
Chapter 1 sets the scene for exploring vehicle weight reduction in the U.S. Here, we explain the motivation behind studying this topic, review the literature, articulate the research questions, and describe the approach taken. Vehicle weight reduction is one approach to improve fuel economy, but by adopting vehicle life-cycle and vehicle fleet-level perspectives, can it ultimately reduce energy
consumption? How and when can energy savings be realized?
In the U.S., such standards have been enforced under the Corporate Average Fuel Economy (CAFE) program since the late 1970s. The standard has remained mostly unchanged for the past three decades, however, until a new rule was issued in 2010. As shown in Figure 1-1, new passenger cars and light trucks, including sport utility vehicles (SUVs), pickups, and minivans, are now required on average to achieve at least 34.1 miles per gallon (MPG) by year 20161, up from 28.8 MPG today. Even higher standards are currently being considered for years 2017-2025. Auto manufacturers are obliged to respond by actively pursuing ways to improve the fuel efficiency of their vehicles. Vehicle weight and size reduction is one known strategy to improve fuel economy in vehicles, and presents an opportunity to reduce fuel use from the transportation sector. By reducing the mass of the vehicle, the inertial forces that the engine has to overcome when accelerating
are less, and the work or energy required to move the vehicle is thus lowered. A general rule of thumb is that for
every 10% reduction in vehicle weight, the fuel consumption of vehicles is reduced by 5-7%.
The U.S. Environmental Protection Agency (EPA)'s final rule is to achieve a MY2016 greenhouse gas emissions standard of 250
U-N.-Figure 1-1. Sales-weighted average fuel economy of new U.S. light-duty passenger vehicles (NHTSA-reported CAFE) 40
0
35 - 34.1 30 - 28.8 E o 25 -w 20 -S15-M 10 - -+- Historica values achieved
5 -- New national fuel economy program (2010) 0
1975 1985 1995 2005 2015 2025
Notes on vehicle fuel economy
e Fuel consumption vs. fuel economy - Since the interest is in reducing the amount of fuel used by vehicles, the preferred metric to measure a vehicle's fuel efficiency is the fuel consumed per unit distance of travel (in liters per 100 kilometers or gallons per 100 miles), as opposed to the inverse mileage per unit of fuel (in MPG). In our assessment, fuel consumption is used in all calculations, but the more familiar metric - fuel economy - will also be documented.
- EPA vs. NHTSA fuel economy values - The sales-weighted average fuel economy of new U.S. passenger vehicles is reported by two different agencies each year -the U.S. Environmental Protection Agency
(EPA) and National Highway Traffic Safety Administration (NHTSA). There are differences in the values
reported that the reader should be aware of:
o EPA laboratory test value - EPA compiles the fuel economy for individual vehicle models, which are measured in a laboratory using standardized test procedures on a dynamometer.
o EPA adjusted value - EPA adjusts the laboratory values downward to better reflect real-world
driving conditions, and this adjusted MPG appears on the window label of new vehicles to inform consumers. The adjusted value is around 20% lower than the test value.
o NHTSA CAFE value - NHTSA also reports the Corporate Average Fuel Economy (CAFE) for individual manufacturers, which are used to determine compliance with the standards. These are 2-3% higher than the EPA's unadjusted laboratory values due to differences in vehicle classification, test procedure adjustment factors, and alternative fuel credits. In 2009, the CAFE value is 9% higher than the EPA laboratory values, as shown in the following table:
EPA lab test EPA adjusted NHTSA CAFE
2009 average new U.S. 26.4 MPG 21.1 MPG 28.8 MPG
vehicle fuel economyI
e In this study, the fuel economy estimated from vehicle simulations that we ran are based on standard test drive cycles. We prefer to report this as adjusted values, which better reflect real-life driving experience. When discussing meeting the CAFE targets, however, we convert the results from our simulations and calculations to NHTSA's CAFE-equivalents, because we are interested in how the new vehicle fleet is able to meet the target. These values are kept internally consistent, and will be specified each time fuel consumption or fuel economy is mentioned.
However, the opportunity to reduce energy use by vehicle weight reduction is not as straightforward as it seems on three different fronts, leading to interesting research questions. Firstly, the average new
U.S. vehicle weight has been increasing steadily at a rate of 1.2% per annum over the past two decades,
leveling off at around 1,730 kg in recent years (see Figure 1-2). The only occasion in the past where vehicle weight decreased significantly was in the late 1970s in a response to the oil crisis, and the introduction of the CAFE program. Now that fuel economy standards are being raised, one of unknowns regarding passenger vehicle weight in the U.S. concerns this trend: will we witness a reversal of the increasing weight trend, and by how much? How can automakers technically and economically reduce vehicle weight again?
Figure 1-2. Average new U.S. vehicle curb weight, 1975-2009, data source: [2]
2,000 1,800 1,600 no 1,40 1,200 1987-2009 CAG R =+1.2% p.a. .C ', 1,000 -o 800 U 600 400 200 0 1975 1980 1985 1990 1995 2000 2005 2010
Secondly, the topic of vehicle weight reduction should be studied with a life-cycle perspective. That is, one should assess the impacts of reducing vehicle weight over the entire vehicle life cycle, from "cradle to grave". This is because alternative lightweight materials used to reduce vehicle weight tend to be more energy-intensive to produce than conventional steel used in automobiles (see Figure 1-3). An aluminum component with the same stiffness as its steel counterpart requires three times as much energy to produce. An assessment of the energy use through the vehicle's life-cycle from material processing to its end-of-life is thus more complete than examining the use phase of the vehicle alone, and will let us evaluate the net energy benefits of pursuing this strategy. So another set of unanswered questions is: What is life-cycle energy impact, in particular the material production energy impact, of reducing vehicle weight? Could there be some impacts on material recycling associated with the increase of lightweight materials in new vehicles?
Figure 1-3. Material production energy intensity of steel vs. lighter-weight automotive materials, data source: [3] 400 -t 350 - E Virgin Recycled 300 -250 -C 200 -A 150 -100 -tu50 -0
Steel Aluminum Magnesium Glassfiber Carbonfiber composite composite
Thirdly, while the effectiveness of weight reduction in lowering fuel use at a vehicle-level is reasonably well understood, the effectiveness at a vehicle fleet-level is less so. Studying a single vehicle alone will
not allow us to make statements about the impact of weight reduction and efficiency gains on the nation's total energy use in the light-duty vehicle transportation sector. One needs to examine the entire vehicle fleet system as a whole to capture the collective impact of all 250 million vehicles on the road by considering the dynamics of lightweight vehicles entering and older, heavier vehicles exiting the fleet. Having a fleet-system perspective helps automakers and policy decision-makers evaluate the
effectiveness of this weight reduction strategy in reducing the fuel used by the entire vehicle fleet in operation.
1.1 Prior work and this contribution
The objective of this dissertation is to assess the potential energy-saving benefit of vehicle
lightweighting in the U.S. passenger vehicle fleet. We quantify the degree of weight reduction necessary, while considering the cost, impact on material production energy, material recycling, and the feasibility of this fuel-saving opportunity. The key research questions to be answered are:
(i) How much weight reduction is expected in future vehicles in order to meet future fuel economy mandates?
(ii) How can vehicle weight reduction be technically achieved?
(iii) How much does vehicle weight reduction cost, as compared with other fuel-saving vehicle technologies?
(iv) On a vehicle fleet system-level, what are the life-cycle energy impacts of vehicle weight changes?
(v) What are the material recycling implications associated with vehicle weight reduction? There are existing analyses that examine different aspects of this research topic. To assess the degree of future vehicle weight reduction, some have looked at how auto manufacturers could apply various fuel-saving technologies, including weight reduction, to comply with the 2016 CAFE standards. [4, 5] The U.S.
Environmental Protection Agency (EPA) and National Highway Traffic Safety Administration (NHTSA), the government agencies responsible for administering the CAFE program, estimate that the maximum reduction in vehicle weight is 5-10% by year 2014. Similarly, Frost & Sullivan reports that a weight reduction potential of 5-8% would be possible in the short- to medium-term time frame.
Others have assessed the effectiveness of the CAFE program in reducing passenger vehicle fleet fuel use, or the energy impact over the driven, use phase of vehicles. An older 2002 study from the National Research Council estimates that raising fuel economy targets by 20% by 2013 can lead to fuel savings of
10-15 billion gallons in 2015. [6] Morrow et al [7] examined the greenhouse gas (GHG) emissions
reductions arising from a scenario where the fuel economy standard is raised to 43.7 MPG by year 2030. The energy and environmental impact of lighter-weight and other more fuel-efficient vehicles beyond the use phase of the vehicle, such as during the automotive material processing phase, is
understandably not included in these studies, since this is not an intended effect of the vehicle fuel economy policy.
Studies that consider the life-cycle energy or environmental impact of lighter-weight vehicles usually examine this on a single vehicle level only. For example, the steel industry commissioned several life-cycle assessment studies on the use of high-strength steel in car bodies to reduce their weight. [8, 9] Gibson [10] compared the life-cycle environmental impact of using equal-sized vehicle parts made of steel versus aluminum, titanium, and polymer composites. Overly et al [11] carried out a life-cycle energy assessment (LCA) of body closure panels made of different lightweight materials, such as aluminum and carbon fiber-reinforced composites.
Figure 1-4 shows the total life-cycle energy use result reported in the latter study. Given the significant fuel savings accruing over the vehicle's long use phase, these studies generally conclude that it is
beneficial to develop lighter vehicles with greater fuel economy, despite reliance on more energy-intensive materials.
Figure 1-4. Comparing life-cycle energy use in million BTUs when using different materials in a car's body panel [11]
40- EOL [ Fuel Prod, 30 -Fuel Use 20 - E E&NO 10 -0 Steel Alum. CFRP GFRP
MMBTU = million BTUs, Alum. = aluminum, CFRP/GFRP = carbon/glass fiber-reinforced polymer composites,
There are a few vehicle fleet-based life-cycle assessments (LCA) that consider the energy impact of all vehicles within the vehicle fleet, and not just a vehicle-to-vehicle comparison. These studies arrive at the same conclusion as the vehicle-level LCAs, but the added temporal element offers insights on the timing of the expected benefit. Field et al [12] and Das [13] adopt this product system (versus single product)
perspective to conclude that it takes many years for lighter-weight vehicles to penetrate hypothetical vehicle fleets and reduce fleet-level emissions and energy use. So the lightweighting benefit is dampened over time. Researchers from Argonne National Laboratory studied the energy savings
potential of introducing aluminum-intensive vehicles into the actual U.S. vehicle fleet, and arrived at a similar finding - the energy savings potential exist, but will be modest. [14] The Argonne study did not
look beyond the use of aluminum to include the possibility of other lightweight material candidates, however.
This study brings together these separate but connected themes into a broader system perspective, and bridges the gaps in the literature to quantify the system-wide energy impact of vehicle weight reduction in the context of the CAFE program in the U.S.
Table 1-1 shows the landscape of existing literature, and the contribution of this study. By adopting vehicle life-cycle and fleet-level perspectives, we are able to estimate the magnitude and timing of the energy-saving benefits more usefully going into the future. The material production and use-phase energy impacts are both evaluated to understand the effect of weight and material composition changes
in new vehicles entering the fleet each year. Thus this analysis reveals how much, how soon, and how energy savings can be achieved via vehicle lightweighting under the new fuel economy mandate.
Table 1-1. Literature on the life-cycle energy impact of vehicle weight reduction in the U.S.
Life-cycle energy impact ...of vehicle weight ...on a vehicle
assessment... reduction... fleet system level
Study Fuel Impacts from Vehicle Within Vehicle Fleet Study description savings other life-cycle lightweighting CAFE level level
only phases only program
Estimates cost and fuel-saving benefit of individual
NRC 2002 X X X technologies and of meeting
CAFE
Examines fuel use and GHG
Morrow 2010 X X X impact of various policy
options, including CAFE Model to facilitate CAFE
EPA__2010_XXX rulemaking
Assesses changes in vehicles
Knittel 2009 X necessary to meet the 2016
CAFE targets
Gibson 2000
Overly 2002 X X X X Vehicle-level LCA of
Smith 2002 lightweight vehicles
Geyer 2007
Stodolsky 1995 Fleet-level LCA of lightweight
Das 2000 X X X X vehicles
Field 2001
Fleet-level LCA of
This research X X X X X lightweight vehicles in
context of CAFE program
1.2 Research approach
We focus on the light-duty passenger vehicle fleet in the U.S., which consist of 250 million vehicles. The timeframe of analysis is from 1975-2030, with particular interest in exploring ways to reduce energy impact over the next 20 years. A dynamic model of energy and material flows through this fleet is developed, using the following approach:
e Scenario analysis is first used to evaluate the technologies adopted, plausible changes in
vehicle characteristics including weight, and the sales mix necessary to meet mandated fuel economy targets in 2016, as well as a doubling of the fuel economy by 2030.
* Dynamic materialflow analysis is carried out to track the flow and accumulation of
automotive material stocks over time, under the various future vehicle weight and material use scenarios. This is done by modeling the vehicle fleet, accounting for the stock of in-use vehicles and the corresponding material stocks. This analysis can be used to explore the generation of scrap material from this system and implications on metal recycling.
* Temporal life-cycle energy assessment is done to capture the effects of evolving material
and fuel use in the vehicle fleet, while accounting for efficiency improvements in materials processing, and declining vehicle fuel consumption over time.
The key outputs of the model are the material production energy demands and annual fleet fuel use in each scenario, which are the main energy burdens in the vehicle's life cycle. These vehicle production and use-phase energy impacts are both evaluated to better understand the larger system-wide impact of weight and material composition changes in the roughly 15 million new vehicles which enter the fleet each year. The energy associated with producing and distributing the fuel, or "well-to-tank" impacts are not included. So the energy burden of charging plug-in hybrids is not within the scope of this study. Figure 1-5 depicts an overview of the model.
Figure 1-5. Model overview
Vehicle weight, kg * Average vehicle fuel Sales mix - consumption, L/100 km1
Vehicle kilometers Annual fleet fuel use,
traveled, km bil L
Vehicle scrappage, # veh ---- Passenger vehicle stock, #veh Vehicle sales, # veh
Annual material
demand, kg
Vehicle dead gMaterial production
material use, kg/ veh energy demand, EJ
intensity, MJ/kg
This research is relevant in today's carbon-conscious and energy-constrained context. By examining vehicle weight and size reduction in the U.S. over the next two decades, the model developed enables one to (i) compare vehicle weight reduction with other approaches to meet future fuel economy mandates on a common energy-basis, and (ii) explore ways to reduce material production energy consumption by altering material selection or vehicle design choices. It is intended to inform automakers and policymakers and aid decision-making.
The rest of this thesis is organized to take the reader step by step through the intricacies and potential impacts of vehicle weight reduction. Chapter 2 first explains and quantifies the relationship between vehicle weight and fuel consumption. Chapter 3 provides the technical details of how vehicle
lightweighting can be achieved, and considers various lightweight material candidates. In Chapter 4, we explore scenarios of the future U.S. vehicle fleet to understand the role of vehicle weight reduction in the context of more stringent fuel economy standards. Chapter 5 describes a vehicle fleet model to help quantify the fuel savings that can result from the CAFE program, part of which is credited to vehicle
2 These "well-to-tank" impacts have been investigated in two recent studies carried out by our research group at the Sloan Automotive Laboratory. Interested readers should refer to Bandivadekar et al (2008) On the Road in 2035: Reducing Transportation's Petroleum Consumption and GHG Emissions; and Kromer and Heywood (2007) Electric Powertrains: Opportunities and Challenges in the U.S. Light-Duty Vehicle Fleet.
weight reduction. Chapter 6 assesses the cost of vehicle lightweighting, in comparison with other fuel-saving strategies. Chapter 7 looks into the material production energy impact of producing lighter-weight vehicles, and the implications of the changing vehicle's material composition on material recycling. Finally, Chapter 8 summarizes and discusses the findings, and concludes the thesis.
Figure 1-6 is a word cloud of this thesis - a visual depiction of the word content, where the size of the font indicates the frequency and importance of the word. The word cloud illustrates the overall theme of this study, emphasizing weight reduction on the basis of the evolving in-use vehicle fleet system.
Figure 1-6. Word cloud of this thesis, created using Wordle'"
CAFE aluminum
110
-
US
year
II
-U
fuel-efficient
rit" .fltre
high-strengthrW1ee
wteducton
WAW
modelitt
(this page is intentionally left blank)
2 THE RELATIONSHIP BETWEEN
VEHICLE WEIGHT AND FUEL
CONSUMPTION
There are many ways to approach improving vehicle fuel economy. We can define general fuel-saving strategies by examining how the fuel energy is distributed during the vehicle's operation (see Figure 2-1). Vehicle technologies tend to fall into one of following categories:
(i) Improvements in the engine to increase the brake work or usable work output per unit of fuel energy input. Reducing engine friction, or variable valve timing control are examples of these;
(ii) Transmission improvements to increase the efficiency with which power from the engine is transmitted to the driveshaft and to the wheels;
(iii) Minimizing parasitic losses in accessories like the
cooling fan, alternator, and water pump.
Technologies include regenerative battery charging, exhaust heat recovery, and HVAC control;
(iv) Use of alternative, more
fuel-efficient
powertrainslike hybrid electric drives; and finally,
(v) Reducing the driving load by reducing the inertial forces (weight) and resistances (aerodynamic drag, tire rolling resistance) encountered by the vehicle. This reduces the propulsion requirement on the engine and reduces the fuel energy needed to move the vehicle over a given distance.
Vehicle weight and size reduction fall in the final category. To better understand the effect of pursuing a lightweighting strategy on vehicle fuel consumption, let us first understand the physics of weight and size reduction.
Chapter 2 describes the allure of
vehicle weight reduction - its
potential to reduce fuel consumption. We quantify the vehicle weight-fuel consumption relationship by exploring the physics of vehicle weight and size reduction, examining empirical data, reviewing the literature, and running vehicle simulations.
Figure 2-1. Distribution of fuel energy in a vehicle [15]
2# Engine
Heat
Engine
1% Mechanical
Heat in exhaust gateS
Het to coolant
Heat to air {radiption)
Pumping work Drawing in air;
expelling exhaust Overcoming friction
in pistons and piston rings; valve train; bearings; etc. Operating accessaries
Cooling fan; fuel, oil, coolant, and power steering pumps; etc.
Drive Train Mechanical Overcoming friction in transmission. dIfferental. and wheel bearings Coasting and Idle work Braking work 12% Energy at Wheels Overcoming: Inertle Rolling resistance Air resIstence Gravity Iclimbing grades)
2.1 The physics of vehicle weight reduction
3it is well known that vehicle weight reduction has the potential to reduce fuel consumption. By reducing the mass of the vehicle, the inertial forces that the engine has to overcome as the vehicle is accelerated are reduced, so the work required to move the vehicle is thus lessened. To understand the physical impact of vehicle weight on fuel consumption, we examine the key parameters that contribute to a vehicle's fuel consumption from the following relation [16]:
b, - Pdt fb,.i-V t
FC - - d
fvdt fvdt
Vehicle's fuel consumption Engine's specific fuel consumption Engine power output
Time
Instantaneous vehicle speed Tractive force Drivetrain efficiency [L/km]
[L/kWh]
[kW] [s or hr] [m/s or km/hr] [kN]3 I am using the terms weight and mass interchangeably here. Although technically, I should be refering to vehicle mass, as measured in kilograms, throughout this thesis.
Gasoline energy content (Moat conto n I
Where
For a vehicle's given speed-time trace, or drive cycle, assuming that the engine's specific fuel
consumption and efficiency as a function of load and speed are known, the key parameter that affects the amount of energy output needed from the engine is the amount of tractive or resistive forces the vehicle has to overcome. The tractive force is the sum of tire rolling resistance, acceleration or braking resistance, aerodynamic drag and climbing resistance. For an accelerating vehicle on a level road (with zero climbing resistance), as shown in Figure 2-2, the total tractive force is:
RO
=FR +Fcc +FDRAG (fD A *vg 2
Where FROLL = Rolling resistance [N]
FACC = Acceleration resistance [N]
FDRAG = Aerodynamic drag [N]
f = Rolling resistance coefficient
m = Vehicle plus payload mass [kg]
g = Gravitational acceleration [m/s2
]
a = Vehicle acceleration [m/s2
]
CD = Drag coefficient
PAIR Air density [kg/i 3]
A = Vehicle frontal area [M2]
v = Instantaneous vehicle speed [m/s]
From this equation, we see how reducing vehicle's mass has a direct impact on reducing the total tractive force and thus the fuel consumption, since mass appears in both the rolling and acceleration components of the total resistive force.
Figure 2-2. Forces on an accelerating vehicle on a level road
Acceleration, a
44-FDRAG
2.2 The physics of vehicle size reduction
Vehicle downsizing impacts fuel consumption by (i) reducing the frontal area, which lowers aerodynamic drag; and by (ii) reducing vehicle mass. The National Research Council reports that a 5-10% reduction in the coefficient of drag (CD) can reduce fuel consumption by 1-2%. A 10% weight reduction is expected to
improve it by 6-7%. [17] However, the two effects are interrelated since frontal area reduction could result in some weight reduction as well. To understand the relative and combined contribution of these two effects, it helps to interpret the effect of frontal area reduction in the form of mass reduction.
First, let us assume a constant effective vehicle "density" (Pveh), and that the vehicle's mass decreases proportionately with its size or volume (V). The vehicle's frontal area scales approximately as L2, where L is a characteristic vehicle length, and its volume can be characterized by L3. The frontal area can then be
expressed as being proportional to the volume to the % power. Since mass and volume are proportional, the frontal area is hence proportional to the mass to the % power. This simplification is summarized by the following symbolic relations:
p,,M = m x V
A L2
V =L= A32 z A V213
- A oc m2t 3
Substituting this into the tractive force equation above, the total tractive force then becomes:
F,
= (fg +a)m+ CD PAIR 2 2/3 m +k2 .M2
/3
where k, ki and k2 are constants at constant acceleration and velocity. The first term (ki.m) is the sum of
the rolling and acceleration resistance, while the second term (k2.m2/3) is the aerodynamic drag. Substituting typical values for k, and k., the relationship between the tractive force and vehicle mass is
illustrated in Figure 2-3. For these conditions, we see from this figure that the contribution of frontal area reduction on total tractive force, when expressed as a mass factor, is about 25-35% of the total tractive force. Since tractive force is the key parameter that affects vehicle fuel consumption, the impact
of frontal area reduction on fuel consumption would be similar. Most of the fuel consumption benefit from downsizing can therefore be attributed to mass reduction that accompanies it.
The earlier tractive force equation hinted at this result as well. Reducing vehicle mass will have a more direct impact on fuel consumption, since mass appears in both the rolling and acceleration components of the total resistive force. Aerodynamic drag does not dominate the vehicle's work requirements, except when the vehicle is traveling at high speeds, since drag varies with the square of the vehicle's velocity. However, even when one traces the resistive work distribution over the U.S highway driving cycle, where the vehicle is traveling at high average speed (48 mph), drag still accounts for less than half of the work (Figure 2-4). So, reducing aerodynamic drag will have relatively less impact on reducing fuel consumption than reducing weight.
In sum, vehicle size reduction improves fuel consumption mainly by reducing its mass. By examining the key factors that affect the work performed by a vehicle, it is observed that the impact of frontal area reduction is smaller, compared to the accompanying mass reduction that results from vehicle downsizing. It is hence more important to use weight reduction to justify the benefits of downsizing.
Figure 2-3. The relationship between vehicle mass and tractive force
-Total tractive force, Ft
- Rolling and inertia resistance, k1.m Aero drag, k2.mA2/3
Assumed values used:
f = 0.012 CD g = 9.81 m/s2 PAIR
a
= 0.89 m/s2 V k,= 1 k k2= 0.25 1.1 kg/m 3 60mph = 27m/s PVEH-2/3 = 0.05 4.5 500 1,000 1,500 2,000 2,500 3,000 Vehicle mass (kg)Figure 2-4. Work distribution for a compact car in different drive cycles, data source: [18]
N Drag Rolling U Acceleration
Combined US-Highway US-City 0% 20% 40% 60% 80% 100% 4,500 4,000 3,500 3,000 2,500 2,000 1,500 1,000 500 0 -- -. ... .. ... .... .. ... ... . ... ...
2.3 Empirical data
To explore the effect of vehicle weight reduction on its fuel consumption for new vehicles being sold and driven in the U.S., one can also analyze empirical data. Figure 2-5 shows a plot of the (EPA adjusted) fuel consumption4 and corresponding curb weights of all model year 2006-2008 light-duty vehicles offered in the U.S., revealing a linear positive correlation among these two variables. This data is obtained from Ward's Automotive [19]. On average across all vehicle models, every 100 kg weight reduction will achieve a reduction of 0.53 L/100 km in fuel consumption. While this figure is useful to detect a general trend, such data is not normalized for performance, size, or other vehicle attributes.
Figure 2-5. Curb weight and fuel consumption of U.S. MY2006-2008 vehicles, data source: [19]
500 1,000 1,500 2,000 2,500
Curb weight, m (kg)
3,000 3,500
To segment the data by powertrain, vehicle type and performance, a subset of the data is plotted - only gasoline cars that accelerate from zero to 60 miles per hour (mph) in around 9.5 seconds. This is the time the average new car sold in 2008 takes to accelerate from zero to 60 mph. The vehicle's
acceleration time is estimated from their reported horsepower, using the following relationship [21: t = 0.892*(hp/lb)-0 805
t = 0.967*(hp/lb)0775
for vehicles with automatic transmission for vehicles with manual transmission
= Time taken to accelerate from 0-60mph = The vehicle's maximum horsepower = The vehicle's inertia weight in pounds
4 See detailed notes on page 14.
FC = 0.0053m + 2.0081
R2=0.7469
Where [sec]
[hp]
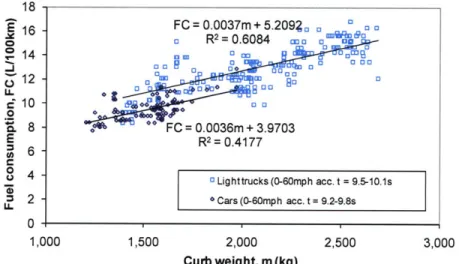
In 2006-2008, there were 146 car models that fit in this specific category, i.e. accelerate from zero to 60 mph in 9.5±0.3 seconds. Doing the same for light trucks, we stratify the data and identify gasoline light trucks that have the current sales-weighted average 0-60 mph time of around 9.8 seconds, and find 382 data points in this light truck category. The plots of (EPA adjusted) fuel consumption versus curb weight of these representative gasoline cars and light truck are shown in Figure 2-6 below. For both cars and
light trucks of similar acceleration performance, every 100 kg vehicle weight reduction will yield a 0.4 L/100 km decrease in fuel consumption. In percentage terms, every 10% reduction in vehicle weight, cars will consume 5.6% less fuel, and light trucks will consume 6.3% less fuel.
Figure 2-6. Curb weight and fuel consumption of select MY2006-2008 U.S. gasoline cars and pickups
18 16 FC =0.0037m+ 5.2092
a
0 0 " 13 a R2= 0.6084
aM 0"0 "o a S14 - 0 UD 3 01 C 00 8130 .*00 OD EL 8 FC =0.0036m + 3.9703~
6R 2=0.4177
0, 4 E3 Light trucks (0-60mph acc. t = 9.5-10.1s
2 * Cars (0-60mph acc. t = 9.2-9.8s
LL _ _ _ _ _ _ _ _ _ _ _ _ _
0
1,000 1,500 2,000 2,500 3,000
2.4 Results from the literature
There are several studies that attempt to quantify the vehicle fuel consumption reduction benefit associated with lightweighting. For vehicles using conventional gasoline-fueled internal combustion
engines (ICE), a summary of the results from literature is shown in Table 2-1. The reported improvement in fuel consumption varies widely from 1.9-8.2% for every 10% reduction in vehicle weight. The average of these numbers, which has no inherent validity, gives 4.9%. Factors that affect this relationship include the size and type of vehicle, the drive cycle used to evaluate the vehicle (e.g. city, highway, or combined) and whether or not the powertrains were resized to maintain vehicle performance (i.e., secondary weight savings included or excluded, see Section 3.3).
Table 2-1. Mass-fuel consumption relationship for gasoline vehicles from literature
Small car 2.6% No NEDC [20]
Small car 3.5% No 43/57 city/hwy [21]
Small car 4.7% No 55/45 city/hwy [22]
Small car 5.3% Yes 43/57 city/hwy [21]
Small car 6.8% Yes NEDC [20]
Midsize car 1.9% No NEDC [20]
Midsize car 2.5% No 43/57 city/hwy [21]
Midsize car 4.1% No 55/45 city/hwy [22]
Midsize car 5.6% Yes 43/57 city/hwy [21]
Midsize car 7.0% Yes 55/45 city/hwy [22]
Midsize car 6 to 8% (not specified) (not specified) [6]
Midsize car 8.0% Yes 55/45 city/hwy [23]
Midsize car 8.2% Yes NEDC [20]
Small SUV 3.1% No 43/57 city/hwy [21]
Small SUV 5.2% Yes 43/57 city/hwy [21]
Small SUV 7.9% Yes 55/45 city/hwy [23]
Midsize SUV 2.4% No NEDC [20]
Midsize sUv 7.4% Yes NEDC [20]
Large SUV 2.5% No 43/57 city/hwy [21]
Large SUV 5.2% Yes 43/57 city/hwy [21]
Large pickup 2.7% No 43/57 city/hwy [21]
Large pickup 3.7% Yes 43/57 city/hwy [21]
s NEDC is the New European Driving Cycle, which is supposed to represent the typical usage of a car in Europe. 43/57 and 55/45
city/hwy drive cycles are used by the U.S. EPA that combine city and highway drive cycles. These cycles are based on the standardized Federal Test Procedure (FTP) and Highway Fuel Economy Driving Schedule (HWFET). They are calculated using an
2.5 Vehicle simulation
We now compare the results reported in the literature and from the regression analysis with that from vehicle simulations using AVL@ ADVISOR vehicle simulation software. For any predefined vehicle model, ADVISOR calculates the torque, speed, and power passing through different vehicle components, and predicts the vehicle's fuel consumption and acceleration performance over a prescribed speed-time trace. To simplify, we use the best-selling midsize sedan and pickup models in the U.S. -the model year
2005 gasoline Toyota Camry and the gasoline Ford F-150 - to represent a current average car and an
average light truck. The drive cycles used are the standard U.S. Federal Test Procedure (FTP) and Highway Fuel Economy Driving Schedule (HWFET) to represent city and highway driving.
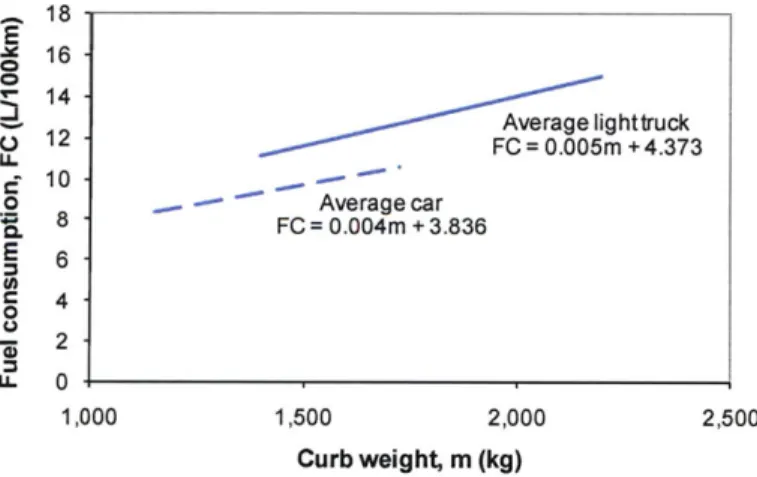
The simulations reveal that while leaving vehicle acceleration performance and size unchanged, for every 100 kg weight reduction, the adjusted (or "real world"), combined city/highway fuel consumption can decrease by 0.39 L/100 km for cars, and 0.48 L/100 km for light trucks in the U.S. (see Figure 2-7). In other words, for every 10% weight reduction from the average new car or light truck's weight, the vehicle's fuel consumption reduces by 6.9% and 7.6% respectively.
Simulations were likewise carried out on representative vehicle models of the future, which embody expected improvements in engine efficiency and reductions in aerodynamic drag and rolling resistance that may be achieved within the next two decades. For the "future" Camry and F-150, their fuel consumption decreases by 0.30 L/100 km and 0.35 L/100 km for every 100 kg weight reduction respectively.
Figure 2-7. Simulation results - Curb weight-fuel consumption relationship for today's vehicles
18 E 16 14 Average lighttruck 12 FC =0.005m + 4.373 U-d 10 o Average car % 8 FC= 0.004m + 3.836 6 C4 0 .2 U- 0 1,000 1,500 2,000 2,500 Curb weight, m (kg) ... ...
2.6 Chapter summary
To determine the effect of vehicle weight reduction on its fuel consumption, results from a literature review, empirical data, and engineering simulation have been reviewed and reported. The results are summarized in Table 2-2 below for a conventional gasoline-fueled midsize car only, assuming that the engine is resized to maintain vehicle performance. The relationship is observed to be fairly consistent across all three approaches. Results from literature sources and empirical data analysis appear to validate the "10-7" results from the engineering simulation carried out. That is, a 10% reduction in vehicle weight will reduce fuel consumption by about 7%. In absolute terms, every 100 kg weight
reduction will yield a 0.39 L/100 km reduction in (EPA adjusted) fuel consumption for the current average gasoline car in the U.S. This simulation results will be used to quantify the sensitivity between vehicle weight and its fuel consumption in our model. The assumed relationship for current and future vehicles, including cars and light trucks, used in the models subsequently described in this thesis are shown in Table 2-3 below.
Table 2-2. Fuel consumption (FC)-curb weight relationship for a current conventional gasoline midsize car
Approach FC reduction per 10% mass FC reduction per 100 kg mass
reduction reduction
Literature review 5.6-8.2% 0.36-0.58 L/100 km
Empirical data (MY2006-08) 5.6% 0.36 L/100 km
Engineering simulation (ADVISOR) 6.9% 0.39 L/100 km
Table 2-3. Assumed vehicle fuel consumption sensitivities to weight reduction for various vehicles
Fuel consumption reduction Gasoline vehicle per 100 kg mass reduction (L/100 km)
Current Future (2030)
Average car 0.39 0.30
3 HOW TO REDUCE VEHICLE WEIGHT,
AND ITS COST
Reductions in vehicle weight can be achieved by a
combination of (i) material substitution; (ii) vehicle redesign; and (iii) vehicle downsizing. Material substitution involves replacing heavier iron and steel used in vehicles with weight-saving materials like aluminum, magnesium, high-strength steel, and plastics and polymer composites. Vehicles can be redesigned to optimize the size of the engine and other components as vehicle weight decreases, or to improve the vehicle's packaging and reduce exterior vehicle dimensions while maintaining the same passenger and cargo space. Finally, downsizing can provide further weight reduction by shifting sales away from larger and
heavier to smaller and lighter vehicle categories. The following sections will first describe weight and material
breakdown of the current average U.S. vehicle to provide context, explain each of these three approaches in detail, and finally review the cost associated with vehicle weight
reduction.
3.1 Current U.S. vehicle weight
characteristics
The average new light-duty passenger vehicle sold in the
U.S. weighs 1,730 kg in 2009. 80% of this weight is
incorporated in its powertrain, chassis, and body (see Figure
3-1). The bulk of which are made of ferrous metals. Other
major materials found in an average automobile in the United States include aluminum and plastics or composites, as shown in Figure 3-2. This figure also shows how the use of aluminum and high-strength steel (HSS) as a percentage of total vehicle mass has been increasing over the past two
decades, while the use of iron and other types of steel has been declining. Despite greater use of these lightweight materials, however, the average new vehicle weight has in fact increased over time. So use of these materials has
helped to curb further increase in vehicle weights due to the introduction of various weight-adding features and a stronger preference for larger-sized vehicles.
Chapter 3 provides a technical assessment of the vehicle weight
reduction opportunity, as well as a review of how much it will cost. How can vehicle weight reduction be achieved? Through substituting iron and steel with lightweight
alternatives like aluminum and high-strength steel, redesigning the
vehicle, and vehicle downsizing. Findings from various lightweight concept vehicle projects, as well as cost estimates in the literature, are summarized.
Figure 3-1. Vehicle mass distribution by subsystem, data source: [24]
Electrical systems, 5%
C h a s sir s
o , , 2 4 9 5 d v ,4
Figure 3-2. Material composition of the average automobile in the U.S., data source: Ward's via [1]
100%
-90%
80% Other
0%
70% Plastics and composites
8 60% Aluminum -50% - High-strength steel
3
40%> E Other steel 30% 0 Iron 20%4
10% 0% 1977 1987 1995 20073.2 Material substitution
Aluminum and high-strength steel are two of several alternative lightweight materials that can be used to replace substantial amounts of heavier steel and iron in the vehicle. Other lightweight material candidates which are less dense still, or higher-strength, include magnesium and polymer composites such as glass- and carbon-fiber-reinforced thermosets and thermoplastics. Comparative properties of these materials are summarized in Table 3-1 below, and the prospects of each will be discussed in turn. Less common lightweight materials like metal matrix composites and titanium have been omitted due to their high costs, which limit their application within the vehicle. The cost of weight reduction will be reviewed later in this chapter.
![Figure 2-5. Curb weight and fuel consumption of U.S. MY2006-2008 vehicles, data source: [19]](https://thumb-eu.123doks.com/thumbv2/123doknet/14202468.480226/28.918.242.681.405.674/figure-curb-weight-fuel-consumption-vehicles-data-source.webp)
![Figure 3-2. Material composition of the average automobile in the U.S., data source: Ward's via [1]](https://thumb-eu.123doks.com/thumbv2/123doknet/14202468.480226/34.918.258.693.516.783/figure-material-composition-average-automobile-data-source-ward.webp)