by
Lawrence Baker
MEng,
Cambridge University (2014)
Submitted to the Institute for Data, Systems, and Society
in partial fulfillment of the requirements for the degree of
Master of Science in Technology and Policy
at the
MASSACHUSETTS INSTITUTE OF TECHNOLOGY
September 2019
© Massachusetts Institute of Technology 2019. All rights reserved.
Author
Technology and Policy Program
July 15, 2019
Certified by
Leo Anthony Celi
Principal Research Scientist, Institute for Medical Engineering & Science
Clinical Research Director, Laboratory for Computational Physiology
Thesis Supervisor
Certified by
Stan Finkelstein
Senior Research Scientist, Engineering Systems
Thesis Supervisor
Accepted by
Noelle Selin
Director, Technology and Policy Program
Associate Professor, Institute for Data, Systems, and Society and Department of
Earth, Atmospheric and Planetary Sciences
Lawrence Baker
Submitted to the Institute for Data, Systems, and Society on July 15, 2019, in partial fulfillment of the
requirements for the degree of Master of Science in Technology and Policy
Abstract
Patients in intensive care routinely have their blood glucose monitored and controlled using insulin. Two decades of on-going research has attempted to establish optimal glucose targets and treatment policy for patients with hyperglycemia in the intensive care unit (ICU). These efforts rely on the assumption that health care providers can reliably meet given targets. Significant proportions of the ICU population are either hypoglycemic or hyperglycemic and poor blood glucose control may lead to adverse patient outcomes. This thesis analyses approximately 20,000 ICU stays at the Beth Israel Deaconess Medical Center (BIDMC) which occurred between 2008 and 2012. These data are used to describe the state of clinical practice in the ICU and identify areas where treatment may be sub-optimal.
Even at a world-renowned teaching hospital, blood sugars are not optimally managed. 41.8% of diabetics and 14.2% of non-diabetics are severely hyperglycemic (>215mg/dL) each day. Insulin bo-luses are given more frequently than insulin infusions, despite guidelines recommending infusions for most critical care patients. When infusions are given, rates do not follow a consistent set of rules. Blood sugar management faces several challenges, including unreliable readings. Labora-tory and fingerstick measurements that were taken at the same time had an R2 of only 0.63 and the fingerstick measurements read on average 10mg/dL higher. Overcoming these challenges is an important part of improving care in the ICU. It is hoped that publicly sharing the code used to extract and clean data used for analysis will encourage further research. Code can be found at https://github.com/lawbaker/MIMIC-Glucose-Management
Thesis Supervisor: Leo Anthony Celi
Title: Principal Research Scientist, Institute for Medical Engineering & Science Clinical Research Director, Laboratory for Computational Physiology
Thesis Supervisor: Stan Finkelstein
Title: Senior Research Scientist, Engineering Systems
This thesis could not have been written without a great deal of help and expertise from others. The biggest thank you to my two co-advisers, Stan and Leo. Stan Finkelstein was the genesis of this project. When I came to him looking for a data analysis project, he introduced me to the institute for Medical Engineering and Science (IMES) and acted as a bridge between departments.
This thesis is a tiny part of the vast enterprise that Leo Celi is assembling to glean insights from MIMIC and propel us towards evidence-based medicine in critical care. The original idea, studying glucose control in the ICU, is his. There appears to be no queries that cannot be answered either by his own expertise or his huge personal and professional network. I’d like to thank him most for stopping me from taking on more work than I needed to - there is a whole PhD in exploring this data further. Aldo Arévalo started investigating glucose in the ICU before me and is carrying on after, I’m excited to see what he comes up with as he digs deeper. When I was utterly lost in SQL queries, he navigated me through the maze. Aldo also came up with the original idea and algorithm to link inputs with glucose measurements, which is the basis of much of this thesis.
I am a neophyte to both medicine and data science; I could not have written this thesis without a great deal of advice from practitioners, and any veneer of expertise belongs to them. Francis DeMichele repeatedly checked that the data corroborated with his experience and helped define exclusion criteria when we found suspicious results. He patiently explained illustrated how glucose control fits within the wider context critical care, including all of the other tasks medical staff must juggle. Roselyn Mateo, an endocrinologist at BIDMC, took time out of her busy schedule to describe how insulin dosing decisions are made and which guidelines are followed. A big thank you to Alistair Johnson and the rest of IMES for listening to presentations of half-complete work and pointing me in the right direction. It was a pleasure to present to Finale Doshi-Velez and her research group and hear their opinions on what could be done with the data extracted in the course of this thesis.
Finally, I’d like to thank my parents and Katherine Freitas for their patience, completing the arduous work of proofing, and teaching me about the Oxford comma.
List of Figures 9
List of Tables 13
1 Introduction 15
2 Literature Review 19
2.1 Blood glucose targets and mortality in the ICU . . . 19
2.1.1 Randomised controlled studies . . . 20
2.1.2 Retrospective and observational studies . . . 22
2.2 Computer aided glucose management algorithms . . . 24
2.3 Glucose management in clinical practice . . . 26
3 Data Extraction 29 3.1 Data source . . . 29
3.1.1 Cohort definition . . . 31
3.2 Generating extracted tables and data cleaning . . . 33
3.2.1 Glucose measurements . . . 34
3.2.2 Insulin inputs . . . 37
3.2.3 Dextrose inputs . . . 40
3.2.4 Nutrition inputs . . . 43
3.2.5 Extracted table summary . . . 46
4 Data Analysis 47 4.1 Cohort statistics . . . 47
4.2 Individual ICU stays . . . 49
4.2.1 Individual examples of blood glucose management . . . 51
4.3 Glucose measurements . . . 54
4.4 Insulin inputs . . . 57
4.4.1 Insulin boluses . . . 59
4.4.2 Insulin infusions . . . 61
4.4.3 Matched glucose measurements and insulin inputs . . . 62
4.4.4 Comparing insulin infusions and boluses . . . 69
4.4.5 Infusion guidelines . . . 76
4.5 Dextrose inputs . . . 84
4.6 Feeding inputs . . . 87
4.7 Mortality . . . 88
4.8 Glucose measurement accuracy . . . 91
4.8.1 Measurement comparison studies . . . 91
4.8.2 Exact measurement matching . . . 92
4.8.3 Approximate measurement matching . . . 96
4.8.4 Limitations . . . 101 5 Discussion 103 5.1 Summary of findings . . . 103 5.2 Policy interventions . . . 106 5.3 Limitations . . . 107 5.4 Future work . . . 108 6 Conclusion 111
A Appendix: Enteral and Parenteral Feeding IDs 113 B Appendix: Approximately Matched Glucose Measurement Plots 117
3-1 Study cohort exclusions . . . 32
3-2 Glucose measurement exclusions . . . 36
3-3 Insulin input exclusions . . . 39
3-4 Dextrose input exclusions . . . 42
3-5 Nutritional input exclusions . . . 45
4-1 Distributions of cohort stay length, age and weight . . . 49
4-2 ICU stay 201357 - Insulin boluses used to manage blood glucose level . . . 51
4-3 ICU stay 200383 - 50% concentration dextrose as a rescue medication . . . 52
4-4 ICU stay 203143 - Large oscillations in glucose level . . . 53
4-5 ICU stay 201705 - Improved control using insulin pump . . . 54
4-6 Distribution of glucose measurement frequency . . . 55
4-7 Daily average glucose levels for diabetics and non-diabetics . . . 56
4-8 Daily minimum and maximum glucose levels for diabetics and non-diabetics . . . 56
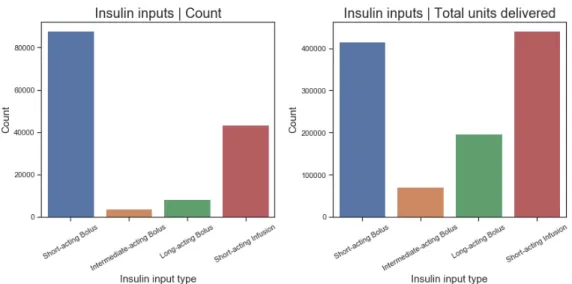
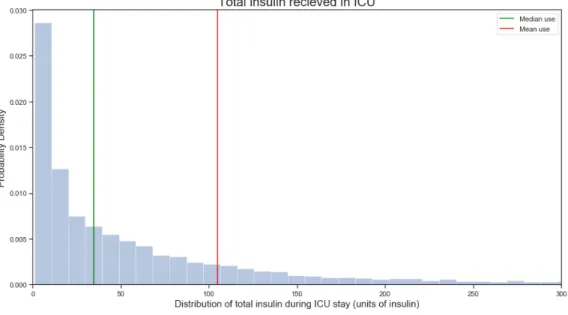
4-9 Daily hyperglycemic and hypoglycemic episodes among patients with ICU stay >7 days 58 4-10 Total input count and units delivered for each insulin input type . . . 59
4-11 Distribution of total insulin use over each ICU stay . . . 60
4-12 Distribution of insulin units in boluses, split by insulin type . . . 60
4-13 Distribution of short-acting insulin bolus frequency . . . 61
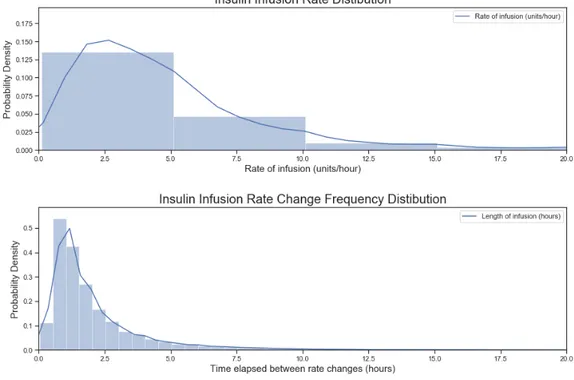
4-14 Distributions of the frequency of infusion rate changes and the rate of insulin infusion . 62 4-15 Distribution of the time gaps between matched glucose measurement and short-acting insulin boluses . . . 64
4-16 Heat map of glucose level and short-acting bolus dose . . . 65
4-17 Heat maps of glucose level and short-acting bolus dose for all patients, diabetics, and non-diabetics . . . 66
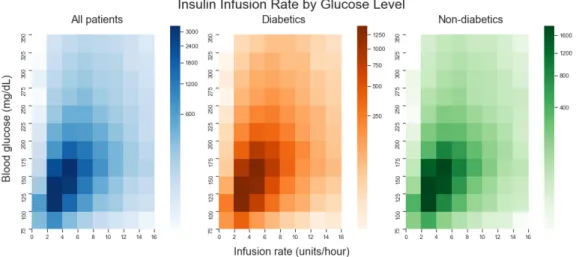
4-18 Heat maps of short-acting bolus dose conditioned on glucose level for all patients, dia-betics, and non-diabetics . . . 67 4-19 Heat maps of glucose level and insulin infusion rates for all patients, diabetics and
non-diabetics . . . 68 4-20 Heat maps of insulin infusion rate conditioned on glucose level for all patients, diabetics,
and non-diabetics . . . 68 4-21 ICU stay 200489 - Proactive infusion . . . 70 4-22 Distributions of length of stay before first insulin infusion and length of first insulin infusion 71 4-23 Proportion of patients given an infusion in each care unit . . . 72 4-24 Distributions of average blood glucose for two-hourly periods before and after first insulin
infusion . . . 73 4-25 Distribution of average blood sugar 2 hours before and 12 hours after receiving an insulin
infusion . . . 74 4-26 Distributions of minimum blood glucose for two-hourly periods before and after first
insulin infusion . . . 75 4-27 Joslin Diabetes Centre infusion algorithm for diabetic critically ill intraoperative and
medical ICU patients (Joslin Diabetes Center, 2009) . . . 77 4-28 Bland-Altman plot comparing recommended and observed insulin infusion rates . . . . 78 4-29 Bland-Altman plot comparing recommended and observed insulin infusion rates against
blood glucose . . . 79 4-30 ICU stay 206662 - High rate insulin infusions (first two and half days of stay are shown) 80 4-31 Distributions for the frequency of infusion rate changes and the rate of dextrose infusions 85 4-32 Distributions of glucose measurements for different concentrations of dextrose boluses . 86 4-33 Heat map of glucose level and dextrose infusion rate for both 5% and 50% concentration
solutions . . . 87 4-34 Distributions of nutritional input rate change frequency and delivery rate . . . 88 4-35 Daily average glucose levels split by in-hospital mortality . . . 89 4-36 K-means clusters of glucose time series for patients with stays >7 days in length . . . . 90 4-37 Distributions of concurrent laboratory and fingerstick glucose measurements and the
difference between them . . . 93 4-38 Bland-Altman plot comparing concurrent laboratory and fingerstick glucose values . . 94 4-39 Clarke Error Grid for concurrent laboratory and fingerstick glucose values . . . 96 4-40 Distributions of approximately matched laboratory and fingerstick glucose measurements
and the difference between them . . . 97 4-41 Bland-Altman plot comparing difference in approximately matched laboratory and
4-42 Bland-Altman plot comparing difference in approximately matched laboratory and fin-gerstick glucose values with pH . . . 100 4-43 Bland-Altman plot comparing difference in approximately matched laboratory and
fin-gerstick glucose values with oxygen saturation . . . 100 4-44 Bland-Altman plot comparing difference in approximately matched laboratory and
fin-gerstick glucose values with SOFA score . . . 101 B-1 Bland-Altman plot comparing approximately matched laboratory and fingerstick glucose
values . . . 117 B-2 Distributions of approximately matched laboratory and fingerstick glucose measurements
and the difference between them . . . 118 B-3 Clarke Error Grid for approximately matched laboratory and fingerstick glucose values 119
3.1 MIMIC tables used for data extraction . . . 30
3.2 IDs used for extraction of glucose measurements . . . 34
3.3 IDs used for extraction of insulin inputs . . . 37
3.4 IDs used for extraction of dextrose inputs . . . 40
3.5 Summary of extracted table size before and after data cleaning . . . 46
4.1 Population statistics for the analysis cohort . . . 48
4.2 Accuracy scores for decision tree models of recommended and observed infusion rates . 82 4.3 Statistics describing the distributions of matched concurrent laboratory and fingerstick glucose measurements . . . 94
4.4 Statistics describing the distributions of concurrent and approximately matched labora-tory and fingerstick glucose measurements . . . 98
A.1 IDs used for extraction of nutrition inputs . . . 116
Introduction
Management of blood glucose is a critically important aspect of care in the intensive care unit (ICU). While randomised clinical trials have attempted to identify how blood sugars should be controlled, clinical practice remains understudied. This thesis uses the MIMIC database, which contains over 60,000 ICU stays from Beth Israel Deaconess Medical Center (BIDMIC) (Pollard and Johnson, 2016), to describe current clinical practice, understand if more complex management is feasible, and recommend improvements.
Both hyperglycemia (abnormally high blood sugars) and hypoglycemia (abnormally low blood sugars) are common in intensive care. While the management of blood sugars for diabetics has been common-place for a century, the issue of hyperglycemia in the ICU has only relatively recently received attention (Sinding, 2002). The first randomised trial to investigate whether patients receive more benefit from intensive glycemic control or conventional control in the surgical ICU was conducted in 2001. It found a decrease in mortality of over 30% in the intensive arm (Van den Berghe et al., 2001). This finding sparked a series of studies attempting to replicate the result and extend it to other populations, such as medical ICU patients or children. Most trials found that there was little mortality difference between the two treatment policies, or that intensive control was harmful, due to an increased risk of hypoglycemia (Griesdale et al., 2009). The largest and most robustly designed trial to date, known as NICE SUGAR, found no clear benefit to intensive control (The NICE-SUGAR Study Investigators, 2009).
It is difficult to study the relationship between critical illness and hyperglycemia outside of a ran-domised controlled trial (RCT). This due to bi-directional causality: patients with high blood sugar have worse outcomes and patients who are more critically ill have higher blood sugar levels due to stress hyperglycemia. However, RCTs do have drawbacks. Prospective trials are usually only powered to detect the average treatment effect between two arms, due to the considerable expense for each patient
included in the trial. The average treatment effect can obscure variation in optimal targets and treat-ment regimens between patients (for instance, examining how patients with different diseases respond to hyperglycemia). In a condition as complex as hypoglycemia and a population as heterogeneous as intensive care patients, this leaves critical questions unanswered.
Trials must also make assumptions about which interventions to compare, which sometimes leads to disagreement in designs and targets (Van den Berghe et al., 2009). Moreover, these targets are often based on euglycemia defined in a healthy population, which may not be the most appropriate goal for critically ill patients. Stress hyperglycemia may be an adaptive response to aid recovery, so attempting to enforce euglycemia on critically ill patients could be harmful (Marik and Bellomo, 2013). Finally, some areas cannot be investigated using RCTs for ethical reasons. For instance, glycemic variability may be a predictor of mortality, but it is unethical to randomise patients to an arm which increases their probability of highly variable blood sugar, because this is expected to harm them.
Retrospective studies solve some of these problems. Retrospective data is increasingly being captured and made available through initiatives such as the Phillips eICU database, which contains over 200,000 visits (Pollard et al., 2018). Improved data availability means that sample sizes can often be large enough to differentiate effects between subgroups. Once data collection infrastructure has been established, the marginal cost of adding another patient to the database is close to zero. Retrospective analyses make use of existing natural variations between patients and treatment centres to ethically study differences in treatment policies without making assumptions about which policy is optimal. Observational and retrospective studies suffer from confounding, but this can increasingly be adjusted for. As ICU databases become more complex and collect more data, the sources of unobserved confounding decrease. As more variables are observed, unobserved confounding decreases. Machine learning methods, such as reinforcement learning, can account for time-varying confounding and are well suited to establishing optimal treatment policies and have already been used to investigate sepsis treatment in the ICU (Komorowski, Celi, Badawi, Gordon, and Faisal, 2018). This is not to argue that retrospective analysis will replace randomised trials. New research always needs to be verified in a prospective setting and data collection will never fully account for all confounding. Some confounding factors, such as emotional state, are unlikely to ever be observable, but new RCTs can be made more efficient if they are guided by retrospective research.
Personalised blood glucose targets will only improve patient care if hospitals have both the means and the motivation to meet them. If ICUs are unable to meet the relatively simple and lenient target of keeping patients’ blood sugar <180mg/dL, then there is little hope that providers will be able to meet more heterogeneous and stringent targets without causing increased rates of hypoglycemia. Technology may provide a solution to poor control via closed loop glucose controllers which use continuous glucose monitoring, but these technologies have yet to be validated outside of a trial setting and would require significant investment that many ICUs may be unable to make, particularly outside of the US (Chase,
Benyo, and Desaive, 2019).
This thesis seeks to compliment the advances in technology, clinical trials and machine learning with a data-driven overview of clinical practice. Understanding how ICUs operate will enable more targeted improvement and identify a baseline from which to judge new innovations.
Literature Review
2.1
Blood glucose targets and mortality in the ICU
While the management of blood sugars in diabetic patients has been commonplace since the 1920s (Sinding, 2002), glucose management in the ICU is a relatively recent phenomenon. Elevated blood sugar in the ICU is frequently not a result of underlying diabetes mellitus, but is instead caused by an altered metabolic state marked by increased glucose production, insulin resistance, and depressed glycogenesis (Mizock, 1995). Known as stress hyperglycemia, this state is common in intensive care, particularly in patients with sepsis, burns, or who are post-operative (Shangraw et al., 1989). The benefits of insulin to treat hyperglycemia in diabetics have long been known, but before the turn of the millennium, there was scant evidence on the clinical benefit of insulin treatment in the ICU (McCowen, Malhotra, and Bistrian, 2001). Diabetes mellitus and stress hyperglycemia are fundamentally different conditions which present in different populations over different timescales and therefore may require different treatments. Stress hyperglycemia may even be a useful compensatory response by the body to promote healing and recovery (Marik and Bellomo, 2013). There is bidirectional causality between health outcomes and hyperglycemia: patients with high blood sugar have worse outcomes, but patients who are more critically ill have higher blood sugar levels due to stress hyperglycemia. It is therefore difficult to study the relationship between critical illness and hyperglycemia outside of a randomised controlled trial (Van den Berghe et al., 2009).
2.1.1
Randomised controlled studies
Before 2001 patients may have received insulin for high levels of blood sugar (>215mg/dL), but hyper-glycemia in the ICU had been little investigated and was regarded either as a useful adaptive response or an epidemiological phenomenon (Chinsky, 2004). It had been established that diabetic patients had increased levels of post-operative mortality and morbidity, driven by increased rates of complications, specifically wound infections, postoperative arrhythmia, and respiratory failure (Fietsam, Bassett, and Glover, 1991). Some researchers hypothesised that elevated blood sugar levels were the mechanism responsible for these problems, and therefore that normalisation of blood glucose to levels seen in healthy individuals through insulin would be beneficial for ICU patients.
The first randomised controlled trial (RCT) studying the treatment of hyperglycemia in the ICU was conducted in the Leuven, Belgium. 1548 patients from a surgical ICU (approximately 60% of whom had undergone cardiac surgery) were randomised to either intensive or conventional insulin therapy. All patients were treated using infusions of short-acting insulin. In the conventional group, the infusion was started if the glucose level exceeded 215mg/dL and was adjusted to maintain glucose in the range 180-200mg/dL. In the insulin intensive group, the infusion was started if the glucose level exceeded 110mg/dL and was adjusted to maintain glucose in the range 80-110mg/dL, with dosing dictated according to a strict algorithm. Blood glucose was measured on admission and every 4 hours thereafter (Van den Berghe et al., 2001). All patients were continuously fed with intravenous glucose immediately after surgery, which is not reflective of normal clinical practice (Angus and Abraham, 2005).
The primary outcome was mortality in intensive care. Secondary outcomes included in-hospital mor-tality, the number of days spent in intensive care, and readmission. Almost all patients (99%) in the intensive treatment group received insulin, whereas only 40% of the conventional treatment group did. Hypoglycemic episodes were six times more frequent in the intensive treatment group. Mortality out-comes were radically different between groups: 63 patients died in the conventional treatment group, compared to 35 patients in the intensive treatment group. The risk-adjusted reduction in mortality was estimated to be 32%. In-hospital mortality was also reduced, and reductions in mortality were observed across almost all severities (defined by APACHE II scores) and in both diabetics and non-diabetics. Septicaemia was 46% less common in the intensive treatment group, and a reduction in septic organ failure drove much of the mortality improvement (Van den Berghe et al., 2001).
A 32% reduction in mortality was a highly significant result - one which suggested a revolution in care. After the Leuven trial was published, subsequent studies were conducted to validate the findings and extend them to children and medical ICU patients. In general, the results were not replicated and researchers could not identify a significant difference in mortality between conventional treatment and intensive treatment groups. An almost identical study design to the Leuven trial in Saudi Arabia found that there was no survival benefit from intensive insulin therapy and that it resulted in increased
occur-rences of hypoglycemia (Arabi et al., 2008). Similarly, a trial conducted in a mixed surgical and medical ICU in Columbia found no significant difference in mortality between the intensive insulin therapy and conventional therapy groups. As with other trials, there was an increased rate of hypoglycemia in those receiving intensive treatment (De La Rosa et al., 2008). A study in sepsis patients (which was also investigating the effect of receiving different starches) was discontinued for safety reasons after it was found that intensive therapy did not lower mortality, but did increase the rate of hypoglycemia and severe adverse events (Brunkhorst et al., 2008).
The research group behind the Leuven trial did replicate the results of their original study in a smaller trial of critically ill children and infants: patients in the intensively controlled group had mortality of 3% (as opposed to 6% in the conventional treatment group) and shorter overall stay times in the paediatric ICU (Vlasselaers et al., 2009). In contrast, the Leuven researchers did not replicate their mortality results in a medical ICU, finding no significant difference between in the intensive and conventional regimens, though morbidity (driven by a lower rate of kidney injury) was significantly reduced (Van den Berghe et al., 2006).
The largest randomised controlled study investigating glucose control in the ICU is the NICE SUGAR study. NICE SUGAR enrolled more patients than the original Leuven study from multiple centres (NICE SUGAR drew from 42 hospital ICUs, whereas the Leuven studies were single centre). 6104 patients from both medical and surgical ICUs were randomised to either intensive (a glucose target of 81-108mg/dL) or conventional (a glucose target of 81-180mg/dL) treatment. Insulin was administered via infusion in strict accordance with a predefined algorithm. The primary outcome measure was death from any cause within 90 days of randomisation. Secondary outcome measures included survival time, length of stay and interventions (e.g. mechanical ventilation duration). Nutritional management was carried out at the discretion of clinicians under normal operating procedures and consisted mainly of enteral nutrition, which is more typical of clinical practice than the parenteral nutrition used in other studies (The NICE-SUGAR Study Investigators, 2009).
Almost all patients in the intensive treatment group (97.2%) received insulin, compared to 69% of patients in the conventional control group. Insulin use in the intensive group averaged more than 50 units a day, compared with 17 units a day for those receiving insulin in the conventional treatment group. Unadjusted 90 day mortality was higher in the intensive control group: 27.5%, compared to 24.9% in the conventional treatment group. Both groups had similar lengths of stay in the ICU and similar levels of organ failure, though the intensive therapy group had more cardiac events. Severe hypoglycemia (defined as <40mg/dL) was 15 times more common in the intensive control group. The NICE study investigators concluded that intensive management does not yield the benefits identified in the original Leuven trial and may actively harm critically ill patients. (The NICE-SUGAR Study Investigators, 2009).
benefit to intensive insulin therapy compared to a conventional control. There may be benefit to surgical ICU patients, but this effect was based almost entirely on the original Leuven trial, which contributed 70% of the surgical ICU patients in the meta-analysis (Griesdale et al., 2009). Methodological differences between the pioneering Leuven trials and subsequent RCTs could explain the discrepancies in results (Krinsley and Preiser, 2010). The Leuven trials used a nutritional policy which was not representative of clinical care, had higher targets for conventional treatment, and used different technology to draw blood (Schultz, Harmsen, and Spronk, 2010). In particular, there may be variability resulting from comparing venous, arterial, and capillary blood draws (Finkielman, Oyen, and Afessa, 2005).
In the decade since NICE SUGAR was published, the debate between intensive and conventional insulin therapy has continued and definitive answers have remained elusive. Several trials investigated the results of tight glycemic control on paediatric patients. In general, these trials replicated the results found in adults: intensive treatment yielded no benefit to mortality and an increased rate of hypoglycemia (Agus et al., 2012; Macrae et al., 2014). A meta-analysis of almost 4,000 paediatric patients reached similar conclusions (Zhao, Wu, and Xiang, 2018). Similarly, a trial investigating intensive insulin therapy in sepsis patients found no improvement in hospital mortality among this population (Annane et al., 2010)
2.1.2
Retrospective and observational studies
Before NICE SUGAR was published, multiple observational trials suggested that tight glycemic control was beneficial to patients. These trials compared mortality during a period prior to the implementation of a glycemic control protocol with mortality during a period after implementation (Krinsley, 2004; Reed et al., 2007; Scalea et al., 2007). No study used a control arm as part of a difference-in-difference design, which meant that all were susceptible to temporal changes in the quality of care or patient mix. Other studies, instead of comparing two periods, used logistic regression on retrospective data to estimate the ‘mortality curve’ - the variation in mortality with different levels of blood sugar. Most identified ‘J’ or ‘U’ shaped curves, with minima between 90-120mg/dL and increased mortality for severe hypoglycemia or hyperglycemia (Kosiborod et al., 2008; Krinsley, 2003; Li et al., 2015). Although logistic regression can be used to control for confounders, it lacks flexibility in model specification and the ability to control for time varying confounding. Since a patient’s insulin sensitivity can vary greatly as their health fluctuates and they receive medications, it is particularly important to control for time-varying changes in confounders. After NICE SUGAR, which had a large sample size, robust analysis, and multicenter design, most observational studies began to investigate topics other than the relationship between mortality and tight glycemic control.
Instead of focusing directly on conventional versus intensive treatments, many studies have sought to identify whether other related events, such as hypoglycemia and insulin infusions, are independently
related to mortality. Several retrospective studies reanalysed the results of RCTs, using logistic regres-sion and cox regresregres-sion. These studies do find a strong association between death and hypoglycemia, but do not prove causality (Egi et al., 2010). There is strong evidence of confounding, because the relationship between hypoglycemia and death holds even for patients who are not receiving insulin, suggesting that hypoglycemia could be a marker for, rather than a cause of, mortality (The NICE-SUGAR Study Investigators, 2012). Studies that attribute increases in mortality to insulin administration are also likely to be confounded. A recent retrospective analysis linking insulin infusions to mortality using logistic regression (odds ratio 1.1 per 0.1U/hour/day) also finds that corticosteroids have an odds ratio of 3.88. It is unlikely that steroids increase the likelihood of death by a factor of four, so this is an indication that the controls used in these papers are insufficient (van Steen, Rijkenberg, van der Voort, and DeVries, 2019).
Patients in intensive care are heterogeneous, so may react to treatments differently. Some retrospective studies have attempted to investigate heterogeneity by splitting patients into subsets or by conditioning analyses on a variable. Stress hyperglycemia and hyperglycemia due to diabetes are different conditions, despite this, most prospective trials (including both NICE SUGAR and the original Leuven study) do not account for premorbid diabetes in their designs. One study found that the nadir of the mortality curve occurred at a higher blood glucose for diabetics, compared to non-diabetics, suggesting that different patients might benefit from different glucose targets (Krinsley et al., 2013). Another study found that the U-shaped mortality curve only held for non-diabetic patients, and that no clear pattern could be established for patients with diabetes mellitus (Sechterberger et al., 2013). In both studies, hypoglycemia was associated with mortality.
That patient heterogeneity could be beneficially exploited to determine treatment policies has been widely suggested. A research group studied data from Veterans Affairs hospitals to investigate the link between admission diagnosis and the shape of the mortality curve. They found that in some diseases (e.g. sepsis, pneumonia, acute myocardial infarction) there was a strong association between hyperglycemia and mortality, but in other diseases (e.g. COPD, hepatic failure, GI obstruction) there was no statistically significant link between blood sugar and mortality (Falciglia, Freyberg, Almenoff, D’Alessio, and Render, 2009). A study specifically on patients with acute myocardial infarction found an association between glucose levels and mortality and determined that glucose normalisation was associated with better survival irrespective of whether insulin was received (Kosiborod et al., 2008). Other studies have looked at how hyperlactatemia (excess lactate in the blood) modifies the association between hyperglycemia and mortality. Multiple retrospective studies found that once lactate levels were controlled for, there was no association between hyperglycemia and mortality (Green et al., 2012), (Kaukonen et al., 2014). This result does not establish causality (it is plausible that in some patients hyperglycemia causes hyperlactatemia), but instead indicates that lactate levels may be a better marker for hyperglycemia-associated mortality.
Additional metrics of blood glucose control, such as glycemic variability, a measure of the amplitude and frequency of blood sugar oscillations, have gained traction as an important risk factor independent of glucose averages or maximum values (Clain, Ramar, and Surani, 2015). There is no agreed gold standard metric for glycemic variability and both statistical methods (e.g. coefficient of variance, J index, mean of daily differences) and serological markers (e.g. glycated albumin) have been used (Suh and Kim, 2015). Retrospective studies of glycemic variability have found a strong relationship with mortality, even after controlling for hypoglycemia, age, severity and comorbidities (Krinsley, 2008), (Hermanides et al., 2010), (Lanspa et al., 2014). Glycemic variability has been used as an outcome measure, in addition to glucose complexity (which measures the variation in a glucose time series over a shorter timescale) to evaluate the efficacy of continuous glucose monitoring in reducing mortality (Brunner, Adelsmayr, Herkner, Madl, and Holzinger, 2012). These studies too, are likely to be confounded, but, unlike glucose treatment regimens, it is unlikely that a RCT could ever be used to investigate glycemic variability, since this would require unethically randomising patients to a treatment arm which might be expected to harm them.
2.2
Computer aided glucose management algorithms
Improved treatment algorithms, both those followed manually by nursing staff and those automatically administered by a computer, are one avenue to reducing mortality in the ICU. It is hoped that better algorithms may improve the performance of tight glucose control by reducing the rate of severe and moderate hypoglycemia, which is associated with a significantly increased risk of death (The NICE-SUGAR Study Investigators, 2012). Since patients on intensive control have dramatically higher rates of hypoglycemia, but similar rates of mortality, it may be that tight glucose control does confer a beneficial effect, but this is obscured by the larger detrimental consequences of hypoglycemia. Therefore, if tight control could be achieved without a corresponding increase in hypoglycemia, it may be beneficial to patients (Van den Berghe et al., 2009). Insulin delivery mistakes are one of the most common errors in the ICU and computer-administered algorithms could be expected to reduce this. (Garrouste-Orgeas et al., 2010).
Trials comparing computer administered algorithms to conventional care have yielded mixed results. The first pilot studies were too small to identify a statistically significant difference in performance, but often had more hypoglycemic events in the algorithm arm than in those undergoing conventional treatment (Pachler et al., 2008). A French study sought to identify if patients could benefit from a computer decision support system (CDSS). The CDSS titrated insulin dosing and recommended glucose measurement frequency in an attempt to lower the rate of hypoglycemia. The study found no difference in mortality between the group receiving tight glucose control (controlled by the CDSS) and conventional treatment dictated by hospital staff, though this may have been because the CDSS
controlled group still had rates of hypoglycemia comparable to other trials (13.2%) (Kalfon et al., 2014). More recent attempts have yielded similarly equivocal results: the LOGIC-2 blood glucose control algorithm was able to lower the mean glucose of patients slightly, but did not result in fewer hypoglycemic events than a nurse led control (Dubois et al., 2017). These trials do not preclude the possibility of an algorithm which effectively eliminates hypoglycemia in the ICU, but instead highlight the considerable expertise of ICU medical staff. Algorithm performance should be expected to incrementally improve as development continues, more data is available, and computation becomes cheaper.
The end-goal of most glucose management algorithm development is creating artificial pancreases: combination devices designed to replace the pancreas in type 1 diabetics. These devices consist of continuous glucose monitors (CGM), a controller and an insulin pump (Bothe et al., 2013). Originally developed to control type 1 diabetics’ during inpatient stays (though not in the ICU) (Zisser et al., 2014), these devices are being miniaturised for portability and general use. Most insulin pumps use open-loop control (i.e. they require input from patients or caregivers), though closed-loop designs are now close to fruition (Kovatchev, 2018). Type 1 diabetics may use their pumps for years, providing ample training for an algorithm to slowly learn and transition from open-loop to closed-loop control. Their insulin sensitivity may only change slowly over this period. In contrast, intensive care patients usually stay in the ICU for less than a week and their insulin resistance may fluctuate dramatically during this time in response to stress (Shangraw et al., 1989). Nevertheless, techniques such as CGM and automated insulin control are making their way into the ICU.
Closed loop control is reliant on accurate, frequent measurements. Several studies have investigated the accuracy of either blood or subcutaneous CGM in the ICU, concluding that the use of these systems is feasible and that they are not influenced by factors specific to intensive care, such as circulatory shock and severity of illness (Corstjens et al., 2006; Holzinger et al., 2009; Siegelaar et al., 2011). An early study of closed loop control in the ICU, which was not powered to detect statistically significant differ-ences between the controller and conventional management, found that patients on close loop control had lower mean glucose and glycemic variability, but were no more likely to become hypoglycemic (Leelarathna et al., 2013). These results have been replicated (Kopecký et al., 2013). Glucose control algorithms appear to be continuously improving, and more recent introductions into ICUs have yielded positive results. The STAR algorithm, which controls both insulin and nutritional inputs, was tested on 267 ICU patients, resulting in tight glucose control and low rates of hypoglycemia (1.5%) (Stewart et al., 2016). In a multicenter study of the Space GlucoseControl (SGC) algorithm across 508 patients, only 4 episodes of severe hypoglycemia (<40 mg/dL) were observed and only 0.2% of measurements were <80mg/dL. These algorithms were effectively closed loop, but required approval by a staff member to change the insulin rate. In the case of SGC, rate changes were accepted in 99.6% of cases (Blaha et al., 2015).
In the future, computer controlled closed-loop insulin administration are likely to be cheaper (requiring less staff resource), less prone to hypoglycemia, and more reliable than conventional glucose control (Preiser et al., 2016). However, the effect of closed loop control on mortality has still not been verified in an RCT. Additionally, there are several barriers to adoption - model validation, sensor drift (a particular problem with CGM), and availability of training data. These issues need to be surmounted before wide-scale adoption of closed loop glucose control is feasible (Chase et al., 2019).
2.3
Glucose management in clinical practice
While the future of glucose management may increasingly involve computer-administrated algorithms, in most ICUs blood glucose management is still a labour intensive task reliant on the expertise of the hospital staff. Glucose readings are taken either at the bedside using a fingerstick, or are drawn from the artery or vein and sent for lab analysis. Insulin is delivered either via subcutaneous bolus, or an intravenous infusion. Where possible, references in this section are those used as the basis for guiding care at Beth Israel Deaconess Medical Center (BIDMC).
The American Diabetes Association (ADA) defines hypoglycemia as blood glucose levels <70mg/dL and hyperglycemia as blood glucose >140mg/dL. However, these definitions are different for critically ill patients, where <100mg/dL is considered hypoglycemia and >180mg/dL is considered hyperglycemia. Insulin treatment is recommended to correct glucose levels >180mg/dL until blood sugars have reduced to 140mg/dL. Some patients may benefit from lower targets; non-diabetic patients who have had cardiac surgery have a recommended target range of 100-150mg/dL (Jacobi et al., 2012). Upon entering the hospital, antihyperglycemic medications (e.g. metformin) may be discontinued if the patient is unable to eat more than half their diet, they are unstable, or they have a high A1C (glycated hemoglobin - a measure of average blood sugar over the past 3 months) (Moghissi et al., 2009).
Insulin infusions are the standard of care in critically ill patients with elevated blood sugars, except for those who are expected to leave the ICU within 24 hours. Most guidelines are written by associations and research centres that study diabetes and focus their recommendations on diabetics, but infusions are also the standard of care for non-diabetics (Farrokhi, Smiley, and Umpierrez, 2011; Ichai and Preiser, 2010). Some guidelines recommend that all critical care patients receive insulin infusions, others only indicate infusions only for those with blood sugar over 250mg/dL (American Diabetes Association, 2016; Joslin Diabetes Center, 2019). The recommendation of insulin infusions for most intensive care patients has been consistent for at least the last decade and across different countries (Joslin Diabetes Center, 2009; Nottingham University Hospitals, 2016; Queen Alexandra Hospital Portsmouth, 2017). Current blood glucose levels, rate of change, and prior infusion rates should be taken into account when calculating new insulin infusion rates (American Diabetes Association, 2016). In the case where
critically ill patients receive subcutaneous insulin, it is recommended that they receive a mixture of basal (long acting insulin which releases over the course of the day), nutritional (insulin immediately before or after patients eat), and corrective insulin. For non-diabetics (identified by an A1C <7%) with blood sugars consistently less than 140mg/dL, insulin should not be used (McDonnell and Umpierrez, 2012). In general, the total daily dose (TDD) of maintenance insulin should be determined and then split, in roughly equal proportion, between basal insulin and nutritional insulin. The TDD is adjusted to the patient’s weight and is calculated based on underlying diabetes, A1C at admission, and current blood glucose levels. Recommended TDDs range between 0.1 units/kg (for patients with no underlying diabetes) to 0.5 units/kg (for diabetic patients with blood sugars above 200mg/dL or admission A1C over 10%). Patients with an existing regimen can start on their usual outpatient dose and migrate towards their TDD, based on their blood glucose levels (Khazai and Hamdy, 2016).
If patients are hyperglycemic then corrective insulin should be administered, and their TDD should be increased to try to reduce the chance of sustained hyperglycemia. The TDD should increase by approximately 10% for every 100mg/dL the patient is above their target range. Nutritional and basal insulin can be adjusted separately if only fasting or premeal glucose is too high. Corrective insulin dosing is based on the TDD because this is associated with the insulin sensitivity of the patient. The approximate decrease in blood glucose produced by one unit of insulin is known as the correction factor. The correction factor (CF) can be used to determine how much corrective insulin (CI) to dose (Khazai and Hamdy, 2016).
CF = 1700 T DD CI= BG −100
CF
Other factors modify glucose metabolism and these should be accounted for in insulin dosing. Gluco-cortioids are an independent predictor of high blood sugar and a majority of patients receiving them experience hyperglycemia (Donihi, Raval, Saul, Korytkowski, and DeVita, 2006). It is recommended that a dose of short acting insulin (5-20 units, depending on diabetic status and steroid dose) be given at the same time as the glucocorticoid to decrease the chance of hyperglycemia (Grommesh et al., 2016). Similar measures may be required for vasopressors. Insulin dosing should also be adjusted based on the nutrition inputs the patient is receiving. Low-carbohydrate enteral solutions require less insulin and can decrease the rate of hyperglycemia (León-Sanz et al., 2005). Patients on enteral feeding should receive additional insulin, either by increasing the basal dose or the pre-meal bolus. For patients receiving TPN, the insulin can be added directly to the nutrition solution - the recommended dose is 1 unit for every 10g of dextrose. Patients requiring major surgery should always be transitioned to an insulin infusion, whereas those requiring non-major surgery (i.e. they are able to eat afterwards) can be managed using
subcutaneous insulin if their blood sugars are low enough. Post-operative patients require additional monitoring and should have their blood glucose checked once an hour if it is above 180mg/dL. All patients with post-operative glucose >250mg/dL should be managed with insulin infusions. (Joslin Diabetes Center, 2019).
Severe hypoglycemia (<70mg/dL) should be treated with carbohydrates, and insulin regimens reduced by 20% to reduce repeated events. How carbohydrates are given may vary depending on the state of the patient. Conscious patients who are able to eat can be given glucose tablets, gel, or sugary food (such as juice). For patients who are unconscious or unable to eat, dextrose solutions should be used when there is IV access and intramuscular glucagon can be used when there is no IV access. Generally, dextrose solutions to treat hypoglycemia are highly concentrated, between 20% and 50% (Joslin Diabetes Center, 2019). To prevent rebound hyperglycemia, no more than 20g of dextrose should be given. Blood glucose should be checked after 15 minutes and more carbohydrates given if it remains below 70mg/dL (Khazai and Hamdy, 2016).
Some conditions related to blood sugar are excluded from glucose management guidelines, because they require a more dramatic response. In particular, diabetic ketoacidosis (DKA) and hyperosmolar hyperglycemic state (HHS) are two of the most serious metabolic complications of diabetes. DKA is associated with type 1 diabetes (but can occur in type 2 diabetics) in young adults, whereas HHS is most common in elderly patients with type 2 diabetes. Both conditions are associated with mortality, especially HHS, which has mortality rates of 10-20% (Pasquel and Umpierrez, 2014). DKA is the result of reduced insulin concentrations and hyperglycemia, leading to the release of fatty acids into the blood and ketone creation in liver, resulting in ketonemia and metabolic acidosis (Kitabchi et al., 2009). HHS is less well understood, but is characterised by hyperglycemia, hyperosmality, and dehydration without ketoacidosis (Pasquel and Umpierrez, 2014). Both HHS and DKA are treated through a combination of IV fluids, potassium, bicarbonate infusions, and insulin. Insulin must be administered by infusion and target ranges are 150-200mg/dL for DKA and 200-300mg/dL for HHS. (Kitabchi et al., 2009)
Data Extraction
There are few studies that describe how glucose is controlled in intensive care, but understanding clinical practice is crucial to understanding how care can be improved. Fortunately, studying the standard of care is becoming easier as data collection infrastructure becomes more mature. The Beth Israel Deaconess Medical Centre (BIDMC) has been collecting intensive care unit data since 2001 and represents a unique opportunity to analyse how blood sugar is managed in practice. This section describes how patient information, blood glucose measurements, and the inputs used to control blood glucose levels were extracted from the wider MIMIC database.
3.1
Data source
The data used in this thesis come from the Medical Information Mart for Intensive Care III v1.4 (MIMIC), which is developed by The Laboratory for Computational Physiology at Massachusetts Institute of Technology (Pollard and Johnson, 2016), (Goldberger et al., 2000). MIMIC contains data on 61,532 ICU stays across 46,520 different patients between 2001 and 2012 in the BIDMC ICU. Data was collected during routine care without intrusion and accurately represents practice. The data include doctor’s notes, time-stamped measurements of physiological variables (such as heart rate and blood pressure), and records of treatments, medications and procedures (Johnson et al., 2016).
Data in MIMIC was captured under two different clinical information systems. The CareVue system operated between 2001-2008, and the MetaVision system between 2008-2012. Only MetaVision was included in this analysis because the clinical information captured under CareVue is less rich and is structured differently, so cannot be analysed using the same code. One avenue for future work may be
to expand the analysis to include CareVue data. The exclusion of CareVue means that only four years of data - from 2008 to 2012 are included. Data from after 2012 will be released later in 2019, in MIMIC-IV (the next iteration of MIMIC).
MIMIC is a relational database structured into 26 different tables. These tables have several linking variables, such as SUBJECT_ID (patient ID), HADM_ID (hospital admission ID), and ICUSTAY_ID (ICU admission ID). A single patient may have multiple hospital admissions and a single hospital admissions may feature multiple ICU admissions. Within MIMIC are tables of: information used to track patient stays, dictionaries which translate IDs used in other tables, and care data such as vital signs (Johnson et al., 2016). The tables used in this thesis are shown in Table 3.1.
MIMIC Table Description
ADMISSIONS Hospital admission-level data for each patient.
CHARTEVENTS Bedside chart observations for each patient. Includes vital signs and blood glucose.
D_ICD_DIAGNOSES Dictionary of ICD-9 codes in DIAGNOSES_ICD
D_ITEMS Dictionary of the item IDs appearing in the CHARTEVENTS and INPUTEVENTS_MVtables.
D_LABITEMS Dictionary of the item IDs appearing in the LABEVENTS table. DIAGNOSES_ICD Patient ICD-9 diagnoses
ICUSTAYS ICU admission-level data for each patient.
INPUTEVENTS_MV Inputs for each patient under the IMDSoft MetaVision System, which runs from 2008-2012. Includes insulin, dextrose and feeding data. LABEVENTS Laboratory observations for each patients. Includes laboratory blood
glucose measurement.
NOTEEVENTS Notes including physicians notes, reports and discharge summaries. Used to establish pre-existing diabetes diagnosis.
PATIENTS Patient-level characteristics, such as gender and mortality.
Table 3.1:MIMIC tables used for data extraction .
2001-2008, and INPUTEVENTS_MV, which houses the MetaVision data collected 2008-2012. As explained, only the INPUTEVENTS_MV table (containing MetaVision data) is used for this analysis.
3.1.1
Cohort definition
Data extraction began by defining a cohort of ICU stays to be included in the analysis. For this cohort of ICU stays, information on the blood glucose measurements, insulin inputs, nutrition inputs, Sequential Organ Failure Assessment (SOFA) score, and personal characteristics (such as gender and mortality) were extracted from the tables. These were all linked together using ICUSTAY_ID.
A cohort of ICU stays was established to ensure that patients being used were comparable (e.g. all adults), that the same features were available for all stays, and that all stays had relevant measurements (i.e. glucose measurements). Exclusions were applied sequentially. Before exclusions, MIMIC contains 61,532 unique ICU stays, attributable to 46,520 unique patients (some patients have multiple ICU stays).
The first exclusion was that the ICU stay must have occured during the MetaVision time period (2008-2012). Those stays which took place during the CareVue time period (2001-2008) were dropped. This exclusion was applied because MetaVision has richer data and can be used for a more in-depth analysis. ICU stays in the MetaVision period were identified by searching for every unique ICUSTAY_ID in the INPUTEVENTS_MVtable. The disadvantage of this method is that any patient who entered the ICU in this period, but received no medical inputs, would not be featured in this list. However, it is extremely unlikely to receive no medical inputs in the ICU and so this flaw is acceptable. Due to the longer time period for which CareVue data was collected, most ICU stays in MIMIC are in the CareVue table. This criteria excludes 37,665 ICU stays, with 23,386 remaining within the cohort.
The second exclusion is that only adult stays are considered, any stay where the patient is below age 18 is dropped. Children have different physiological baselines and responses to drugs, confounding any analysis. MIMIC does not include a pediatric ICU (PICU), so the MetaVision dataset almost exclusively comprised of adults and excluding children does not significantly diminish the cohort size. This criteria excludes 28 ICU stays, with 23,358 remaining within the cohort.
The third exclusion is that only those ICU stays over 24 hours were considered. This is so that there is enough data to draw valid conclusions about the nature of each stay. In practice, short stays in the ICU represent the extremes of the very ill (who die soon after admission) and those who recover almost immediately. The length of stay variable LOS is extracted from the ICUSTAYS table and used for this exclusion. This criteria excludes 3,660 patients, with 19,698 remaining within the cohort.
The final exclusion is that only stays in which at least one glucose measurement occurred are included. This analysis focuses on blood sugar measurements, so patients who do not have their blood sugar
monitored provide limited information. Patients without any insulin administrations are included within the cohort because these can provide counter-factual outcomes. Almost everyone who stays in the ICU for more than 24 hours has their glucose measured. This criteria excludes 4 patients, with 19,694 remaining within the cohort.
Often studies using MIMIC will exclude all but the first ICU start for each patient. This avoids breaking independence between stays. Generally, stays can be considered independent, a high reading for one patient does not predict the reading for a different patient. However, if the same patient is counted multiple times, then a high reading for their first visit may make it more likely to observe a high readings for later visits. Losing independence between measurements can violate the assumptions for many statistical models. In this case, it was decided to keep the stays because this gives a truer representation of clinical practice.
A diagram of the exclusion process and corresponding patient numbers is shown in figure 3-1
3.2
Generating extracted tables and data cleaning
MIMIC is structured as a relational database, with 26 separate tables linked by ID variables (see Section 3.1). As a whole, MIMIC is too large to work with practically (the CHARTEVENTS table has over 330 million rows alone), so views which contain only relevant data must be extracted. For this analysis relevant data included, admissions information, glucose measurements, insulin inputs, dextrose inputs and nutritional inputs. MIMIC was queried using PostgreSQL, a free and open-source relational database management system. MIMIC was stored locally and accessed using psycopg2, an adaptor which allows PostgreSQL to be run through Python. The code for generating tables is described below and can be found in the "Generate Tables" script in the project github: https://github.com/ lawbaker/MIMIC-Glucose-Management.
Extracted table generation comprised of 5 steps:
1. Define needed inputs (e.g. Insulin) and retrieve the relevant IDs from the dictionaries contained in D_ITEMS and D_LABITEMS.
2. Retrieve unfiltered tables and use them to define the study cohort, as outlined in Section 3.1.1. 3. Filter tables so that they only include the study cohort and the relevant inputs, Sequential Organ
Failure Assessment (SOFA) scores, labs and, charts.
4. Retrieve the notes of included stays and process to establish known pre-existing diabetic status. 5. Append the diabetic information to the extracted admissions table.
For details of the input IDs used refer to Sections 4.4, 4.5 and 4.6. These inputs IDs and the study cohort were used to filter views of the ADMISSIONS, CHARTEVENTS, INPUTS_MV, LABEVENTS tables. The dictionar-ies contained in D_ITEMS, D_LABITEMS and DICD_DIAGNOSES were used to relabel input IDs and Interna-tional Classification of Diseases 9 (ICD 9) codes with descriptions. Hourly SOFA scores were retrieved for the patient cohort by adapting the pivoted-sofa.sql concept found in the MIMIC github repository: https://github.com/MIT-LCP/mimic-code/blob/master/concepts/pivot/pivoted-sofa.sql.
Notes were processed by looking in the social history section of the discharge summary of each patient for mentions of the words:
• "diabetes" • "diabetes mellitus" • "type 2" • "dm2" • "type ii" • "insulin dependent"
Patients who met this criteria were considered to have preexisting diabetes. Patients were not considered if the word "insipidus" appeared in the same section: diabetes insipidus is caused by the underproduction of anti-diuretic hormone and is unrelated to diabetes mellitus. A binary diabetic classification was appended to the extract of the admissions table.
3.2.1
Glucose measurements
In the ICU, blood glucose values are measured either using laboratory analysers or bedside fingerstick devices, similar to those used by diabetics at home. Laboratory analysers are considered more accurate, but take longer generate results. Laboratory measurements are recorded in both the LABEVENTS table and the CHARTEVENTS table, so only measurements CHARTEVENTS are retrieved to avoid duplication. Fingerstick measurements are recorded only in the CHARTEVENTS table. The item IDs used for glucose measurements, the corresponding description, and how IDs were mapped to either fingerstick (for bedside measurements) and laboratory is shown in Table 3.2.
Measurement Type Item ID Description
Fingerstick 807 Fingerstick Glucose 225664 Glucose finger stick
Laboratory
811 Glucose (70-105) 1529 Glucose
220621 Glucose (laboratory) 226537 Glucose (whole blood)
Table 3.2:IDs used for extraction of glucose measurements .
There are three glucose IDs not included in this analysis. The first is 51478, which is in the LABEVENTS table. 84.9% of the glucose values for this ID are NaN. Those measurements which are not NaN are confined to 8 values (multiples of 50) and so cannot represent accurate measurements. Additionally, 24.8% of the non-NaN values with this code are 1000mg/dL, an infeasibly high blood glucose measure-ment. There are 3,362 non-NaN entries under this code for the cohort. The final two IDs not included are 50809 and 50931, which are laboratory measurements that are also recorded under 220621 and 226537. These IDs are removed to avoid duplicates.
Not all glucose readings were relevant to the analysis performed and some readings were dropped because they appeared to be erroneous. The rules used to clean these entries were:
1. Drop entries which are flagged as an error in the CHARTEVENTS table. These entries do not represent legitimate readings.
2. Drop duplicated entries (duplicates were defined as entries for the same ICU stay at the same time with the same blood sugar reading using the same method).
3. Drop entries with missing value information
4. Drop entries with the time stamp that does not occur during the ICU stay.
5. Drop glucose values over 1000 mg/dL, these are beyond the measurement range of any assay. It is unclear whether these measurements are entry errors (e.g. 120mg/dL entered as 1200mg/dL) or are estimates of very high blood sugar in regions where the assay may not be accurate. It was decided to drop these measurements altogether rather because of the likelihood that they were errors, and because any imputation strategy would corrupt the integrity of the dataset.
6. Drop glucose values below 10 mg/dL, these are below the range that would result in death and so are likely errors.
7. Drop fingerstick glucose values over 499 mg/dL, these are beyond the range of the fingerstick assay, so these readings are very likely to be errors.
After these exclusions, 438,411 (97.7%) of the original 448,906 glucose measurements remained. The majority of exclusions (95.6%) were dropped either because they were an error, they were a duplicate measurement, or because they were outside the time range of the ICU. Less than 0.1% of readings were dropped for being outside defined ranges. A diagram of the exclusion process and corresponding glucose measurement count is shown in Figure 3-2.
3.2.2
Insulin inputs
Insulin is used to decrease blood sugar by promoting transfer of carbohydrates (particularly glucose) from the circulating blood supply into cells (Stringer, 2017). Three different classes of insulin are given via two routes of administration in the ICU. The two different routes of administration are boluses and infusions. Boluses are doses of insulin which are subcutaneously injected, diffusing through muscle into the blood stream. Infusions are continuous drips of insulin directly into the blood stream. Intravenous insulin is designed to be absorbed quickly and so only uses short acting insulin. Insulin boluses can use short-acting (2-8 hours), intermediate-acting (8-12 hours), and long-acting (12-24 hours) insulin, these modify blood sugars over different time intervals. Typically long-acting insulin is used to regulate blood glucose levels over long periods of fasting, whereas short-acting insulin boluses are used to prevent increases in blood sugar from meals or in response to elevated blood sugar (Joslin Diabetes Center, 2019). Insulin doses are extracted from the INPUTEVENTS_MV table. The item IDs used for insulin measurements, corresponding description and how these were mapped into speed of action classes is shown in Table 3.3.
Insulin Class Item ID Description
Short-acting 223258 Insulin - Regular 223262 Insulin - Humalog 75/25
Intermediate-acting
223257 Insulin - 70/30 223259 Insulin - NPH 223261 Insulin - Humalog Long-acting 223260 Insulin - Glargine
Table 3.3:IDs used for extraction of insulin inputs .
Insulin doses that had ‘ml’ specified as the unit of measurement for the total amount delivered (which was unspecified for boluses) were considered to be infusions. All other records were labelled as boluses.
Not all insulin inputs were relevant to the analysis performed and and some records were dropped because they appeared to be erroneous. The rules used to clean these entries were:
1. Drop entries which are flagged as an error in the INPUTEVENTS_MV table. For each of these entries incorrect information was input and that the rates/amounts described were not delivered to the
patient.
2. Drop duplicated entries (duplicates were defined as entries for the same ICU stay at the same time with the same amount delivered of the same insulin using the same administration route). In this case there were no duplicates remaining once errors were accounted for.
3. Drop entries which are missing both amount and rate values
4. Drop entries with the time stamp that occurs before or after the ICU stay. For insulin inputs, most of these entries are legitimate, occurring during the hospital stay (but not the ICU stay). Unfortunately, not all features relevant to blood sugar are available for the period before or after ICU admission, so these data are of limited use and are dropped from the sample.
5. Drop insulin boluses with negative or zero amount values.
6. Drop short-acting insulin boluses with amount >100 units. These doses are so large that they are likely to be recording errors.
7. Drop insulin boluses with negative rate values.
8. Drop insulin infusions with rate >100 units/hour. These doses are so large that they are likely to be recording errors. Lower limits were considered, but there are some cases in which very high infusion rates are given.
9. Align infusions such that two infusions cannot occur at the same time. In the case where infusions overlap, change the end of the prior infusion to be the start of the current infusion (35 realignments were made, >0.1% of included infusions)
10. Drop infusions less than 1 minute in length, these are likely artefacts from rate control changes. These entries artificially inflate the number of infusions, and may represent incorrectly entered rates.
After these exclusions, 143,551 (76.8%) of the original 186,924 insulin inputs remained. The majority of exclusions (90.8%) were dropped either because they were an error or because they were outside the time range of the ICU.
The raw counts for insulin infusions may be misleading, because each entry in MIMIC corresponds to an infusion rate change (or a new infusion) and delivery rates are adjusted many times on each infusion. The count of infusions is therefore a measure of how many times a nurse adjusted the rate, not the total number of infusions. A diagram of the exclusion process and corresponding insulin measurement count is shown in Figure 3-3.
After exclusions and realignment, some parameters were recalculated, including the amount delivered, based on the rate and the recalculated length of infusion. This recalculation decreased the figure for the total amount of insulin delivered via infusion by 0.1%.
3.2.3
Dextrose inputs
Dextrose can be used to increase blood sugar levels when patients are suffering from hypoglycemia. At BIDMC four different levels of dextrose concentration are administered intravenously: 5% (D5), 10% (D10), 20% (D20) and 50% (D50). The magnitude of blood sugar increase depends on both dose and patient characteristics (Bender and Mayes, 2015). Typically, more concentrated solutions, such as D50, are used in response to severe hypoglycemia, whereas lower concentrations are given with medication (such as antibiotics) or as a compliment to nutritional inputs. Dextrose inputs are extracted from the INPUTEVENTS_MVtable. The item IDs used for dextrose inputs, and the corresponding concentrations are shown in Table 3.4.
Concentration Item ID Description
D5 (5%) 220949 Dextrose 5% 225947 Dextrose PN D10 (10%) 30016 Dextrose 10% 220950 Dextrose 10% D20 (20%) 30017 Dextrose 20% 228140 Dextrose 20% D50 (50%) 220952 Dextrose 50%
Table 3.4:IDs used for extraction of dextrose inputs .
Concentration information is missing for the entries marked Dextrose PN. Concentrations of 5% were assumed for these entries because this is by far the most comment concentration used in the BIDMC ICU.
Not all feeding inputs were relevant to the analysis performed and and some records were dropped because they appeared to be erroneous. The rules used to clean these entries were:
1. Drop entries which are flagged as an error in the INPUTEVENTS_MV table. For each of these entries incorrect information was input and that the rates/amounts described were not delivered to the patient.
time with the same dextrose concentration)
3. Drop entries with the time stamp that occurs before or after the ICU stay. For dextrose inputs, most of these entries are legitimate, occurring during the hospital stay (but not the ICU stay). Unfortunately, not all features relevant to blood sugar are available for the period before or after ICU admission, so these data are of limited use and are dropped from the sample.
4. Drop dextrose infusions with negative amount values
5. Align infusions such that two dextrose infusions cannot occur at the same time. In the case where infusions overlap, change the end of the prior infusion to be the start of the current infusion (31,296 realignments were made, 22% of included infusions)
6. Drop infusions less than 1 minute in length, these are likely artefacts from rate control changes. These entries artificially inflate the number of infusions, and may represent incorrectly entered rates.
After these exclusions, 322,632 (68.5%) of the original 476,694 dextrose inputs remained. The vast majority of exclusions (98.9%) were dropped either because they were a duplicate measurement, an error, or because they were outside the time range of the ICU. The MIMIC database tracks infusions every time the rate is adjusted or the infusion is changed (infusion rates are often adjusted multiple times per infusion). The count of infusions is therefore a measure of how many times a nurse adjusted the rate, not the total number of infusions. A diagram of the exclusion process and corresponding dextrose measurement count is shown in Figure 3-4.
Rate information was missing from 181,505 (56.2%) of the remaining dextrose entries. After consultation with ICU staff at BIDMC, these entries were considered as ‘boluses’, in that the dextrose was delivered as fast as possible.
After exclusions and realignment, some parameters were recalculated, including the amount delivered, based on the rate and the recalculated length of infusion. This recalculation decreased the figure for the total amount of dextrose delivered via infusions by 21.9%.