HAL Id: hal-01523878
https://hal.archives-ouvertes.fr/hal-01523878
Submitted on 17 May 2017
HAL is a multi-disciplinary open access
archive for the deposit and dissemination of
sci-entific research documents, whether they are
pub-lished or not. The documents may come from
teaching and research institutions in France or
abroad, or from public or private research centers.
L’archive ouverte pluridisciplinaire HAL, est
destinée au dépôt et à la diffusion de documents
scientifiques de niveau recherche, publiés ou non,
émanant des établissements d’enseignement et de
recherche français ou étrangers, des laboratoires
publics ou privés.
C. Saint Martin, C. Fouchier, P. Javelle, Johnny Douvinet, F. Vinet
To cite this version:
C. Saint Martin, C. Fouchier, P. Javelle, Johnny Douvinet, F. Vinet. Assessing the exposure to
floods to estimate the risk of flood-related damage in French Mediterranean basins. 3rd European
Conference on Flood Risk Management (FLOODrisk 2016), Oct 2016, Lyon, France. pp.04013,
�10.1051/e3sconf/20160704013�. �hal-01523878�
Assessing the exposure to floods to estimate the risk of flood-related
damage in French Mediterranean basins
Clotilde Saint-Martin1a, Catherine Fouchier1, Pierre Javelle1, Johnny Douvinet2 and Freddy Vinet3 1
Irstea Aix-en-Provence, 3275 route Cézanne, 13100 Aix-en-Provence, France
2
UMR ESPACE 7300 CNRS, University of Avignon, 74 Rue Louis Pasteur, Case 19, 84000 Avignon, France
3 UMR GRED, University of Montpellier, Route de Mende, 34199 Montpellier cedex 5, France
Abstract. The dreadful floods of 1999, 2002 and 2003 in South of France have alerted public opinion on the need for a more efficient and a further generalized national flood-forecasting system. This is why in 2003 Irstea and Meteo-France have implemented a new warning method for flash floods, including on small watersheds, using radar rainfall data in real-time: the AIGA method. This modelling method currently provides real-time information on the magnitude of floods, but doesn’t take into account the elements at risk surrounding the river streams. Its benefit for crisis management is therefore limited as it doesn’t give information on the actual flood risk. To improve the relevance of the AIGA method, this paper shows the benefits of the combination of hydrological warnings with an exposure index, to be able to assess the risk of flood-related damage in real time. To complete this aim, this work presents an innovative and easily reproducible method to evaluate exposure to floods over large areas with simple land-use data. For validation purpose, a damage database has been implemented to test the relevance of both AIGA warnings and exposure levels. A case study on the floods of the 3rd October 2015 is presented to test the effectiveness of the combination of hazard and exposure to assess the risk of flood-related damage. This combination seems to give an accurate overview of the streams at risk, where the most important amount of damage has been observed after the flood.
1 Introduction
During the third United-Nations world conference on disaster risk reduction that took place in Sendaï in 2015, the scientific community acknowledged “a steady rise in disaster-related losses, with a significant economic, social, health, cultural and environmental impact in the short, medium and long term” [1]. For
the last two decades, many studies have tried to deal with such prospect, since it is a major issue for modern societies [2-4]. Those latter works provide empirical evidence relevant to an increase of the cost of disasters, and more specifically of floods [5].
Despite this agreement, the reasons for the increasing number of flood impacts differ between various authors. Without favouring a theory over another, the increase of people exposure to flooding seems to be one of the most reoccurring cause and a massive densification in flood-prone areas over the last thirty years is proven [5, 6]. The concentration of elements at risk can be explained by the historical attractiveness of rivers for access to water. The current demographic and economic pressure may also explain the high density of population in flood-prone areas. Today, one in four French inhabitants as well as one in three French jobs are located in a flood-prone area and thus exposed to the risk of flooding. Therefore it
legitimately highlights the importance of assessing the exposure of an area to flooding, to measure the flood damage potential.
The national French system for flood forecasting (namely the “flood vigilance”) currently acknowledges the importance of land exposure and takes it into account for flood alerts, but only for the main French rivers. For the remaining network, automatic broad-based warning method exist, broad-based on radar rainfall measurements (the APIC method from Meteo-France) or discharge simulations (the AIGA method from Irstea) but they don’t consider the exposure to flooding and only inform on the hazard level.
The aim of this paper is to present a flood exposure index which could be easily integrated into the AIGA method, in order to obtain more relevant real time flood warnings. In this sense, the paper is divided into four main parts. First, we present the main issues faced in the French Mediterranean context in term of flood forecasting. In a second part, we present an innovative method to assess the exposure to flood through an exposure index. Then we introduce a post-flood damage database meant for validation purpose. Finally, a case study is presented (the 3rd October 2015 flood around Cannes) in order to illustrate the usefulness of the exposure indicator and the potentialities of a combination with AIGA warnings.
2 Limits of the actual flood warning
methods in the Mediterranean area
2.1 The Mediterranean region: a flash flood prone area
After the recent floods in Vaison-la-Romaine in 1992, the Gardons in 2002 and Draguignan in 2010, many researchers have focused on the South of France as a privileged study area. A lot of projects have been undertaken [7-9] or have integrated this zone in their current research stages as the HyMeX project for example. Other projects have also risen as Prediflood that focused on the risk of road cut-off susceptibility over the department of Gard and the RHYTMME project that focused on the PACA region [10].
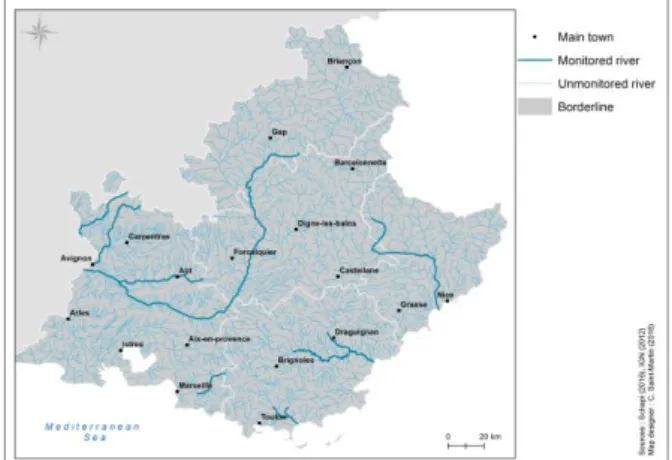
Despite this large amount of existing studies, we chose to develop our method in the French Mediterranean area (Fig. 1) for several reasons.
Firstly, our work concentrates on flash floods that are particularly frequent in this zone. The Mediterranean region is notably subject to so-called Cevenol episodes which are intense hydro meteorological events occurring mostly in the Gard and Hérault departments [11]. By choosing this region we had a sufficient number of events to test and validate our approach. Indeed, between 2011 and 2015, 21 flood events have been identified in our study area. This statement also underlines the operational benefits of our approach. Secondly, previous studies pay little attention to the regional scale, where improvements are strongly required as the flash-floods of the 3rd October 2015 recalled it. Lastly, there are important gaps between the urbanisation of the littoral and the inland. Our method can then be tested in areas with different levels of exposure.
We have highlighted that the study zone we chose often suffers from flash floods. However, because of its geographical situation this area also shows a high human density, making it particularly exposed. The small basins once avoided because of floods have now become coveted locations. Considering this statement and the lack of forecasting devices on small watersheds, the crisis managers from the area are obviously demanding for devices to cope with floods.
2.2 Limits of the national vigilance system
In France, meteorological forecasting is Meteo-France prerogative but flood forecasting fells within the remit of the SCHAPI (central office for hydrometeorology and assistance to flood forecasting). It is an official organism created in 2003. It coordinates regional centres called SPC (local offices for flood forecasting) to improve the forecasting of floods. This forecast takes the form of what we call “vigilance”.
The major floods caused by the Lothar and Martin windstorms of 1999 have led the French authorities to develop a new warning system to
anticipate hydrometeorological events. Since 2001, Meteo-France has indeed developed an efficient meteorological vigilance system throughout France. The vigilance consists in warning people and risk managers about the possible occurrence of a meteorological event, such as storms, snowfall, floods, waves, high (or low) temperatures. It enables stakeholders to be prepared and encourages the monitoring of weather conditions.
The meteorological vigilance is released at the department level. Twice a day, a post is published in the form of a report and a map. There are four vigilance levels from the green one, corresponding to the absence of imminent danger to the red one consisting of a high level of danger. This last level is quite exceptional; it has only been used seven times since 2001.
Within this vigilance system, flood warnings are the responsibility of the SCHAPI, a service depending on the French ministry of Environment. The flood vigilance is similar to the meteorological one with the difference that the warnings characterize the rivers. Its goal is to anticipate floods for crisis management purposes. This vigilance can be described as a flood risk warning system as it takes into account the elements at risk besides the only hazard intensity. Yet, only 20 000 km out of the 120 000 km French hydrographic network benefit from this monitoring so far. This monitored network corresponds to the larger watersheds. Yet, the vigilance system is not sufficient and especially in the Mediterranean region (Fig. 1)
where floods are very frequent and mostly happen on small basins in response to heavy rains in a short amount of time.
Fig. 1. Comparison between the monitored and unmonitored
parts of the French hydrographic network in PACA region
(Saint-Martin, 2016)
There is an actual need for flood anticipation outside the regulatory hydrological network, and especially in South of France as illustrated by the different projects PACTES [12], CRISTAL [13] or RHYTMME [10].
2.3 The AIGA method
In order to cope with the needs of the remaining French hydrological network for a flood warning system, Irstea and Meteo-France have developed AIGA (adaptation of geographic information for flood warning) [14].
AIGA is a flood warning system based on a simple distributed hydrological model run at a 1km² resolution using radar rainfall information in real time [15]. The AIGA warnings are produced every 15 minutes and result from the comparison of these real time data with statistical data to obtain hydrological warning levels.
AIGA provides three different levels of warnings that we related to three different flood return period. The first warning level, in blue, refers to a return period ranging from 2 to 10 years. The second, in purple, corresponds to a return period ranging from 10 to 50 years. Finally, the last one, in magenta, matches a return period superior to 50 years. AIGA gives information on small basins as it goes down to watersheds with a size of 5km². This small-scale resolution enables greater accuracy in flood warning. For more details, a paper is also available in Floodrisk on the subject [16].
The flood warnings thus obtained provide information on the magnitude of the water flow but so far don’t take into account the land use. For a similar hydrological intensity, an equal warning level will be provided in a rural area and in an urban zone. Yet, the risk of damage is higher in the second case as there are more elements at risk. To make the distinction between different zones and to compare them to each other, a common index is needed for the entire Mediterranean region. That is why we have developed a generalised exposure index.
3 Method
The notion of exposure is not clearly defined. Indeed, confusion with the concepts of risk and vulnerability is currently observed although they refer to distinct components. Thus we will first try to define this notion. Risk is commonly defined as the combination of hazard and element(s) at risk [17]. These elements at risk are defined by both exposure and vulnerability: “risk is a compound function of [...] natural hazard and the number of people characterized by their varying degrees of vulnerability who occupy the space and time of exposure to extreme events” [18]. It is only recently that the risk studies got
interested in the second part of the equation. Indeed physical-hazard centred perspectives were previously favoured in the naturalist approach. But for a few years now researchers have been interested in the characterization of vulnerability as “the underlying causes of disasters are not to be found in nature but in the organization of human societies” [19].
However, the notion of exposure is often overlooked or confused with vulnerability. This
vagueness explains the large number of definitions among the authors working on the subject as for instance “the values/humans that are present at the location”[20], “the damage potential” [21], “the conditions that make people or places vulnerable” [22]
etc.
We chose to define exposure as the damage potential. Then to assess their exposure we must identify the location and attributes of the elements at risk. Indeed, the concept of exposure has an undeniable spatial dimension as it characterizes whether or not an element will be directly affected by a hazard. But besides the location, the attributes of the elements must be also well identified so they could be related to vulnerability models.
In order to measure the exposure of a given area, we first have to identify the elements exposed to one or several hazards and then to characterize their attributes. In our case we select the elements located in flood-prone areas then assess their damage potential considering the only characteristics of their nature. For instance, a hospital is by nature more exposed to a flood than a supermarket. Indeed, the damage potential to a hospital is higher as the occurrence of a flood would imply the endangerment of the patients, the staff and the capacity of the hospital to fulfil its task.
3.1 Identifying the at risk
To identify the elements at risk, we first have to delineate the flood-prone areas. Then we will be able to select the elements that may be potentially damaged by a flood. Once those elements identified, we will be able to assign them with an exposure value.
3.1.1 Delineation of the flood-prone area
The delineation of the flood-prone areas is a complicated matter, even more for large zones. One of the major issues remains in the fact that the flood envelope may vary, based on the severity of the flood. Even if some studies try to work on the subject [23] the difficulty to generalize this differentiation to the entire South of France has led us to only consider the larger flood-prone area.
To obtain the maximal flood-prone area for each river stream of the Mediterranean region, including the smaller ones, we focused on the EAIP (approximate flood-prone areas of potential floods) that have been implemented as part of the EPRI. The so called EPRI (preliminary evaluation of the flood risk) has been developed as part of the implementation of the European Flood directive of 2007. The EAIP are made from a mix of existing data as regulatory documents, national atlas of flood-prone areas and reported data from historical floods. Where there was no data available, we used the flood-prone areas delineated by the EXZECO method. EXZECO has been developed by the French CETE Méditerranée institute [24]. It uses a classic topographic analysis method to extract
the expanding flood areas from a digital elevation model [25]. Therefore, EAIP are considered as the proxy maximum flood-prone zones. They are a complete and homogenous set of data and easily accessible as they have been developed by a French public research institute.
Many elements are likely to be damaged during a flood as for people, infrastructures, buildings, cars and many more. To assess the exposure of a zone with accuracy, we should legitimately take into account all of these elements. But to simplify this assessment, we chose to only take into account the static elements in the form of land-use.
3.1.2 Selection of the elements at risk
There is a lot of different land-use data available. Yet, they come in many forms. As for us, we needed both an easily accessible and complete database. This is why we chose to resort to the land-use data from the BDTopo database distributed by the IGN French institute. However, as we aim at developing an easily reproducible method, we could have used any other data as long as it is exhaustive. The BDTopo contains 2D and 3D vector formats description of the land-use with metric precision all over France. The database contains 10 themes with different subsets under which elements of the same object type (line, point, polygon) are aggregated. Among those 10 themes we made a first selection of 5, which are detailed in the table below (Table 1):
Theme Type of data Number of
subsets
Road network Line 9
Rail network Line 3
Building Polygon 1
Building with a special function
Point 43
Table 1. Description of the BD Topo database
(IGN, 2012)
In a second time, we made a new selection inside each subset of elements, by removing those whose damage would be without consequences (trails…) and the elements unlikely to be harmed (high-voltage lines, highways…). Unfortunately, the BDTopo doesn’t take into account the agricultural crops. Still, between 2000 and 2007 the South of France was involved in at least 29 decrees of agricultural disaster due to floods [26]. This is why it seemed us important to include those elements into our inventory to be able to highlight their exposure and thought, damage potential. The European community regulation n°1593/2000 has led the French government to create a GIS register to enable the identification of agricultural parcels: the RPG (graphic parcel register). It is easily accessible online (https://www.data.gouv.fr/ ) and updated every year by the farmers themselves. The added value of this register is the characterisation of the type of crop but also of the status of each parcel. The RPG allows
us to know whether or not one parcel is fallow or currently cultivated.
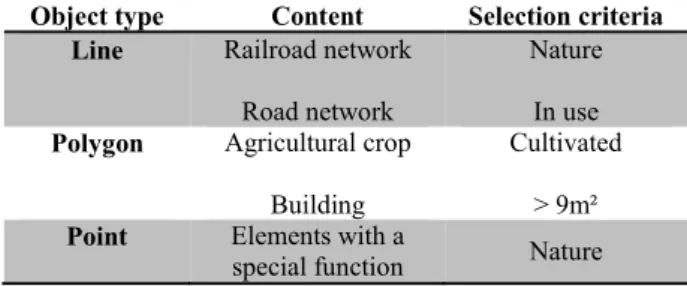
To optimise data processing, we chose to combine both BDTopo and RPG, into a single database, divided into three groups according to the shape type of the elements (Table 2).
Object type Content Selection criteria
Line Railroad network
Road network
Nature In use
Polygon Agricultural crop Building
Cultivated > 9m²
Point Elements with a
special function Nature
Table 2. Description of the database
(Saint-Martin, 2016)
The first type gathers the road and railroad networks cleared from the streams no longer in service. The second type regroups the cultivated agricultural crops and the buildings with a surface area over 9m², as it is the minimum housing surface area in the French legislation. A third type contains the buildings with a special function as for hospitals, schools or rail stations. Once these elements sorted, we proceeded to a select based on spatial relationship within the flood-prone area layer to obtain the actual set of elements at risk from flooding.
Once the elements at risk identified, the next step is to find a way to aggregate them by zone, to be able to characterize the damage potential of a given area. In this sense, we have been working on an exposure index to homogeneously assess and compare the exposure of different zones.
3.2 Implementing an exposure index at the river reach scale
Some authors have already shown an interest in assessing exposure. Indeed, it is the first step to assess potential impacts of floods. But if some of the existing studies have focused on large scales and large areas, as for example the country scale [27, 28], or at local scale and small areas [29], it seems to be no existing method to assess exposure of large areas at a fine scale. The innovative side of our method lies in its very-fine scale application but also in its possible generalization to large zones. We also aim at developing an easily reproducible method to be able to use our index on different areas but also to update it as the land-use changes or we have access to different data.
To be able to compare different areas according to their exposure, we had to find a way to aggregate the elements at risk by area. To be able to compare the hydrological warning levels from AIGA with land-use data, we needed to supply an exposure index at the same scale. To that end, we chose to assess an exposure assessment at the river reach scale. In other words, we chose to aggregate the elements at risk by
watershed. However, those elements have different natures that we need to take into account as it influences their damage potential. Indeed, to assess the damage potential of the elements at risk, we decided to prioritise them and assign them with a value according to their nature.
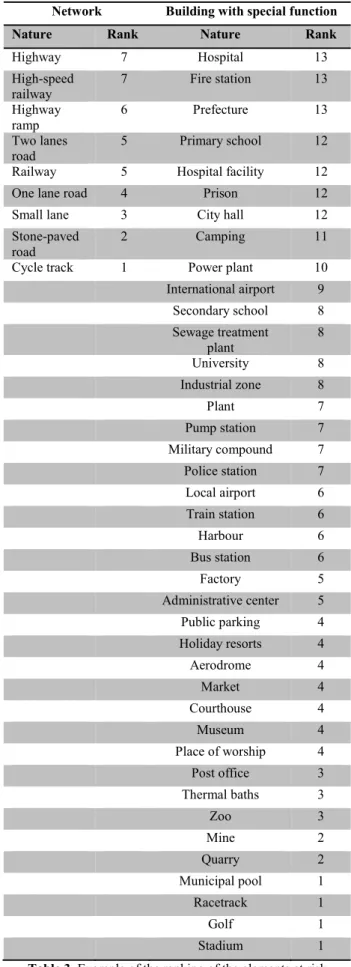
The method we are implementing is meant to enhance a current hydrological warning method intended for crisis managers. Then the ranking of the elements at risk must follow the same logic than those stakeholders. In this sense we have based the prioritization of the elements at risk on the results from studies where a panel of stakeholders were surveyed [30-32] using the analytic hierarchy process (AHP)
[33] (Table 3). We chose to rank those elements by
object type except for the polygons for which we differentiated agricultural crops and buildings to rank them according to their size. Because of its simplicity, this ranking may be revised depending on the stakeholders’ special needs.
Therefore this method allows a great flexibility but also requires fine adjustments to be as relevant as possible at the local scale.
To aggregate the elements at risk per watershed, we assigned them with a value according to their ranking in each object type. Then we used a spatial joint with a sum function on the watershed shapes, to aggregate the elements at risk per watershed in the form of an exposure value per type of elements (network, building, agricultural crop and building with special function). Finally, we added up the four types of exposure values to obtain a global exposure value corresponding to the damage potential of flood in each watershed. To make the comparison easier between the watersheds, we discretised the exposure values in 6 classes using Jenks natural breaks classification method [34] from no exposure to an extreme exposure.
Unfortunately, we don’t take into account the particular characteristics of buildings, that is to say their vulnerability. Therefore, we could assign a high level of exposure to watersheds where buildings are out of reach of flood. This is why we need to compare the exposure index to observed damage to assess its effectiveness.
Network Building with special function
Nature Rank Nature Rank
Highway 7 Hospital 13 High-speed railway 7 Fire station 13 Highway ramp 6 Prefecture 13 Two lanes road 5 Primary school 12
Railway 5 Hospital facility 12
One lane road 4 Prison 12
Small lane 3 City hall 12
Stone-paved road
2 Camping 11
Cycle track 1 Power plant 10
International airport 9 Secondary school 8 Sewage treatment plant 8 University 8 Industrial zone 8 Plant 7 Pump station 7 Military compound 7 Police station 7 Local airport 6 Train station 6 Harbour 6 Bus station 6 Factory 5 Administrative center 5 Public parking 4 Holiday resorts 4 Aerodrome 4 Market 4 Courthouse 4 Museum 4 Place of worship 4 Post office 3 Thermal baths 3 Zoo 3 Mine 2 Quarry 2 Municipal pool 1 Racetrack 1 Golf 1 Stadium 1
Table 3. Example of the ranking of the elements at risk
4. Setting up a post-flood damage
database for validation purpose
To verify the relevance of the hydrological warnings from AIGA and then the effectiveness of the exposure levels, a validation phase with actual flood damage is necessary. To that end, we have built a damage database listing flood damage from different hydrolometeorological events in South of France since 2011. It is only since that date that the radar rainfall measurement quality in the South-East region might be considered as good due to the settlement of X-band radars. Thus, AIGA are more relevant from this date.
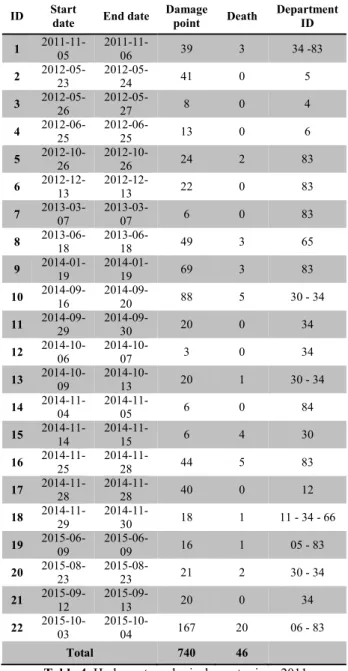
In this database we chose to only consider damage due to flash-floods events in the South of France. We tried as far as possible not to take into account the urban runoff although it often plays a significant role in the damage process in urban areas. We focused on flood events generated by important rainfalls. Since 2011, 21 flood events of this type have been recorded in the South of France (Table 4). This list may not be
exhaustive because we are not always able to collect data on small events. We tried to report the flood damage of the affected area as precisely as possible. In this sense, we chose to only collect damage data with fine location information.
In the database, each damage point recorded has a unique ID and corresponds to one row. For each damage point, a set of data is provided as below:
- Location: geographic coordinates, city, department,
- Time stamp: date, hour, event ID and duration, - Damage type: nature of the affected element,
damage extent, - Photos and videos, - Sources.
We aimed at obtaining the most exhaustive database possible to be able to have damage information on areas with no wide mass media coverage. In this sense we have come to an innovative approach to use different types of sources.
First we have collected damage data from newspapers. It is easily accessible information, generally published just after an event. It enables us to have an overview of the damage extent almost immediately after an event. Two formats of newspaper are currently available: paper and electronic. The paper format shows a significant amount of data especially at the local scale as it contains precise damage information and interviews with affected people. Unfortunately this format is most of the time sold in local shops, and it is rather difficult to obtain copies after their publication date. The second format of newspaper is electronic. It is way easier to access but it is also more general. However you can still obtain precise information through videos and photos.
ID Start
date End date
Damage point Death Department ID 1 2011-11-05 2011-11-06 39 3 34 -83 2 2012-05-23 2012-05-24 41 0 5 3 2012-05-26 2012-05-27 8 0 4 4 2012-06-25 2012-06-25 13 0 6 5 2012-10-26 2012-10-26 24 2 83 6 2012-12-13 2012-12-13 22 0 83 7 2013-03-07 2013-03-07 6 0 83 8 2013-06-18 2013-06-18 49 3 65 9 2014-01-19 2014-01-19 69 3 83 10 2014-09-16 2014-09-20 88 5 30 - 34 11 2014-09-29 2014-09-30 20 0 34 12 2014-10-06 2014-10-07 3 0 34 13 2014-10-09 2014-10-13 20 1 30 - 34 14 2014-11-04 2014-11-05 6 0 84 15 2014-11-14 2014-11-15 6 4 30 16 2014-11-25 2014-11-28 44 5 83 17 2014-11-28 2014-11-28 40 0 12 18 2014-11-29 2014-11-30 18 1 11 - 34 - 66 19 2015-06-09 2015-06-09 16 1 05 - 83 20 2015-08-23 2015-08-23 21 2 30 - 34 21 2015-09-12 2015-09-13 20 0 34 22 2015-10-03 2015-10-04 167 20 06 - 83 Total 740 46
Table 4. Hydrometeorological events since 2011
(Saint-Martin, 2016)
The second main source of damage data is fieldwork. Indeed, after significant flood events, researchers are required to go on disaster areas to give the first feedbacks and analyse the situation. It is an important part of data collection as it enables to cover areas the media are not interested in. Unfortunately, even if fieldwork is a major source of information on damage, it is also very time-consuming. But the post-event interventions seem to be organised with increasing frequency.
Finally, our last source of data and also the more pioneering is the social networks. Social media have emerged as a vital element in warning and sharing information among the population [35, 36]. The use of such source of information enables us to access local, geolocated and time-stamped data. We mainly use Twitter and Facebook as they are currently the most popular social networks. This way, we also involve local populations to our work.
We have recorded more than 700 damage points since 2011. By comparing them with the hydrological AIGA warnings we are able to verify their effectiveness. Therefore, we are able to identify unwarranted as well as missed hydrological warnings. In the same way, damage points allow us identifying inconsistencies in the inventory of the elements at risk within our exposure index. Using these data, we are then able to recalibrate the index accordingly. For the moment, this validation is only visual but we aim at making it automatic.
For the 3 October 2015 event, we have collected 170 damage points and 20 fatalities. By comparing those with the exposure levels and the AIGA warnings, we will be able to test the relevance of a flood-related damage warning system based on these latter data.
5 Case study
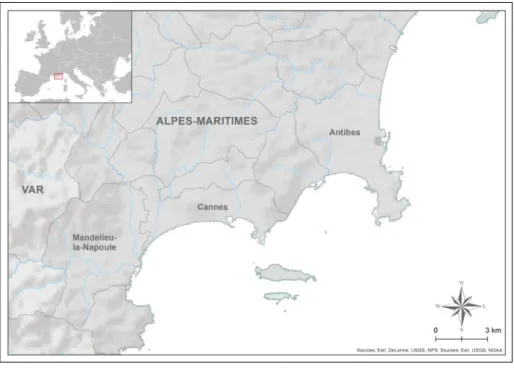
To illustrate the potential of the exposure index developed in this study, we present the example of the 3rd October 2015 flood in the French department of Alpes-Maritimes (Fig. 2). Warnings issued by AIGA
for this specific event have already been presented in this issue by [15].
The 3rd October 2015, intense rainfalls have given rise to major flash floods in South of France that caused 20 fatalities and a total cost of damage estimated at over 650 million Euros. The rainfall intensity (156mm in Mandelieu-la-Napoule and 175mm in Cannes in 2 hours) on a large zone and the small size of the affected watersheds made flood forecasting unenforceable for the Vigicrues system.
This event is a perfect example of the interest shown by the hydrological warnings produced by AIGA.
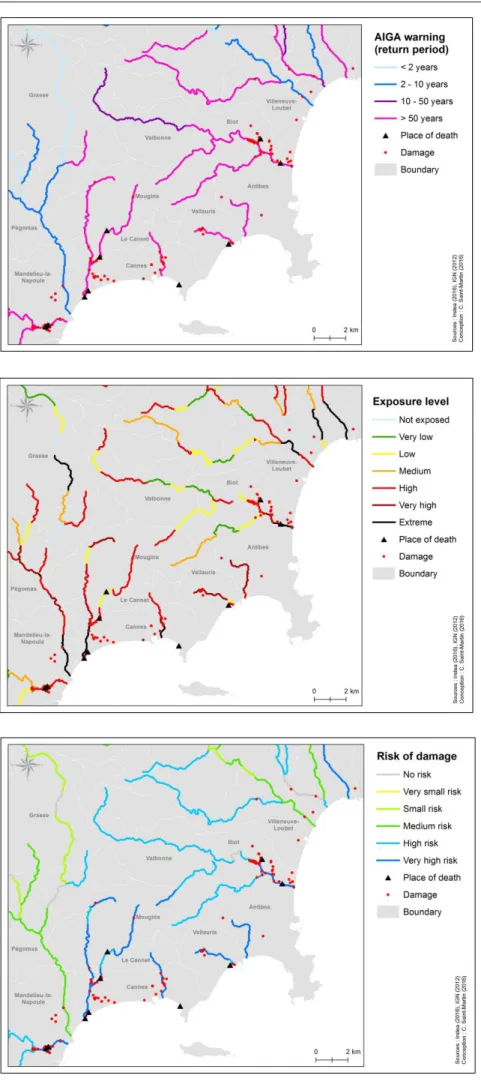
Figure 3 shows a comparison between the maximum
hazard levels provided by AIGA and the damage points from our database.
We can see a correlation between the location of damage and the AIGA qualifications of the hazard. Indeed, almost all the damage points are close to a river with a high warning level (superior to 50 years). However, the Figure 3 also illustrates the limits of the
AIGA qualifications as it is only based on the hazard level. A great number of rivers are indeed characterized with the same hydrological warning level (50 years) with no reported damage. Therefore, the hydrological qualifications alone don’t seem sufficient to assess the risk of flood-related damage. Moreover, AIGA warnings alone are useless to crisis managers and rescue services to prioritize their actions. Indeed, too many areas are characterized with a high warning level. Besides, some damage points are also located near rivers whose flood AIGA warning level is between 2 and 10 years. It underlines the lacks of the current AIGA method.
In a second map we represented the static exposure levels for the same area (Figure 4), calculated with the method presented in this paper. On this map, the damage points are localised near rivers with a very high to extreme level of exposure.
The exposure index also explains why there are damage points near rivers with a low level of hydrological warning (Mandelieu-la-Napoule). Indeed the land-use seems to be a key to determine the flood-related damage location.
However, a high exposure index does not imply that damage has been reported. It is only when both hydrological warnings and exposure levels are Fig. 2. Case study area
combined together that they become significant for flood-related damage. We can see that the damage is located near the streams qualified with the highest AIGA and exposure levels. Conversely, only a few locations show high levels of exposure or AIGA warnings with no damage. To highlight the benefit of the combination of both exposure and hydrological levels, we have joined them into a third index: a risk index for flood-related damage, by multiplying the weighted exposure value and precise AIGA return period for each stream (Fig. 5).
In this third map, we can point out the location of damage near river streams with high levels of risk. Indeed, almost all the damage points and places of death match with a “very-high risk” level. We can also highlight that the rivers the most at risk are less numerous than the ones characterized by a high AIGA warning level. Besides, the rivers with a high level of risk are not necessarily the ones with a high exposure level. This last point underlines the importance to combine both hydrological and land-use data.
However, some particular cases need to be mentioned. For instance in the South-West of Cannes city and in the North-East of Antibes, damage points seem to be aligned along invisible strings. It can be explained by the small size of the watersheds of the streams in question, which are inferior to 5km², which is the limit of the drainage network considered in our study.
Even though our approach is intended as innovative, we can highlight some limits and suggest improvements. First, we take into consideration neither the temporality nor the seasonality. Indeed, the exposure of an area might change according to the time of the day and more generally the time of the year [29] e.g. traffic hours or touristic season in campsites. We may consider integrating the temporality by weighting the exposure value of our elements at risk according to the hour or the day. It would allow to answer more accurately the needs of different stakeholders and risk managers (mayor, rescue services, road manager etc.). Surveys and interviews are planned to identify their requirements [37].
However the biggest challenge lies in the comprehensiveness of our damage database. Although we use social networks, we remain partly dependant to media coverage. Yet, we use damage data to check the relevance of our parameters. The lack of data on actual damage in an area might induce errors in the method. This issue is partially solved by the fieldwork [38] and the use of social network data. But we will never be able to be completely exhaustive unless we have access to bigger damage database as the ones of the insurance companies. However, we would still have missing data due to the multiplicity of insurance companies and the presence of uninsured goods.
The approach has shown great potential to segregate different levels of exposure to flooding in the French Mediterranean region. By combining these levels with hydrological warnings we can identify the rivers the most at risk. This approach aims to be developed again on other regions. Our method shows a great flexibility which is a key point in its innovative input. Another key point is the use of different sources in our damage database e.g. the social networks. Unfortunately, these new media are struggling to find their way to a common usage in crisis and risk management. Yet, their broadened use would allow involving the population but also having access to multiple sources on the field.
But the main goal of this paper was to underline the benefit of a potential real-time flood-related damage warning using hydrological data and exposure levels. The post-flood maps of the flood-related risk of damage seem to have met this goal. The next step is to implement a real-time method where we would combine real-time AIGA hydrological qualifications and static exposure levels. This real-time device would ease the work of rescue services and more globally crisis managers. We are expecting important operational outcomes for this method as the South of France is affected by at least one flood every year.
6 Conclusions
Fig. 4. Flood exposure levels in the
Alpes-Maritimes (Saint-Martin, 2016)
Fig. 5. Risk of flood-related damage
during the flood of the 3rd October 2015 (Saint-Martin, 2016)
Fig. 3. Maximum AIGA warning
levels during the floods of the 3rd October 2015 (Saint-Martin, 2016)
References
1. UNISDR. Proceedings of the third UN world conference on disaster risk reduction. in UN World Conference on Disaster Risk Reduction, 14-18 March 2015. 2015. Sendai - Japan.
2. FFSA. Impact du changement climatique et de l'aménagement du territoire sur la survenance d'évènements naturels en france. in Impacts du changement climatique. 2009. 29 avril 2009, Paris.
3. Valy, J., Croissance urbaine et risque inondation en Bretagne, 2010, Université Rennes 2; Université
Européenne de Bretagne.
4. Pigeon, P., Paradoxes de l'urbanisation: pourquoi les catastrophes n'empêchent-elles pas l'urbanisation? 2012: Editions L'Harmattan.
5. Cannon, T., Vulnerability analysis and disasters.
Floods, 2000. 1: p. 45-55.
6. Nicholls, R.J. and R. Misdorp, Synthesis of vulnerability analysis studies. 1993: Ministry of
Transport, Public Works and Water Management. 7. Antoine, J.-M., B. Desailly, and F. Gazelle. Les
crues meurtrières, du Roussillon aux Cévennes/Casualty-causing flood: from the Roussillon region to the Cevennes country. in Annales de géographie. 2001. JSTOR.
8. Delrieu, G., et al., The catastrophic flash-flood event of 8-9 September 2002 in the Gard region, France: A first case study for the Cevennes-Vivarais Mediterranean Hydrometeorological Observatory. Journal of Hydrometeorology, 2005. 6(1): p. 34-52.
9. Huet, P., et al., Retour d'expérience des crues de septembre 2002 dans les départements du Gard, de l'Hérault, du Vaucluse, des Bouches-du-Rhône, de l'Ardèche et de la Drôme : rapport consolidé après phase contradictoire, 2003, Ministère de l'écologie
et du développement durable: France. p. 133. 10. Westrelin, S., et al. RHYTMME Project: Risk
management based on a radar network. in Proc. European Conf. on Radar in Meteorology and Hydrology. 2012.
11. Cosandey, C. and J. Didon-Lescot, Etude des crues cévenoles: conditions d’apparition dans un petit bassin forestier sur le versant sud du Mont Lozère, France. Regionalisation in Hydrology, IAHS
Publication, Ljubljana, Slovenia, 1990. 191: p.
103-115.
12. Weng, P. and N. Dörfliger, Projet PACTES— module: contribution des eaux souterraines aux crues et inondations; site de l'Hérault, 2002, Tech.
Rep. BRGM/RP-51718-FR, BRGM.
13. Cremonini, R., et al. CRISTAL: a project to manage hydrological risk in alpine areas by x-band polarimetric radar. in The sixth European Conference on radar in meteorology and hydrology. 2010. Sibiu, Romania.
14. Lavabre, J. and Y. Grégoris, AIGA: un dispositif d'alerte des crues sur l'ensemble du réseau hydrographique. Ingénieries-EAT, 2005(44): p. p.
3-p. 12.
15. Javelle, P., et al., Evaluating flash-flood warnings at ungauged locations using post-event surveys: a case study with the AIGA warning system.
Hydrological Sciences Journal-Journal Des Sciences Hydrologiques, 2014. 59(7): p.
1390-1402.
16. Javelle, P., et al. Setting up a French national flash flood warning system for ungauged catchments based on the AIGA method in 3rd European Conference on Flood Risk Management. 2016.
17th-21st october 2016, Lyon, France.
17. Varnes, D.J., Landslide hazard zonation: a review of principles and practice. 1984.
18. Blaikie, P., et al., At risk: natural hazards, people's vulnerability and disasters. 2014: Routledge.
19. Bolin, R. and L. Stanford, The Northridge Earthquake: Community-based Approaches to Unmet Recovery Needs. Disasters, 1998. 22(1): p.
21-38.
20. Kron, W., Keynote lecture: Flood risk= hazard× exposure× vulnerability. Proceedings of the Flood
Defence, 2002.
21. Lewis, J., Development in disaster-prone places : studies of vulnerability. Includes five case studies of vulnerability description and analysis. 1999,
London. p. 224.
22. Cutter, S., B.J. Boruff, and W.L. Shirley, Social Vulnerability to Environmental Hazards. Hazards,
Vulnerability, and Environmental Justice, 2006: p. 115-132.
23. Le Bihan, G., et al., Regional hydrological models for distributed flash-floods forecasting: towards an estimation of potential impacts and damages, in 9th Hymex Workshop2015: Mykonos, Greece
24. Pons, F., et al., EXZECO: A GIS and DEM based method for pre-determination of flood risk related to direct runoff and flash floods.
25. Pons, F., et al., Une contribution à l'évaluation de l'aléa inondation par ruissellement et crues soudaines, in SimHydro 20102011, /: 2-4 June
2010, Sophia Antipolis. p. 18 p.
26. Brémond, P., F. Grelot, and A.-L. Agenais, Review Article: economic evaluation of flood damage to agriculture-review and analysis of existing methods. Natural Hazards and Earth System
Sciences, 2013. 13: p. p. 2493-p. 2512.
27. Lugeri, N., et al., Flood risk in Europe: analysis of exposure in 13 Countries. European Commission
Directorate-General Joint Research Centre, EUR22525 EN, 2006.
28. Peduzzi, P., et al., Assessing global exposure and vulnerability towards natural hazards: the Disaster Risk Index. Natural Hazards and Earth System
Science, 2009. 9(4): p. 1149-1159.
29. Belmonte, A.M.C., M.J. López-García, and J. Soriano-García, Mapping temporally-variable exposure to flooding in small Mediterranean basins using land-use indexs. Applied Geography, 2011. 31(1): p. 136-145.
30. Ruin, I., et al., Human exposure to flash floods– Relation between flood parameters and human vulnerability during a storm of September 2002 in
Southern France. Journal of Hydrology, 2008. 361(1): p. 199-213.
31. Soto, D., F. Renard, and A. Magnon. Évaluation de la vulnérabilité territoriale des enjeux environnementaux du Grand Lyon aux aléas technologiques. in INFORSID. 2014.
32. Renard, F. and D. Soto, Une représentation du risque à l’intersection de l’aléa et de la vulnérabilité: cartographies des inondations lyonnaises. Geographica Helvetica, 2015. 70: p.
333-348.
33. Saaty, T.L., How to make a decision: the analytic hierarchy process. European journal of operational
research, 1990. 48(1): p. 9-26.
34. Jenks, G.F., Generalization in statistical mapping.
Annals of the Association of American Geographers, 1963. 53(1): p. 15-26.
35. Corvey, W.J., et al. Foundations of a Multilayer Annotation Framework for Twitter Communications During Crisis Events. in LREC.
2012. Citeseer.
36. Coyle, D. and P. Meier, New technologies in emergencies and conflicts: the role of information and social networks, in New Technologies in Emergencies and Conflicts: The Role of Information and Social Networks. 2009, United
Nations Foundation; Vodafone Foundation. 37. Ruin, I., et al., Social and hydrological responses to
extreme precipitations: An interdisciplinary strategy for postflood investigation. Weather,
Climate, and Society, 2014. 6(1): p. 135-153.
38. Downton, M.W. and R.A. Pielke, How accurate are disaster loss data? The case of US flood damage. Natural Hazards, 2005. 35(2): p. 211-228.